. 2024 Jun;28(11):e18473.
doi: 10.1111/jcmm.18473.

Unveiling the role of RAC3 in the growth and invasion of cisplatin-resistant bladder cancer cells

Affiliations

Unveiling the role of RAC3 in the growth and invasion of cisplatin-resistant bladder cancer cells

Haodong Li et al. J Cell Mol Med. 2024 Jun.

Abstract

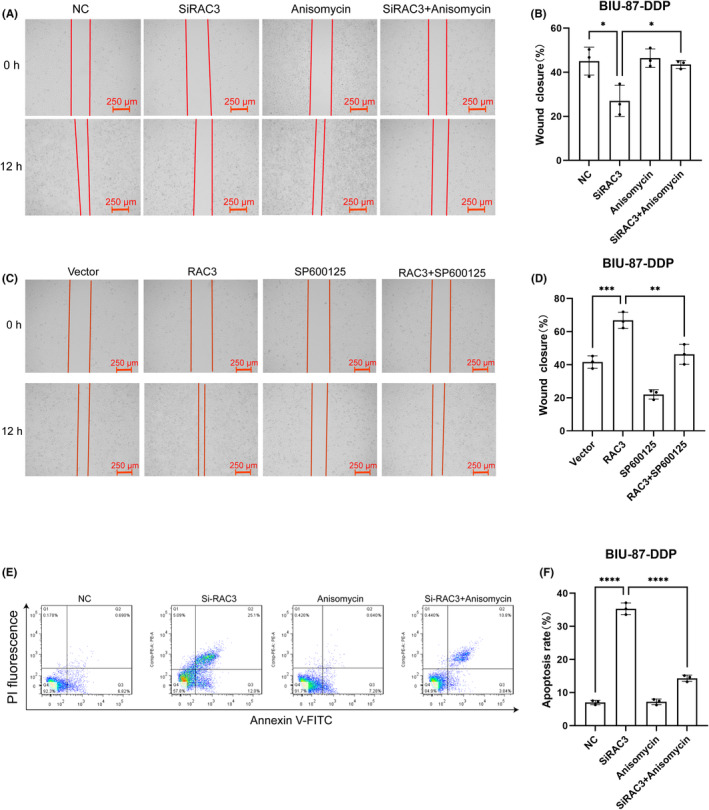
Bladder cancer is one of the most prevalent cancers worldwide, and its morbidity and mortality rates have been increasing over the years. However, how RAC family small GTPase 3 (RAC3) affects the proliferation, migration and invasion of cisplatin-resistant bladder cancer cells remains unclear. Bioinformatics techniques were used to investigate the expression of RAC3 in bladder cancer tissues. Influences of RAC3 in the grade, stage, distant metastasis, and survival rate of bladder cancer were also examined. Analysis of the relationship between RAC3 expression and the immune microenvironment (TIME), genomic mutations, and stemness index. In normal bladder cancer cells (T24, 5637, and BIU-87) and cisplatin-resistant bladder cancer cells (BIU-87-DDP), the expression of RAC3 was detected separately with Western blotting. Plasmid transfection was used to overexpress or silence the expression of RAC3 in bladder cancer cells resistant to cisplatin (BIU-87-DDP). By adding activators and inhibitors, the activities of the JNK/MAPK signalling pathway were altered. Cell viability, invasion, and its level of apoptosis were measured in vitro using CCK-8, transwell, and flow cytometry. The bioinformatics analyses found RAC3 levels were elevated in bladder cancer tissues and were associated with a poor prognosis in bladder cancer. RAC3 in BIU-87-DDP cells expressed a higher level than normal bladder cancer cells. RAC3 overexpression promoted BIU-87-DDP proliferation. The growth of BIU-87-DDP cells slowed after the knockdown of RAC3, and RAC3 may have had an impact on the activation of the JNK/MAPK pathway.

Keywords: JNK; RAC3; bladder cancer; cisplatin resistance; invasion; proliferation.


Conflict of interest statement

The authors declare that they have no conflict of interest to disclose.

Figures

FIGURE 1
FIGURE 1
The upregulation of RAC3 corresponds to poor patient prognosis. (A) RAC3 expression differs between bladder cancer tissues and normal tissues. (B) RAC3 expression differs across the stages of bladder cancer. (C) RAC3 expression differs across the grades of bladder cancer. (D) RAC3 expression differs across stages of bladder cancer in patients with distant tumour metastases. (E) ROC curves for RAC3 in bladder cancer. (F) The expression of RAC3 in the GSE13507 dataset. (G) RAC3 expression in the GSE3167 dataset. (H) RAC3 expression in the GSE37815 dataset. (I) RAC3 expression in the GSE7476 dataset. (J) In the GSE13507 dataset, RAC3 expression differed in different grades of bladder cancer. (K) In the GSE13507 dataset, RAC3 expression differed in different T‐stage bladder cancers. (L) Relationship between RAC3 expression levels and cancer‐specific survival in the GSE13507 dataset. (M) RAC3 protein expression in normal bladder tissue and uroepithelial carcinoma. (N) Kaplan–Meier analysis was applied to analyse the survival curves of RAC3 expression variations in patients with bladder cancer. (O, P) The relationship between RAC3 expression and overall survival (OS). (P) The relationship between RAC3 expression and disease‐free survival (DFS). The data is presented as the mean ± SD. *p < 0.05, **p < 0.01, ***p < 0.001.
FIGURE 2
FIGURE 2
RAC3 as a predictor of bladder cancer. (A) Kaplan–Meier curves show survival differences between high and low RAC3 expression in patients <60 years of age. (B) Kaplan–Meier curves showing survival differences between high and low RAC3 expression in male patients. (C) Kaplan–Meier curves show survival differences between high and low RAC3 expression in white populations. (D) Kaplan–Meier curves show survival differences between high and low RAC3 expression in patients with high‐grade bladder cancer. (E) Kaplan–Meier curves showing survival differences between high and low RAC3 expression in patients with T3/4‐staged bladder cancer. (F) Kaplan–Meier curves showing survival differences between high and low RAC3 expression in patients with N0‐staged bladder cancer. (G) Kaplan–Meier curves showing survival differences between high and low RAC3 expression in bladder cancer patients with a smoking history of ≥2 years. (H) ROC curves for RAC3 in bladder cancer. (I, J) Univariate and multivariate COX regression analyses were performed to analyse the association between age, sex, T, stage and RAC3 expression and bladder cancer survival. (K) A nomogram was constructed using age, sex, T, stage, and high or low RAC3 expression (with median as the cutoff value). (L) Calibration curve for nomogram.
FIGURE 3
FIGURE 3
Genetic mutation and methylation alteration of RAC3 in BLCA. (A) RAC3 mutation frequency in pan‐cancer. (B) Major mutation types of RAC3 in pan‐cancers. (C) RAC3 mutation frequency in bladder cancer. (D) The mutation number and site of the RAC3 genetic alterations. (E) Correlation of RAC3 methylation levels and gene expression in bladder cancer patients.
FIGURE 4
FIGURE 4
Detection of RAC3 expression by single cell analysis. (A) Cell clusters for GSE135337 of 7 BLCA patients. (B) Cell markers for clusters' annotation. (C, D) RAC3 expression in tissues of seven BLCA patients.
FIGURE 5
FIGURE 5
Association of RAC3 with immune infiltration and tumour stemness. (A–C)The score of stromal, immune, ESTIMATE in two groups (RAC3 high vs. RAC3 low). (D, E) Relationship between RAC3 and immune cell infiltration. (F, G) Relationship between RAC3 and tumour stemness score. *p < 0.05, **p < 0.01, ***p < 0.001.
FIGURE 6
FIGURE 6
Cisplatin‐resistant bladder cancer cells. (A) A CCK‐8 assay was used to determine the cell viability of various bladder cancer cells following cisplatin therapy. (B–D) A transwell assay was used to evaluate bladder cancer cell migration and invasion capacity after cisplatin therapy. (E–G) Western blotting assay was performed to detect RAC3, JNK, and p‐JNK levels in T24, 5637, BIU‐87 and BIU‐87‐DDP cells. **p < 0.01, ***p < 0.001, ****p < 0.0001; ns, no significance.
FIGURE 7
FIGURE 7
Effective silencing and overexpression of RAC3 in bladder cancer cells altered the JNK signalling pathway. (A–B) The effect of transfection of different siRNA sequences on RAC3 expression in BIU‐87‐DDP cells. (C–D) RAC3, JNK, and p‐JNK expression levels were detected by Western blotting after RAC3 silencing and treated with the JNK activator. (E–F) RAC3, JNK, and p‐JNK expression levels after RAC3 overexpression and after using JNK inhibitors, as detected by Western blotting. **p < 0.01, ***p < 0.001, ****p < 0.0001; ns, no significance.
FIGURE 8
FIGURE 8
RAC3 activates JNK/MAPK signalling to enhance the proliferation and invasion of cisplatin‐resistant bladder cancer cells. (A) A CCK‐8 assay was used to assess the proliferative capacity of cells after RAC3 knockdown and transfection with the JNK activator anisomycin. (B) A CCK‐8 assay was performed to assess the proliferation capacity of cells after RAC3 overexpression and treated with the JNK inhibitor SP600125. (C, D) Transwell assay and quantification of the invasive capacity of cells after RAC3 knockdown and treated with the JNK activator anisomycin. (E, F) Transwell assay and quantification of invasive ability of cells after RAC3 overexpression and after using the JNK inhibitor SP600125. **p < 0.01, ***p < 0.001, ****p < 0.0001.
FIGURE 9
FIGURE 9
RAC3 activates JNK/MAPK signalling to promote the migration of cisplatin‐resistant bladder cancer cells. (A, B) A wound healing assay was performed to assess the migration capacity of cells after. RAC3 silencing and treatment with the JNK activator anisomycin. (C, D) Wound healing assay to assess the migration capacity of cells after RAC3 overexpression and treatment with the JNK inhibitor SP600125. (E, F) Flow cytometry assay of the apoptotic ratio of cells after RAC3 silencing and treatment with the JNK activator anisomycin. *p < 0.05, **p < 0.01, ***p < 0.001, ****p < 0.0001.
FIGURE 10
FIGURE 10
Analysis of RAC3 related genes. (A) BioGRID web platform was used to get RAC3‐interacted molecules. (B) A volcano plot depicting some genes associated with the RAC3 expression in BLCA. (C) Heat map indicating the top 50 genes that were positively associated with the RAC3 expression in BLCA. (D) Heat map indicating the top 50 genes negatively associated with the RAC3 expression in BLCA. (E) RAC3 related interacting protein network obtained through STRING tool.

Similar articles

Cited by

References

    1. Sung H, Ferlay J, Siegel RL, et al. Global cancer statistics 2020: GLOBOCAN estimates of incidence and mortality worldwide for 36 cancers in 185 countries. CA Cancer J Clin. 2021;71(3):209‐249. - PubMed
    1. Bray F, Ferlay J, Soerjomataram I, Siegel RL, Torre LA, Jemal A. Global cancer statistics 2018: GLOBOCAN estimates of incidence and mortality worldwide for 36 cancers in 185 countries. CA Cancer J Clin. 2018;68(6):394‐424. - PubMed
    1. Witjes JA, Bruins HM, Cathomas R, et al. European Association of Urology Guidelines on muscle‐invasive and metastatic bladder cancer: summary of the 2020 guidelines. Eur Urol. 2021;79(1):82‐104. - PubMed
    1. Dobruch J, Oszczudłowski M. Bladder cancer: current challenges and future directions. Medicina (Kaunas). 2021;57(8):749. - PMC - PubMed
    1. Li F, Zheng Z, Chen W, et al. Regulation of cisplatin resistance in bladder cancer by epigenetic mechanisms. Drug Resist Updat. 2023;68:100938. - PubMed

MeSH terms