

Prognostic prediction of patients having classical papillary thyroid carcinoma with a 4 mRNA-based risk model
- PMID: 38847736
- PMCID: PMC11155612
- DOI: 10.1097/MD.0000000000038472
Prognostic prediction of patients having classical papillary thyroid carcinoma with a 4 mRNA-based risk model
Abstract
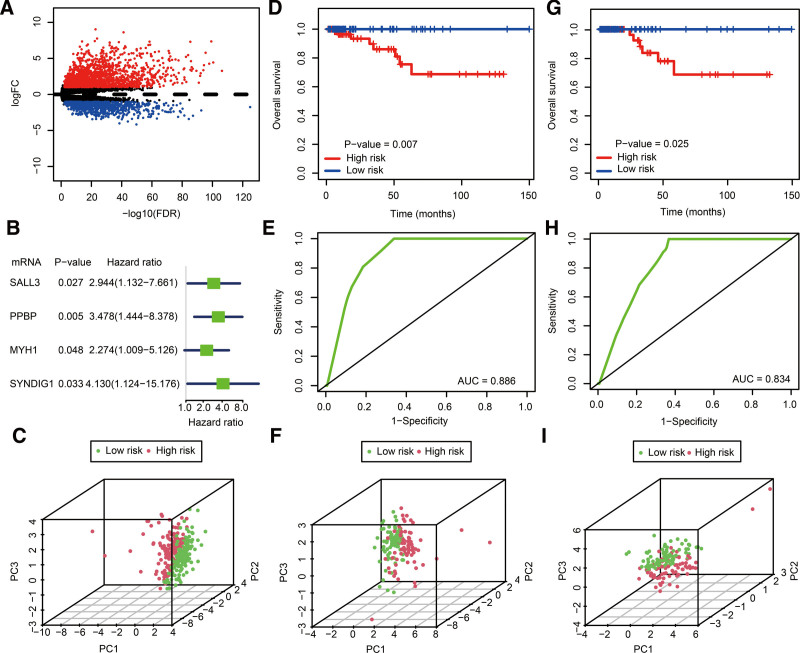
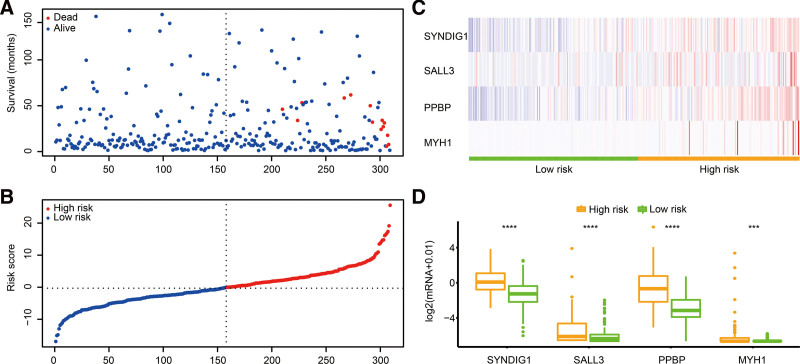
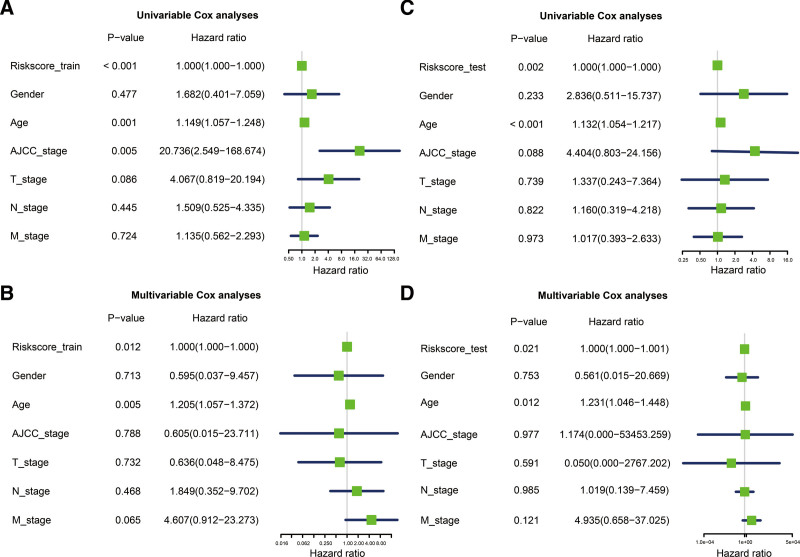
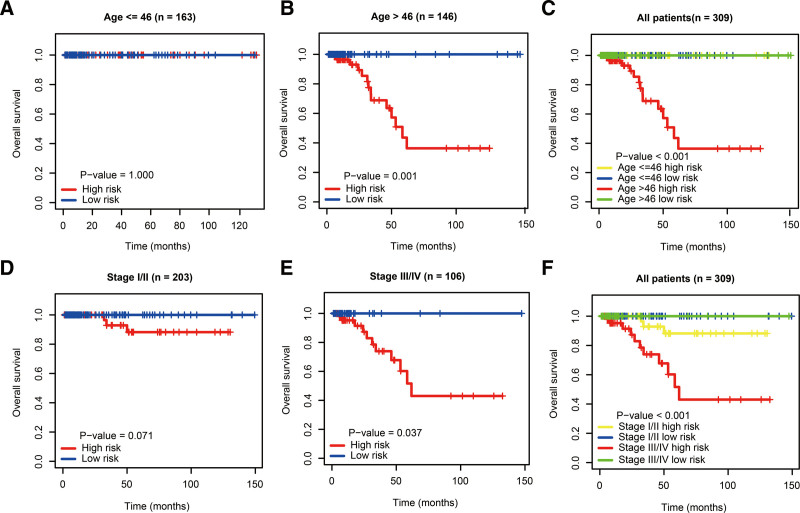
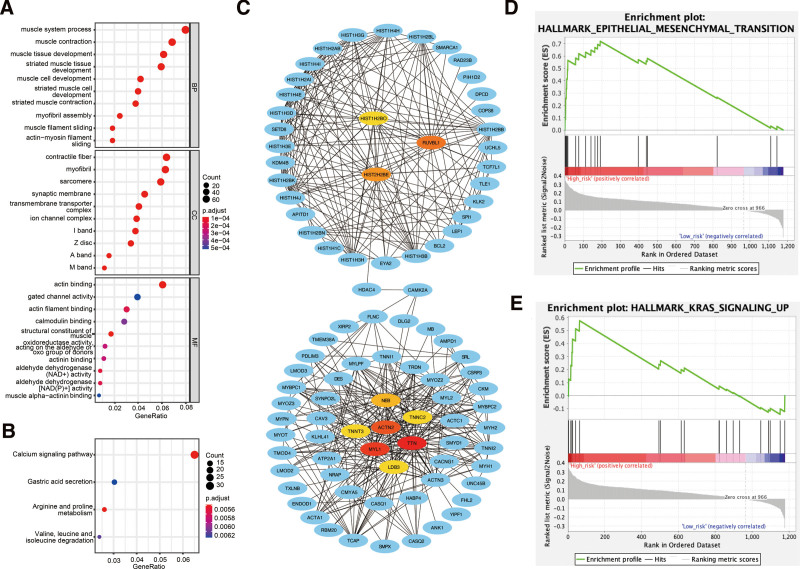
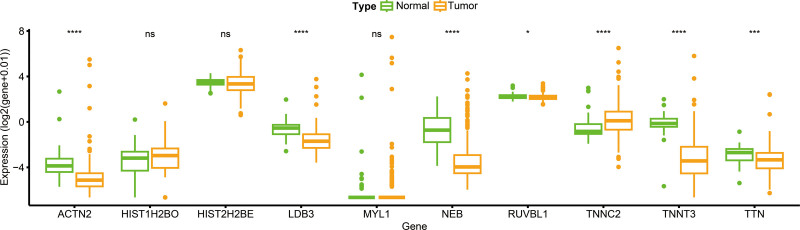
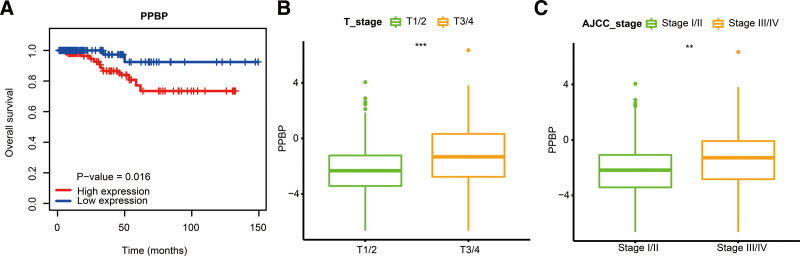
The dysregulation of protein-coding genes involved in various biological functions is closely associated with the progression of thyroid cancer. This study aimed to investigate the effects of dysregulated gene expressions on the prognosis of classical papillary thyroid carcinoma (cPTC). Using expression profiling datasets from the Cancer Genome Atlas (TCGA) database, we performed differential expression analysis to identify differentially expressed genes (DEGs). Cox regression and Kaplan-Meier analysis were used to identify DEGs, which were used to construct a risk model to predict the prognosis of cPTC patients. Functional enrichment analysis unveiled the potential significance of co-expressed protein-encoding genes in tumors. We identified 4 DEGs (SALL3, PPBP, MYH1, and SYNDIG1), which were used to construct a risk model to predict the prognosis of cPTC patients. These 4 genes were independent of clinical parameters and could be functional in cPTC carcinogenesis. Furthermore, PPBP exhibited a strong correlation with poorer overall survival (OS) in the advanced stage of the disease. This study suggests that the 4-gene signature could be an independent prognostic biomarker to improve prognosis prediction in cPTC patients older than 46.
Copyright © 2024 the Author(s). Published by Wolters Kluwer Health, Inc.
Conflict of interest statement
The authors have no conflicts of interest to disclose.
Figures
Similar articles
-
Development and validation of a ferroptosis-related prognostic model for the prediction of progression-free survival and immune microenvironment in patients with papillary thyroid carcinoma.Int Immunopharmacol. 2021 Dec;101(Pt A):108156. doi: 10.1016/j.intimp.2021.108156. Epub 2021 Oct 6. Int Immunopharmacol. 2021. PMID: 34624650
-
Role of differentially expressed genes and long non-coding RNAs in papillary thyroid carcinoma diagnosis, progression, and prognosis.J Cell Biochem. 2018 Nov;119(10):8249-8259. doi: 10.1002/jcb.26836. Epub 2018 Jul 3. J Cell Biochem. 2018. PMID: 29968931
-
Low expression of TFF3 in papillary thyroid carcinoma may correlate with poor prognosis but high immune cell infiltration.Future Oncol. 2022 Jan;18(3):333-348. doi: 10.2217/fon-2020-1183. Epub 2021 Nov 10. Future Oncol. 2022. PMID: 34756116
-
Identification of lipid metabolism-related genes as prognostic indicators in papillary thyroid cancer.Acta Biochim Biophys Sin (Shanghai). 2021 Dec 8;53(12):1579-1589. doi: 10.1093/abbs/gmab145. Acta Biochim Biophys Sin (Shanghai). 2021. PMID: 34693452
-
Correlation between telomerase reverse transcriptase messenger RNA expression and survival of patients with papillary thyroid carcinoma.Surgery. 2021 Jan;169(1):43-49. doi: 10.1016/j.surg.2020.04.054. Epub 2020 Jul 5. Surgery. 2021. PMID: 32641280
References
-
- Seib CD, Sosa JA. Evolving understanding of the epidemiology of thyroid cancer. Endocrinol Metab Clin North Am. 2019;48:23–35. - PubMed
-
- Siegel RL, Miller KD, Jemal A. Cancer statistics, 2019. CA Cancer J Clin. 2019;69:7–34. - PubMed
-
- Lamartina L, Grani G, Durante C, et al. . Follow-up of differentiated thyroid cancer - what should (and what should not) be done. Nat Rev Endocrinol. 2018;14:538–51. - PubMed
-
- Links TP, van Tol KM, Jager PL, et al. . Life expectancy in differentiated thyroid cancer: a novel approach to survival analysis. Endocr Relat Cancer. 2005;12:273–80. - PubMed
MeSH terms
Substances
LinkOut - more resources
Full Text Sources
Medical
