. 2024 Jul 3;50(4):492-516.
doi: 10.1080/00952990.2024.2355540. Epub 2024 Jun 7.

Differential effects of moderate chronic ethanol consumption on neurobehavior, white matter glial protein expression, and mTOR pathway signaling with adolescent brain maturation

Affiliations

Differential effects of moderate chronic ethanol consumption on neurobehavior, white matter glial protein expression, and mTOR pathway signaling with adolescent brain maturation

Emine B Yalcin et al. Am J Drug Alcohol Abuse. .

Abstract

Background: Adolescent brains are highly vulnerable to heavy alcohol exposure. Increased understanding of how alcohol adversely impacts brain maturation may improve treatment outcomes.Objectives: This study characterizes short-term versus long-term effects of ethanol feeding on behavior, frontal lobe glial proteins, and mTOR signaling.Methods: Adolescent rats (8/group) were fed liquid diets containing 26% or 0% ethanol for 2 or 9 weeks, then subjected to novel object recognition (NOR) and open field (OF) tests. Frontal lobes were used for molecular assays.Results: Significant ethanol effects on OF performance occurred in the 2-week model (p < .0001). Further shifts in OF and NOR performance were unrelated to ethanol exposure in the 9-week models (p < .05 to p < .0001). Ethanol inhibited MAG1 (p < .01) and MBP (p < .0001) after 2 but not 9 weeks. However, both control and ethanol 9-week models had significantly reduced MAG1 (p < .001-0.0001), MBP (p < .0001), PDGFRA (p < .05-0.01), and PLP (p < .001-0.0001) relative to the 2-week models. GFAP was the only glial protein significantly inhibited by ethanol in both 2- (p < .01) and 9-week (p < .05) models. Concerning the mTOR pathway, ethanol reduced IRS-1 (p < .05) and globally inhibited mTOR (p < .01 or p < .001) in the 9- but not the 2-week model.Conclusions: Short-term versus long-term ethanol exposures differentially alter neurobehavioral function, glial protein expression, and signaling through IRS-1 and mTOR, which have known roles in myelination during adolescence. These findings suggest that strategies to prevent chronic alcohol-related brain pathology should consider the increased maturation-related vulnerability of adolescent brains.

Keywords: Alcohol; adolescence; mTOR; oligodendrocytes; rat model; white matter.


Conflict of interest statement

Disclosure statement

The authors have no conflicts of interest related to the content of this manuscript.

Figures

Figure 1.
Figure 1.. Short- and long-term moderate alcohol exposure on body weight, brain weight, blood alcohol, and blood glucose levels.
Long Evans male and female rats maintained on isocaloric liquid diets containing 0% (control) or 26% ethanol (n = 8/group) were monitored for weight gain over time. In both the (a) short-term and (b) long-term models, females consistently weighed less than males with respect to ethanol exposure. Terminal mean (±S.D.) (c) body weights, (d) brain weights, (e) blood alcohol concentrations, and (f) blood glucose including both sexes at each time point were compared among the groups by two-way ANOVA (See Table 2) with post hoc Tukey tests (*p ≤ .05; ***p<.001; ****p<.0001). Mean (c) body and (d) brain weights were significantly higher in the long-term model, and (e) blood alcohol was significantly elevated by chronic ethanol diet feeding. (a, b) Growth, (c) body weight, (d) brain weight, and (f) blood glucose levels were not significantly affected by alcohol exposure.
Figure 2.
Figure 2.. Novel Object Recognition (NOR).
in the final week of feeding with isocaloric control or ethanol-containing liquid diets, rats (n = 8/group) were subjected to the Novel Object Recognition (NOR) test in which the percentages of time spent (a) at or (b) in the novel object area were tracked and analyzed using EthoVision XT v16 software. The panels show box plots and significant inter-group differences obtained by two-way ANOVA (Table 3) and the post hoc Tukey test (***p<.0001). Significant effects on nor performance were driven by model duration and not ethanol exposure per se.
Figure 3.
Figure 3.. Open Field (OF) Test.
Of test performance was assessed in the final week of feeding the rats with isocaloric control or ethanol-containing liquid diets (n = 8/group). Performance measures included the (a) percentage (%) of time spent in the center, (b) number (#) of entries into the center, (c) latency to arrive in the center, (d) total distance moved (cm), and (e) velocity of movement (m/sec). Activity was tracked and analyzed using EthoVision XT v16 software. The panels depict box plots and significant inter-group differences by two-way ANOVA (Table 3) and the post hoc Tukey test (***p<.01; ****p<.001; ****p<.0001). In the short-term model, ethanol significantly altered performance marked by increased distance moved and velocity of movement, whereas latency to arrive at the center, distance moved, and velocity of movement were significantly altered in the long-term versus short-term models, irrespective of ethanol exposure.
Figure 4.
Figure 4.. Glial Proteins.
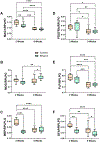
Effects of short-term (2 weeks) versus long-term (9 weeks) moderate-level ethanol exposure on frontal lobe expression of (a) MAG1, (b) MOG, (c) MBP, (d) PDGFRA, (e) PLP, and (f) GFAP in Long Evans rats. Control rats were fed an isocaloric ethanol-free diet. Immunoreactivity was measured by duplex ELISA with results normalized to RPLPO. Box plots depict inter-group differences that were analyzed by two-way ANOVA (Table 4) and the post hoc Tukey test (*p ≤ .05; ***p<.01; ****p<.001; ****p<.0001). Ethanol inhibited the expression of 3 of 6 glial proteins in the short-term model but only GFAP in the long-term model. Longer exposure durations (irrespective of ethanol) reduced the expression of MAG, MBP, PDGFRA, PLP, and GFAP relative to the short-term controls.
Figure 5.
Figure 5.. Stress-Related Molecules.
Effects of short-term versus long-term ethanol exposure on frontal lobe (a) HNE, (b) ubiquitin, and (c) 8-OHdG immunoreactivity. Immunoreactivity was measured by duplex ELISA with results normalized to RPLPO (N = 8 rats/group). Inter-group differences were analyzed by two-way ANOVA (See Table 4) with post hoc Tukey tests. *p ≤ .05; ***p<.01; ****p<.001; ****p<.0001. Significant differences were due to lower levels of HNE, ubiquitin, and 8-OHdG in the 9- versus 2-week model and lower ubiquitin in the ethanol-exposed relative to control 2-week model.
Figure 6.
Figure 6.. Upstream components of the Insulin/IGF-1-Akt-mTOR Pathway.
Commercial 11-plex magnetic bead-based ELISAs measured frontal lobe levels of (a) Insulin receptor (R), (b) pYpY1162/1163-Insulin-R, (c) p/T-Insulin-R, (d) IGF-1 R, (e) pYpY1135/1136-IGF-1 R, (f) p/T-IGF-1 R, (g) IRS-1, (h) pS636-IRS-1, and (I) p/T-IRS-1 in Long Evans rats (N = 8/group) maintained for 2 or 9 weeks on isocaloric liquid diets containing 0% (control) or 26% ethanol. Values correspond to arbitrary fluorescent light units (FLU). Inter-group comparisons were made by a two-way ANOVA with post hoc Tukey tests. *p ≤ .05; ***p<.01; ****p<.001; ****p<.0001. Ethanol significantly reduced IRS-1 and statistical trendwise increased the relative levels of serine phosphorylation (pS/T) of IRS-1 in the 9-week model. Otherwise, the main differences observed were due to model/exposure duration rather than ethanol per se.
Figure 7.
Figure 7.. Mid-level components of the Insulin/IGF-1-Akt-mTOR Pathway.
Commercial 11-plex magnetic bead-based ELISAs measured frontal lobe levels of (a) Akt, (b) pS473-Akt, (c) p/T-Akt, (d) PTEN, (e) pS380-PTEN, and (f) p/T-PTEN in Long Evans rats (N = 8/group) maintained for 2 or 9 weeks on isocaloric liquid diets containing 0% (control) or 26% ethanol. Values correspond to arbitrary FLU. Inter-group statistical comparisons were made by a two-way ANOVA with post hoc Tukey tests. *p ≤ .05; ***p<.01. The main effects were higher levels of Akt and reduced p/T-Akt in both 9-week versus the 2-week control groups, and reduced PTEN and increased pS/T-PTEN in 9-week controls versus the 2-week control and ethanol-exposed models.
Figure 8.
Figure 8.. GSK-3 signaling.
Commercial 11-plex magnetic bead-based ELISAs measured frontal lobe levels of (a) GSK-3α, (b) pS21-GSK-3α, (c) p/TGSK-3α, (d) GSK-3β, (e) pS9-GSK-3β, and (f) p/TGSK-3β in Long Evans rats (N = 8/group) maintained for 2 or 9 weeks on isocaloric liquid diets with 0% (control) or 26% ethanol. Values reflect arbitrary FLU. Inter-group statistical comparisons were made by a two-way ANOVA with post hoc Tukey tests. *p ≤ .05; ***p<.01; ****p<.001; ****p<.0001. The main effects were reduced levels of GSK-3α and increased p/T-GSK-3α in both 9-week versus the 2-week models, irrespective of ethanol exposure.
Figure 9.
Figure 9.. TSC2 and mTOR signaling.
Magnetic bead-based multiplex ELISAs measured immunoreactivity to (a) TSC2, (b) pS939-TSC2, (c) p/T-TSC2, (e) mTOR, (e) pS2448-mTOR, and (f) p/T- mTOR in rat frontal lobe samples (N = 8/group). Long Evans rats were maintained for 2 or 9 weeks on isocaloric liquid diets with 0% (control) or 26% ethanol. Values reflect arbitrary FLU. Inter-group statistical comparisons were made by a two-way ANOVA with post hoc Tukey tests. *p ≤ .05; ***p<.01; ****p<.001; ****p<.0001. The long-term models had higher levels of pS939-TSC2 and p/T-TSC2 relative to the 2-week models, irrespective of ethanol exposure. Although mTOR, pS2448-mTOR, and p/T- mTOR were significantly elevated in both control and ethanol-exposed 9-week versus 2-week models, ethanol significantly reduced the developmental or maturation-related responses in the 9-week model yet had no significant effects in the 2-week models.
Figure 10.
Figure 10.. Downstream signaling through p70S6K and RPS6.
Magnetic bead-based multiplex ELISAs measured immunoreactivity to (a) p70S6K, (b) pT412-p70S6K, (c) p/T-p70S6K, (d) RPS6, (e) pS235/236-RPS6, and (f) p/T- RPS6 in rat frontal lobe samples (N = 8/group). Long Evans rats were maintained for 2 or 9 weeks on isocaloric liquid diets with 0% (control) or 26% ethanol. Values reflect arbitrary FLU. Inter-group statistical comparisons were made by a two-way ANOVA with post hoc Tukey tests. ***p<.01. The only significant effects were higher levels of pT-p70S6K in the 9-week models relative to the ethanol-exposed 2-week model.

Similar articles

Cited by

References

    1. Stahre M, Roeber J, Kanny D, et al. Contribution of excessive alcohol consumption to deaths and years of potential life lost in the United States. Prev Chronic Dis. 2014;11:E109. doi:10.5888/pcd11.130293 - DOI - PMC - PubMed
    1. Bouchery EE, Harwood HJ, Sacks JJ, Simon CJ, Brewer RD. Economic costs of excessive alcohol consumption in the U.S. 2006. Am J Prev Med. 2011. Nov;41:516–24. doi:10.1016/j.amepre.2011.06.045 - DOI - PubMed
    1. Rehm J, Baliunas D, Borges GL, Graham K, Irving H, Kehoe T, Parry CD, Patra J, Popova S, Poznyak V, et al. The relation between different dimensions of alcohol consumption and burden of disease: an overview. Addiction. 2010;105:817–43. doi:10.1111/j.1360-0443.2010.02899.x - DOI - PMC - PubMed
    1. Sacks JJ, Gonzales KR, Bouchery EE, Tomedi LE, Brewer RD. 2010 National and state costs of excessive alcohol consumption. Am J Prev Med. 2015. Nov;49: e73–79. doi:10.1016/j.amepre.2015.05.031 - DOI - PubMed
    1. Brust J. Ethanol and cognition: indirect effects, neurotoxicity and neuroprotection: a review. Int J Environl Res Public Health. 2010;7:1540–57. doi:10.3390/ijerph7041540 - DOI - PMC - PubMed

LinkOut - more resources