. 2024 Aug 5;221(8):e20240045.
doi: 10.1084/jem.20240045. Epub 2024 Jun 7.

Urine scRNAseq reveals new insights into the bladder tumor immune microenvironment

Affiliations

Urine scRNAseq reveals new insights into the bladder tumor immune microenvironment

Michelle A Tran et al. J Exp Med. .

Abstract

Due to bladder tumors' contact with urine, urine-derived cells (UDCs) may serve as a surrogate for monitoring the tumor microenvironment (TME) in bladder cancer (BC). However, the composition of UDCs and the extent to which they mirror the tumor remain poorly characterized. We generated the first single-cell RNA-sequencing of BC patient UDCs with matched tumor and peripheral blood mononuclear cells (PBMC). BC urine was more cellular than healthy donor (HD) urine, containing multiple immune populations including myeloid cells, CD4+ and CD8+ T cells, natural killer (NK) cells, B cells, and dendritic cells (DCs) in addition to tumor and stromal cells. Immune UDCs were transcriptionally more similar to tumor than blood. UDCs encompassed cytotoxic and activated CD4+ T cells, exhausted and tissue-resident memory CD8+ T cells, macrophages, germinal-center-like B cells, tissue-resident and adaptive NK cells, and regulatory DCs found in tumor but lacking or absent in blood. Our findings suggest BC UDCs may be surrogates for the TME and serve as therapeutic biomarkers.


Conflict of interest statement

Disclosures: R. Sebra reported being a paid consultant with GeneDx, unrelated to the submitted work. M.D. Galsky reported personal fees from Bristol Myers, Merck, Genentech, Astra Zeneca, Pfizer, EMD Serono, Seagen, Janssen, Numab, Dragonfly, Glaxo Smith Kline, Basilea, Urogen, Rappta Therapeutics, Alligator, Silverback, Fujifilm, Curis, Gilead, Bicycle, Asieris, Abbvie, Analog Devices, and Veracyte outside the submitted work; consultancy in BioMotiv, Astellas, Inctye, Dracen, Inovio, Aileron; and grants from Dendreon and Novartis. N. Bhardwaj reported “other” from DC Prime and Vaccitech and grants from Merck outside the submitted work. In addition, N. Bhardwaj receives research support from Dragonfly Therapeutics, Harbour Biomed, and Regeneron and is a consultant, advisor, or board member for Apricity, BreakBio, Carisma Therapeutics, CureVac, Genentech, Genotwin, Novartis, Primevax, Rome Therapeutics, Tempest Therapeutics, and ATP. A. Horowitz receives research funding from Astra Zeneca and has served on advisory boards for Purple Biotech and UroGen. J.P. Sfakianos reports consultancy in Pacific Edge, Natera, and Merck. No other disclosures were reported.

Figures

None
Graphical abstract
Figure 1.
Figure 1.
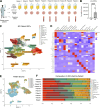
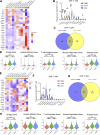
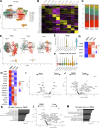
Single-cell transcriptomic profiling of BC patient UDCs. (A) Schematic of BC patient specimens collected. Created with Biorender. (B) Concentration of live UDCs (# of cells/ml urine) between BC and HD urine (n = 10 each). A Mann–Whitney test was performed (P value <0.0001; ****). (C) UMAP plot of 40,342 UDCs integrated from 10 BC urine samples. Cells are colored by cluster and annotated based on prior studies. With a resolution of 0.4, there were 18 clusters. (D) Heatmap demonstrating the average expression per cluster of genes used for their annotation. (E) UMAP plot of BC patient UDCs colored by donor origin. (F) Composition of BC UDCs by frequency. Bar plots display frequencies of cell types across the urine specimens.
Figure S1.
Figure S1.
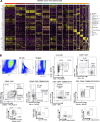
Characterization of UDCs. (A) Heatmap of the top five genes for each UDC cluster in the scRNAseq. (B) Flow cytometry profiling of a representative BC patient’s urine sample confirms the existence of several of the major immune subsets identified in our scRNAseq including CD8+ T cells, CD4+ T cells, NK cells, monocytes, neutrophils, B cells, and macrophages. Isotype controls are included for the gating schematic.
Figure 2.
Figure 2.
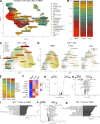
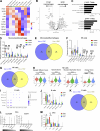
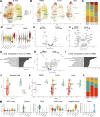
Comparison of cells across BC urine, tumor, and blood, and specifically CD4+ T cells. (A) UMAP of 106,587 integrated UDCs, tumor cells, and PBMC. With a resolution of 0.5, there were 22 clusters. Cells are color-coded according to their subset and annotated based on prior studies. (B) Bar-plot comparison of cluster frequencies across tissue. (C) UMAP of 25,538 CD4+ T cells across tissue. With a resolution of 0.6, there were 11 CD4+ T clusters. Cells are colored according to subset and annotated based on prior studies. (D) UMAP of CD4+ T cells split by tissue. (E) Bar-plot comparison of CD4+ T cell cluster composition across tissue. (F) Expression level of functional markers of interest in CD4+ T cells across tissue. (G and H) Volcano plot displaying DEGs between CD4+ T cells in (G) urine versus tumor and (H) in blood versus tumor. (I) GSEA on genes upregulated in CD4+ T cells in tumor versus blood. (J) Volcano plot depicting DEGs between CD4+ T cells in urine versus blood. (K) GSEA on genes upregulated in urine versus blood CD4+ T cells. Cutoffs of log2FC > |1| and P value <0.05 were for volcano plots and pathway analysis.
Figure S2.
Figure S2.
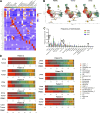
Cell composition across tissue compartment BC patients. (A) Heatmap displaying the average expression per cluster of genes used for their annotation across the 22 clusters of integrated cells from blood, urine, and tumor. (B) UMAP of integrated PBMC, UDCs, and tumor cells split by tissue. (C) Boxplot of cluster frequencies between tissue across all patients. (D) Bar plots of cell composition across matched urine, tumor, and blood specimens for each patient. Wilcoxon tests were performed (P value: * <0.05, ** <0.01, *** <0.001, **** <0.0001).
Figure S3.
Figure S3.
CD4+ and CD8+ T cell profiles across tissue in BC. (A) Heatmap of CD4+ T cell clusters demonstrating average expression per cluster of genes used for their annotation. (B) Boxplot of CD4+ T cell cluster frequencies between tissue across patients. (C) Venn diagram of shared genes between DEG analysis of CD4+ T cells in tumor versus PBMC and urine versus PBMC. (D) Expression of published gene signatures of lymphocyte cytolytic effector, anergy, activation, hypoxia, and glucose deprivation pathways in CD4+ T cells across tissue. (E–H) Repeat of the analyses in CD8+ T cell. Wilcoxon tests were performed (P value: * <0.05, ** <0.01, *** <0.001, **** <0.0001).
Figure 3.
Figure 3.
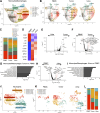
Exhausted bladder tumor CD8+ T cell subsets are present in urine but not in blood. (A) UMAP of 8,784 CD8+ T cells across all BC blood, tumor, and urine. There were 12 CD8+ T clusters unbiasedly identified with a resolution of 0.6. Cells are colored according to their defined subset and annotated based on prior studies. (B) UMAP of CD8+ T cells split by tissue. (C) Bar-plot comparison of CD8+ T cell cluster composition across tissue. (D) Expression level of functional genes of interest in CD8+ T cells across tissue. (E and F) Volcano plot representing DEGs between CD8+ T cells in (E) urine versus tumor and (F) in blood versus tumor. (G) Pathways upregulated in tumor versus blood CD8+ T cells. (H) Volcano plot displaying DEGs between CD8+ T cells in urine versus blood. (I) Pathways enriched in urine versus blood CD8+ T cells. Cutoffs of log2FC > |1| and P value <0.05 were used for volcano plots and pathway analysis.
Figure S4.
Figure S4.
Monocyte (Mono), macrophage (MΦ), NK cell, B cell, and DC characterization across tissue in BC. (A) Heatmap of monocyte and macrophage clusters demonstrating the average expression per cluster of genes used for their annotation. (B and C) (B) Volcano plot and (C) GSEA of DEGs between C1QC and SPP1 TAMs. (D) Boxplot of monocyte and macrophage cluster frequencies across tissue for all patients. (E) Venn diagram of shared genes between DEG analysis of monocyte and macrophages in tumor versus PBMC and urine versus PBMC. (F) Boxplot comparing NK cluster frequency between tissue compartments across all patients. (G) Venn diagram of overlapping DEGs of NKs in tumor versus PBMC and urine versus PBMC. (H) Expression of published signatures of lymphocyte cytolytic effector, anergy, activation, hypoxia, and glucose deprivation pathways in NK cells across tissues. Wilcoxon tests were performed (P value: * <0.05, ** <0.01, *** <0.001, **** <0.0001). (I) Dot plot of B cell annotation markers across clusters. (J) Boxplot depicting B cell cluster composition between tissue compartments across all patients. (K) Venn diagram of overlapping DEGs of B cells in tumor versus PBMC and urine versus PBMC. (L) Expression levels of CLEC9A and XCR1 across DC clusters. Ranked from highest (left) to lowest (right). (M) Boxplot displaying the frequency of DC clusters between tissue compartments across patients.
Figure 4.
Figure 4.
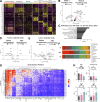
BC urine reflects tumor macrophage phenotypes and biology better than blood. (A) UMAP of 11,661 monocytes (Mono) and macrophages (MΦ) across BC blood, tumor, and urine. There were eight clusters identified with a resolution of 0.5. Cells are colored according to cluster and annotated based on published markers. (B) UMAP of monocytes and macrophages split by tissue. (C) Bar-plot comparison of myeloid cluster composition across tissue. (D) Expression level of markers of interest in myeloid cells across tissue. (E and F) Volcano plot displaying DEGs between monocytes and macrophages in (E) urine versus tumor and (F) in blood versus tumor. (G) Pathways upregulated in myeloid cells in tumor versus blood. (H) Volcano plot depicting DEGs between monocytes and macrophages in urine versus PBMC. (I) Pathways enriched in urine versus blood myeloid cells. Cutoffs of log2FC > |1| and P value <0.05 were used for volcano plots and pathway analysis. (J) UMAP of 1,571 neutrophils. There were five clusters identified with a resolution of 0.3. Cells are colored by cluster. (K) UMAP of neutrophils split by tissue. (L) Bar plot comparison of neutrophil cluster composition across tissue.
Figure S5.
Figure S5.
Assessment of BC UDCs across different treatments and proteomic profile of urine across disease stage. (A) Heatmap of top DEGs per cell cluster of UDCs from the BC patient who underwent BCG induction therapy. (B and C) (B) Volcano plot and (C) GSEA representing DEGs between UDCs from the Week (W) 1 pre-BCG and Week 6 post-BCG collections. (D and E) Volcano plot of DEGs between urothelial cells from BC Patient 7 before and after chemotherapy (D) in tumor and (E) in urine. (F) Bar plots of UDC composition across HDs and NMIBC and MIBC patients. (G) Hierarchically clustered heatmap of NPX levels of all 92 analytes of the Olink Immuno-Oncology panel in 10 HDs, 15 NMIBC, and 10 MIBC patients. (H) Bar plots comparing NPX levels of IFNγ, granzyme B, IL-8, and IL-6 in the urine across HD, NMIBC, and MIBC patients. Wilcoxon tests were performed (P value: * <0.05, ** <0.01, *** <0.001).
Figure 5.
Figure 5.
The NK profile in BC urine better resembles that of the tumor than the blood. (A) UMAP of 4,130 NK cells across BC blood, tumor, and urine. Cells are colored according to cluster. With a resolution of 0.5, there were 10 clusters. (B) Heatmap of top 10 genes for each NK cluster, displayed as averaged per cluster. (C) UMAP of NK cells split by tissue. (D) Bar-plot comparison of NK cluster frequency across tissue. (E and F) (E) Expression level of RGS1 and (F) an adaptive NK score across the clusters. (G) Average expression of NK markers associated with tissue residency and function across tissue. (H) Average expression of NK activating and inhibitory receptors and cytotoxic granules. (I and J) Volcano plot showing DEGs between NK cells in (I) urine versus tumor and in (J) blood versus tumor. (K) Pathways upregulated in NK cells in tumor versus blood. ESR, estrogen signaling receptor. (L) Volcano plot depicting DEGs between NK cells in urine versus blood. (M) Pathways enriched in urine versus blood NK cells. Cutoffs of log2FC > |1| and P value <0.05 were used for volcano plots and pathway analysis.
Figure 6.
Figure 6.
Comparison of B cells and DCs across tissue. (A) UMAP of 4,944 B cells across BC patient blood, tumor, and urine. With a resolution of 0.5, there were six clusters. Cells are colored according to cluster and annotated using published markers. (B) UMAP of B cells split by tissue. (C) Bar-plot comparison of B cell cluster composition across tissue. (D) Expression level of CXCR4 and CD83 across clusters. (E and F) Volcano plot displaying DEGs between B cells in (E) urine versus tumor and in (F) blood versus tumor. (G) Pathways differentially expressed in B cells between tumor and blood. (H) Volcano plot displaying DEGs between B cells in urine versus blood. (I) Pathways differentially expressed in B cells between urine versus blood. Cutoffs of log2FC > |1| and P value <0.05 were for volcano plots and pathway analysis. (J) UMAP of 982 DCs across tissue. Cells are colored by cluster. (K) UMAP of DCs split by tissue. (L) Bar-plot comparison of DC subset frequency across tissue. (M) Expression levels of published DC subset gene signatures of cDC1s, cDC2s, and mregDCs, and markers of pDCs: LILRA4 and TCF4, and monocyte-derived DCs (Mono_DC): FCN1 across clusters. ESR, estrogen signaling receptor; NGF, nerve growth factor.
Figure 7.
Figure 7.
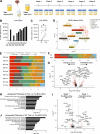
Intravesical BCG therapy for BC induces an inflammatory response as reflected by UDCs. (A) Schematic of urine collection from a BC patient undergoing BCG therapy. The patient’s voided urine was collected weekly, before and after hour-long BCG instillation, over the 6-week therapy. (B) Bar-plot of live UDCs from each urine sample represented in live cells per ml of urine. (C) Comparison of live UDCs before and after 1 hour of BCG, grouped across all 6 week of treatment. A paired Wilcoxon test was performed (P value = 0.0312; *). (D) UMAP of 1,423 UDCs integrated across urine collections from the patient. Cells are colored according to cluster. (E and F) Bar-plot comparison of UDC composition for each timepoint (E) and between pre- and post-BCG samples, across all timepoints (F). W, week. (G and H) (G) Volcano plot and (H) GSEA summarizing DEGs between pre- and post-BCG UDCs across all timepoints. (I and J) (I) Volcano plot and (J) GSEA of DEGs between pre- and post-BCG UDCs from Week 1. Cutoffs of log2FC > |1| and P value <0.05 were used for volcano plots and pathway analysis.
Figure 8.
Figure 8.
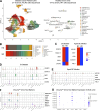
Assessment of BC versus HD UDCs and investigation of clinically available urine-based tests. (A) UMAP of 41,183 UDCs split by those from BC patients (40,342 cells) and those from pooled HD urine (841 cells). With a resolution of 0.4, there were 20 clusters. Cells are colored by cluster. (B) Bar plots of UDC composition in HD and BC urine. (C) Average heatmap comparing HD and BC patient UDCs expression of markers from the Cx Bladder and Xpert BC monitor tests. (D–F) Violin plots split across cells expressing individual markers comprising the (D) Cx Bladder, (E) Xpert BC Monitor, and (F) Oncuria tests. (G) Dot plot comparing expression of markers in the Oncuria urine test across BC urine samples collected during BCG therapy.

References

    1. Abedini, A., Zhu Y.O., Chatterjee S., Halasz G., Devalaraja-Narashimha K., Shrestha R., S Balzer M., Park J., Zhou T., Ma Z., et al. . 2021. Urinary single-cell profiling captures the cellular diversity of the kidney. J. Am. Soc. Nephrol. 32:614–627. 10.1681/ASN.2020050757 - DOI - PMC - PubMed
    1. Alexandrov, L.B., Nik-Zainal S., Wedge D.C., Aparicio S.A.J.R., Behjati S., Biankin A.V., Bignell G.R., Bolli N., Borg A., Børresen-Dale A.L., et al. . 2013. Signatures of mutational processes in human cancer. Nature. 500:415–421. 10.1038/nature12477 - DOI - PMC - PubMed
    1. Allen, C.D.C., Ansel K.M., Low C., Lesley R., Tamamura H., Fujii N., and Cyster J.G.. 2004. Germinal center dark and light zone organization is mediated by CXCR4 and CXCR5. Nat. Immunol. 5:943–952. 10.1038/ni1100 - DOI - PubMed
    1. Amara, N., Palapattu G.S., Schrage M., Gu Z., Thomas G.V., Dorey F., Said J., and Reiter R.E.. 2001. Prostate stem cell antigen is overexpressed in human transitional cell carcinoma. Cancer Res. 61:4660–4665. - PubMed
    1. Andreatta, M., Corria-Osorio J., Müller S., Cubas R., Coukos G., and Carmona S.J.. 2021. Interpretation of T cell states from single-cell transcriptomics data using reference atlases. Nat. Commun. 12:2965. 10.1038/s41467-021-23324-4 - DOI - PMC - PubMed