. 2024 Aug 15;30(16):3622-3639.
doi: 10.1158/1078-0432.CCR-24-0926.

Missense Mutations in Myc Box I Influence Nucleocytoplasmic Transport to Promote Leukemogenesis

Affiliations

Missense Mutations in Myc Box I Influence Nucleocytoplasmic Transport to Promote Leukemogenesis

Nancy B J Arthur et al. Clin Cancer Res. .

Abstract

Purpose: Somatic missense mutations in the phosphodegron domain of the MYC gene (MYC Box I or MBI) are detected in the dominant clones of a subset of patients with acute myeloid leukemia (AML), but the mechanisms by which they contribute to AML are unknown.

Experimental design: To investigate the effects of MBI MYC mutations on hematopoietic cells, we employed a multi-omic approach to systematically compare the cellular and molecular consequences of expressing oncogenic doses of wild type, threonine-58 and proline-59 mutant MYC proteins in hematopoietic cells, and we developed a knockin mouse harboring the germline MBI mutation p.T58N in the Myc gene.

Results: Both wild-type and MBI mutant MYC proteins promote self-renewal programs and expand highly selected subpopulations of progenitor cells in the bone marrow. Compared with their wild-type counterparts, mutant cells display decreased cell death and accelerated leukemogenesis in vivo, changes that are recapitulated in the transcriptomes of human AML-bearing MYC mutations. The mutant phenotypes feature decreased stability and translation of mRNAs encoding proapoptotic and immune-regulatory genes, increased translation of RNA binding proteins and nuclear export machinery, and distinct nucleocytoplasmic RNA profiles. MBI MYC mutant proteins also show a higher propensity to aggregate in perinuclear regions and cytoplasm. Like the overexpression model, heterozygous p.T58N knockin mice displayed similar changes in subcellular MYC localization, progenitor expansion, transcriptional signatures, and develop hematopoietic tumors.

Conclusions: This study uncovers that MBI MYC mutations alter RNA nucleocytoplasmic transport mechanisms to contribute to the development of hematopoietic malignancies.


Conflict of interest statement

Conflict of Interest Statement: The authors have declared that no competing interests exists.

Figures

Figure 1.
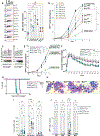
Figure 1.. AML-associated MYC mutations decrease apoptosis of HSPCs and initiate acute myeloid leukemia with shorter latency.
(A) 1×10⁶ GFP+, lineage depleted (Linlow) bone marrow cells isolated from C57Bl6 mice, and transduced with wild-type and mutated Myc vectors were lysed after treatment with Cycloheximide after 0 (controls), 15 min, 30 min, 1 hr, 2hrs and 4 hrs and subjected to western blot analysis using capillary electrophoresis. Left panel: lane-view images showing MYC and ACTIN bands in lysates from cells expressing WT and various MUT MYC proteins. Right panel: histogram plots showing the average and standard deviation of MYC half-life for WT and MUT proteins. N=3 for all constructs. Average half-life is indicated above each bar (one-way ANOVA, *p<0.05, ***p<0.001) (B) Expansion (GFP+ cells, confluence) of GFP+Linlow cells expressing wildtype MYC vs. selected MYC mutants vs. Empty Vector. The number of biological replicates for each construct is shown in the legend (one-way ANOVA, ***p<0.001, at day 4). (C-D) Western Blots and relative quantification (in rectangles within each lane) of MYC protein in HSPC transduced with Tet-On MycWT (C), or Tet-On MycMUT (D) exposed to different doxycycline concentrations. Red arrows indicate doxycycline concentrations with similar MYC protein levels at the time of analysis. (E) 5-days expansion and (F) apoptosis (as measured by Annexin V staining) of Linlow GFP+ murine HSPC transduced with Tet-On MycWT, Tet-On MycP59Q, or Tet-On MycT58N at doxycycline concentrations resulting in equivalent MYC protein levels (one-way ANOVA, p<0.001 at day 5); the Empty Vector growth curve is shown for reference. (G) Kaplan-Meier curves showing overall survival of primary recipients transplanted with HSPCs transduced with MycWT, MycP59Q, MycT58N or Empty Vectors. The number of mice transplanted in each arm is indicated in the legend (***p<0.001). (H) Cytospin images showing the myeloid morphology of the tumors derived from primary transplant recipients. Note the presence of immature-looking, large cells with round nuclei, nucleoli, and cytoplasmic granules (black arrowhead) and the presence of smaller, neutrophil-like cells with C-shaped or donut-like nuclei (red arrowhead). The star indicates a macrophage. Scalebar: 20 microns (μm). (I-J) Histogram plots of multiparameter flow cytometry data of bone marrow derived cells from sick mice at the time of takedown. GFP+ cells expressed cell surface markers of either (I) maturing myeloid cells or (J) granulocyte/macrophage progenitor (GMP: Linlow, Sca-1-, c-kit+, CD34+ and CD16/32+) (one-way ANOVA, columns are mean ± standard deviation; the number of biological replicates performed for each construct is shown in the legend; ns=not significant, *p<0.05, **p<0.01, ***p<0.001, ****p<0.0001).
Figure 2
Figure 2. MBI MYCMUT drive unique signature in preleukemic GMPs.
(A) UMAP projection of 34985 Linlow GFP+ cells, transduced with Empty Vector, MycWT, MycP59Q and MycT58N (combined in MBI Myc-MUT) split by genotype and colored by cell lineage (Neu= neutrophils, Baso=basophils, GMP=granulocyte macrophage progenitor, MEP= megakaryocyte erythroid progenitor, NP= neutrophil precursor, Mast=mast cells, Mono/Mac=monocyte macrophages progenitors). (B) Bar graph representing the cell type distribution as percentage of total cells in each genotype. GMP cells are highlighted by the red box. (C) Heatmap representing the DEGs in GFP+ GMP cells comparing Empty Vector vs. MYC expressing cells (MYC wildtype and MBI MYCMUT). Each genotype is indicated by the bar to the left of the heatmap (also refer to Supplementary Data S2 and S3). (D) Scatterplot of all terms in the KEGG_2019_Mouse gene set library. Each point represents a term in the library. Term frequency-inverse document frequency (TF-IDF) values is computed for the gene set corresponding to each term, and UMAP is applied to the resulting values. The terms are plotted based on the first two UMAP dimensions. Terms with more similar gene sets are positioned closer together. Larger and outlined dots represent the top significantly enriched terms in cluster 1 and cluster 2 DEGs. (E) Violin plots of AUCell scores for gene lists associated with myeloid stemness (top panel) or differentiation (bottom panel), in single cell transcriptomes of HSPCs transduced with Empty Vector, MycWT, MycP59Q and MycT58N. ANOVA, ***=FDR<0.001. (F) Enrichment for Gene Ontology terms in cluster 3 DEGs. Blue bars are significantly (FDR<0.05) downregulated pathways by MBI Myc mutations (also refer to Supplementary Data S4).
Figure 3.
Figure 3.. Oncogenic MYCWT and MBI MYCMUT expressing cells have superimposable chromatin binding profiles.
(A) Pie charts representing the gene section breakdown of ChIP signal derived from MYCWT and MBI MYCMUT proteins. TSS: transcriptional start sites. TTS: transcriptional termination sites. UTR: untranslated region. CDS: coding sequence (Supplementary Data S6). (B-C) Scatter plots representing normalized, and log transformed read counts from two independent ChIP-seq biological replicates. Each dot represents a region of DNA that was called using MACS over input samples. Comparisons of genotype pairs show no focal localization differences between genotypes. (D) Integrative Genomics Viewer (IgV) peaks view for wild type and mutant MYC proteins with their relative inputs (shown in grey) for cluster 3 genes H2-D1, Cdkn2a, Jun, and Cd34.
Figure 4.
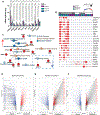
Figure 4.. MBI MYCMUT alter nucleocytoplasmic transport and mRNA subcellular distribution.
(A) Histogram plots of mRNA half-life as determined by qPCR analysis of selected cluster 3 transcripts for control, MYCWT, MYCP59Q and MYCT58N expressing cells. Data are average ± SD, n= 3 biological replicates. (one-way ANOVA, *p<0.05, **p<0.01, ***p<0.01). (B) Unsupervised hierarchical matrix of the average difference (Z-score) in protein expression in MBI MYCMUT vs. MYCWT expressing cells. Z scores are calculated based on normalized spectral counts from 2 independent experiments. The grey bar indicates doxycycline treatment, the white bar represent vehicle treated cells (also refer to Supplementary Data S7). (C) Integrative enrichment analysis and visualization of KEGG, Gene Ontology and Reactome pathways enriched in the differentially translated proteins by MBI MYCMUT expressing cells. (D-F) Volcano plots showing nuclear/cytoplasmic ratio changes of mRNA transcripts in HSPCs transduced with (D) MycWT, (E) MycT58N and (F) MycP59Q vectors. Highlighted are the cluster 3 genes that are differentially distributed between nuclear abd cytoplasmic fractions in MYCWT versus MBI MYCMUT expressing cells.
Figure 5.
Figure 5.. MBI MYCMUT have higher propensity to form aggregates in the cytoplasm and heightened sensitivity to proteasomal inhibition.
Panels (A-C) display Maximum Intensity Projections of Z-stack images taken from cytospins of HSPCs expressing MYCWT, MYCP59Q and MYCT58N. The green signal is MYC (Alexa Fluor 488), the red signal is LAMININ A/C (Alexa Fluor 647) and the blue signal is DNA (DAPI). Cells were treated with DMSO (A), or the CRM1 inhibitor KPT-330 (B), or the proteasome inhibitor MG-132 (C). Black arrowheads in the images highlight perinuclear MYC aggregates, which are present at baseline in MBI MYCMUT cells and become apparent in MYCWT cells after MG-132 treatment. Red arrowheads point to cytoplasmic speckles of laminin staining, which were noted in the context of some cytoplasmic MYC aggregates. A white arrow in (A) point to a cell undergoing mitosis. In panel (C), the white stars denote cells exhibiting changes in cytoplasmic morphology, such as vacuolization, after MG-132 treatment. Scalebar = 10 microns (μm). (D-F) MYC staining Mean Fluorescence Intensity (MFI) average in nuclear and cytoplasmic compartments of MYCWT(D), MYCP59Q (E) and MYCT58N (F) cells exposed to vehicle, KPT-330 or MG-132. Comparisons for each nuclear and cytoplasmic fractions are to the corresponding fractions of vehicle treated cells (two-tail t test, *p<0.05, ***<0.001). (G) Cytoplasmic to nuclear ratio of MFI MYC values from D-F. (H) Bar-graph representing the aggregation propensity of MYCWT, MYCP59Q and MYCT58N proteins as detected using PROTEOSTAT (one-way ANOVA, *p<0.05).
Figure 6.
Figure 6.. MycT58N/+ mice develop hematopoietic tumors.
(A) Schematic for the MycT58N/+ C57Bl6 mice (Created with BioRender.com). (B) Histogram plot and representative western blot images showing the steady state levels of MYC protein in HSPCs isolated from MycT58N/+ mice and wild type littermates (two-tail t test, **=p<0.01). (C) Kaplan-Meier curves showing the overall survival of MycT58N/+ and wild type littermates censored at the time of writing (*=p<0.05). (D) Hematoxylin-Eosin of bone marrow sections showing marked increase in bone marrow cells that are abnormally maturing myeloid elements, intersperse are larger/hyperlobated megakaryocytes, features that are compatible with a myeloproliferative disease (E-F) Hematoxylin-Eosin of spleens (E) and lymph nodes (F) showing two populations of cells: mononuclear cells with dispersed (lighter) chromatin, distinct nucleoli and at least some cytoplasm, which in some cells contains granules (myeloid cells). A separate population of mononuclear cells with more condensed (darker) chromatin, less distinct nucleoli and higher nuclear to cytoplasm ratio (less cytoplasm), which may correspond to the lymphoid component of the tumor. The populations are demarcated by dashed lines in the microphotographs. The architecture of the spleen is effaced predominantly by the myeloid infiltrate but there are occasional follicular structures of lymphoid cells, although these structures do not represent normal secondary follicles. There is also evidence of extramedullary hematopoiesis in the form of scattered megakaryocytes. The architecture of the lymph node appears to be mostly effaced by myeloid elements. (G) Hematoxylin-Eosin of liver showing myeloid-like infiltrates involving the area surrounding the central vein. (H-I) UMAP projection of 36085 cells derived from 6-months old Myc+/+ (H) and MycT58N/+ (I) mice (n=2 per genotype). Colors reflect graph-based clustering, based on transcriptomic similarities amongst the cells, as indicated on the figure (GMP= granulocyte-macrophage; DC=dendritic cell progenitor; MEP= megakaryocyte erythroid progenitor; MPP= multipotent progenitor; LT-HSC= long-term hematopoietic stem cell; CMP= common myeloid progenitor; CLP= common lymphoid progenitor; MP= myeloid progenitor. Also refer to Supplementary Data S8) (J-K) Trajectory analysis of clusters 1–7 and 10 in Myc+/+ (J) and MycT58N/+ (K). (L) Significantly enriched gene sets in GMP-like cells of MycT58N/+ versus Myc+/+ mice. Gene set enrichment analysis plots are at the top and heatmaps of leading-edge genes on the bottom. Normalized Enrichment Scores for each panel are: 2.45 for (left), 2.21 (middle), and 2.56 (right). FDR=0 for all. (M) Bar graph of the enrichment scores for the top differentially enriched pathway between MycT58N/+ and Myc+/+ GMP-like cells, represented are only highly significant pathways (ANOVA, FDR=0).

Update of

References

    1. Dang CV, O’Donnell KA, Zeller KI, Nguyen T, Osthus RC, Li F. The c-Myc target gene network. Semin Cancer Biol. 2006. Aug;16(4):253–64. Epub 2006/08/15. doi:10.1016/j.semcancer.2006.07.014. - DOI - PubMed
    1. Meyer N, Penn LZ. Reflecting on 25 years with MYC. Nat Rev Cancer. 2008. Dec;8(12):976–90. Epub 2008/11/26. doi:10.1038/nrc2231. - DOI - PubMed
    1. Dang CV. c-Myc target genes involved in cell growth, apoptosis, and metabolism. Mol Cell Biol. 1999. Jan;19(1):1–11. Epub 1998/12/22. doi:10.1128/MCB.19.1.1. - DOI - PMC - PubMed
    1. Posternak V, Cole MD. Strategically targeting MYC in cancer. F1000Res. 2016;5. Epub 2016/04/16. doi:10.12688/f1000research.7879.1. - DOI - PMC - PubMed
    1. Dhanasekaran R, Deutzmann A, Mahauad-Fernandez WD, Hansen AS, Gouw AM, Felsher DW. The MYC oncogene - the grand orchestrator of cancer growth and immune evasion. Nat Rev Clin Oncol. 2022. Jan;19(1):23–36. Epub 2021/09/12. doi:10.1038/s41571-021-00549-2. - DOI - PMC - PubMed

MeSH terms

Substances