. 2024 Jun 25;43(6):114326.
doi: 10.1016/j.celrep.2024.114326. Epub 2024 Jun 8.

Hofbauer cells and fetal brain microglia share transcriptional profiles and responses to maternal diet-induced obesity

Affiliations

Hofbauer cells and fetal brain microglia share transcriptional profiles and responses to maternal diet-induced obesity

Rebecca Batorsky et al. Cell Rep. .

Abstract

Maternal immune activation is associated with adverse offspring neurodevelopmental outcomes, many mediated by in utero microglial programming. As microglia remain inaccessible throughout development, identification of noninvasive biomarkers reflecting fetal brain microglial programming could permit screening and intervention. We used lineage tracing to demonstrate the shared ontogeny between fetal brain macrophages (microglia) and fetal placental macrophages (Hofbauer cells) in a mouse model of maternal diet-induced obesity, and single-cell RNA-seq to demonstrate shared transcriptional programs. Comparison with human datasets demonstrated conservation of placental resident macrophage signatures between mice and humans. Single-cell RNA-seq identified common alterations in fetal microglial and Hofbauer cell gene expression induced by maternal obesity, as well as sex differences in these alterations. We propose that Hofbauer cells, which are easily accessible at birth, provide insights into fetal brain microglial programs and may facilitate the early identification of offspring vulnerable to neurodevelopmental disorders.

Keywords: CP: Immunology; CP: Metabolism; Hofbauer cells; fetal programming; microglia; mouse; neuroimmune; obesity; sex differences; single-cell RNA sequencing.


Conflict of interest statement

Declaration of interests A.G.E. serves as a consultant for Mirvie, Inc. outside of this work. A.G.E. receives research funding from Merck Pharmaceuticals outside of this work. R.H.P. is a founder and member of the scientific advisory board of Psy Therapeutics; a member of scientific advisory boards for Swan AI Studio, Belle Artificial Intelligence, Genomind, and Circular Genomics; and consults to Alkermes, Burrage Capital, and Vault Health. He serves as an associate editor for JAMA Network Open. All of these roles are outside the present work.

Figures

Figure 1.
Figure 1.. Placental macrophages are yolk sac derived
(A) Schematic of fetal yolk sac macrophage labeling. Male Csf1R-CreER;tdTomatof/f mice were timed-mated to female tdTomatof/f mice. Pregnant females were injected with 4-hydroxytamoxifen (4-OHT) at gestational day 8.5. Embryos were collected at embryonic day 17.5. (B) Percent of macrophages (Iba1+ cells) labeled with tdTomato in embryonic placenta and hippocampus following 4-OHT administration at e8.5. Open circles represent individual female embryos and closed diamonds represent individual male embryos (n = 4 litters). Pl = placenta; Br = brain (hippocampus). (C–C′) Representative images of Iba1 and tdTomato in control (C) and reporter (C′) placenta from e17.5 embryos. (D–D′) Representative images of Iba1 and tdTomato in control (D) and reporter (D′) hippocampus from e17.5 embryos. Arrowheads indicate double-positive (Iba1+ tdTomato+) macrophages/microglia in reporter tissue. Scale bar, 50 μm, inset scale 10 μm.
Figure 2.
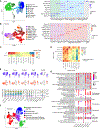
Figure 2.. Fetal placental and brain macrophages are heterogeneous populations with shared cluster-specific signatures
(A) (Left) Uniform Manifold Approximation and Projection (UMAP) visualization of CD11b+ macrophage-enriched fetal brain microglia/monocyte cells reveals eight distinct clusters. Unless otherwise specified, clusters are named as ‘‘cell-type-prefix_top-marker-gene’’. Mg, microglia; Mono_FBr, fetal brain monocytes; YSI, yolk sac imprint. (Right) Cluster-average expression of the top three marker genes for each cluster (right), dot size indicates the percent of cells expressing the given gene, color intensity represents the scaled average gene expression. (B) (Left) UMAP visualization of CD11b+ macrophage-enriched placenta macrophage/monocyte populations reveals four fetal and six maternal clusters. Fetal clusters were determined by significantly higher expression of Y chromosome markers Eif2s3y and Ddx3y relative to expression of X chromosome marker Xist (Figures S2D and S2E). Unless otherwise specified, clusters are named as ‘‘cell type prefix_top marker gene’’. HBC, Hofbauer cell; PAMM, placenta-associated maternal monocyte/macrophages; Mono_FPl, fetal placental monocytes. Color scheme indicates cell origin (purple = fetal macrophages; red = maternal; gray = fetal monocytes). (Right) Cluster-averaged gene expression of the top three marker genes for each cluster. Dot size indicates the percent of cells expressing the given gene. (C) Module score for yolk sac-derived macrophages and embryonic liver monocytes., (D) Spearman correlation coefficients of cluster-averaged gene expression between brain and placenta clusters in (A) and (B). For each brain cluster, the placenta cluster with highest correlation is indicated with a dot. (E) Expression levels of canonical microglia (top, blue) and Hofbauer cell marker genes (bottom, orange). (F) UMAP visualization including both brain and placenta clusters shown in (A) and (B) shows similarity across brain-placenta compartments. (G) Gene Ontology (GO) biological process enrichment analysis for select microglia and HBC cluster marker genes. The terms displayed were curated from among the top 25 most significant GO terms, selecting the processes most relevant to macrophage function, and reducing redundancy. Gene count gives the number of genes in the query set that are annotated by the relevant GO category. GO terms with adjusted p value <0.05 were considered significant. Full results in Table S1.
Figure 3.
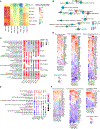
Figure 3.. Comparison of maternal and fetal placental macrophages
(A) Cluster-average expression of top marker genes distinguishing PAMM from HBC. Dot size indicates percent of cells expressing the given gene. (B) Gene Ontology (GO) biological process enrichment analysis for for HBC and PAMM marker genes. Gene count gives the number of genes in the query set that are annotated by the relevant GO category. GO terms with an adjusted p value <0.05 were considered significant. (C) Cluster-average expression of genes that distinguish PAMM and HBC populations in human studies. (D) Detailed expression of genes Folr2 and Mrc1 that distinguish PAMM and HBC populations. (E) Markers with validated antibodies that best separate HBC, placental monocyte, and PAMM populations.
Figure 4.
Figure 4.. Maternal obesity alters gene expression in fetal microglia and placental macrophages
(A) Fraction of significant differentially expressed genes (DEGs) in obesity-exposed fetal microglia that are also significantly differentially expressed in obesity-exposed placental Hofbauer cells. DEGs between offspring of obese and control dams are shown. DEGs considered significant if adjusted p value <0.05, abs(log2FC) > 0.25. (B) Network plot of the top 15 GO biological processes enriched in the DEGs in fetal MgYSI_Pf4, shown in both MgYSI_Pf4 and placental HBC_Cd72. Nodes correspond to enriched GO categories, node size is proportional to number of genes, and edge thickness is proportional to the number of overlapping genes. (C) Enriched GO biological processes in the DEGs of obesity-exposed microglia and Hofbauer cells. Select results are shown, full results are in Table S2. Shading corresponds to manual grouping of GO categories. Gene count gives the number of genes in the query set annotated by the relevant GO category. (D) Up- and downregulation of DEGs implicated in ATP metabolism, response to oxidative stress, and regulation of inflammatory response in microglia and Hofbauer cells. DEG fold changes in obesity-exposed microglia and HBCs for three significantly enriched GO biological processes relevant to microglial function. *Indicates DEG with adjusted p value <0.05. (E) Select IPA canonical pathways enriched in obesity-exposed microglial and Hofbauer cell DEGs. Positive Z score means pathway is activated in fetal macrophages of obese dams, negative Z score means pathway is suppressed. (F) Up- and downregulation of genes in fetal macrophages of obese dams for two significantly activated or inhibited IPA canonical pathways relevant to microglial function. DEG fold changes depicted. *DEGs with adjusted p value <0.05.
Figure 5.
Figure 5.. Sex differences in the response of microglia and placental macrophages to maternal diet-induced obesity
Differentially expressed genes (DEGs) between microglia and placental macrophages in fetuses of obese and control dams are shown, calculated separately for male and female offspring. (A) The number of DEGs between obesity-exposed vs. control macrophages/monocytes is shown as a bar, colored by cell type, and shaded according to sex. *Indicates p < 0.05 difference between male and female. (B) (Left) Table considers the total number of DEGs in yolk-sac imprint microglia (MgYSI) and HBC cell types that are DEGs in male and/or female cells. Genes are categorized as having a fold change in the same direction (sex-consistent) or different direction (sex-dimorphic) in males and females. (Right) GO biological process enrichment results for the set of sex-dimorphic and sex-consistent DEGs. (C) Comparison of the top 12 IPA canonical pathways that are enriched in both Mg and HBC. The summed Z score from the female analysis and male analysis is shown, with positive Z score indicating activation and negative Z score indicating inhibition. (Full results are shown in Table S3.) (D) Fold changes in fetal macrophages in offspring of obese versus control dams for the IPA canonical pathway neuroinflammatory response pathway for males and females. *DEGs with adjusted p value <0.05.

Update of

Similar articles

Cited by

References

    1. Sierra A, Encinas JM, Deudero JJP, Chancey JH, Enikolopov G, Overstreet-Wadiche LS, Tsirka SE, and Maletic-Savatic M (2010). Microglia shape adult hippocampal neurogenesis through apoptosis-coupled phagocytosis. Cell Stem Cell 7, 483–495. 10.1016/j.stem.2010.08.014. - DOI - PMC - PubMed
    1. Paolicelli RC, Bolasco G, Pagani F, Maggi L, Scianni M, Panzanelli P, Giustetto M, Ferreira TA, Guiducci E, Dumas L, et al. (2011). Synaptic pruning by microglia is necessary for normal brain development. Science 333, 1456–1458. 10.1126/science.1202529. - DOI - PubMed
    1. Schafer DP, Lehrman EK, Kautzman AG, Koyama R, Mardinly AR, Yamasaki R, Ransohoff RM, Greenberg ME, Barres BA, and Stevens B (2012). Microglia sculpt postnatal neural circuits in an activity and complement-dependent manner. Neuron 74, 691–705. 10.1016/j.neuron.2012.03.026. - DOI - PMC - PubMed
    1. Bilimoria PM, and Stevens B (2015). Microglia function during brain development: New insights from animal models. Brain Res. 1617, 7–17. 10.1016/j.brainres.2014.11.032. - DOI - PubMed
    1. Nakai Y, Itoh M, Mizuguchi M, Ozawa H, Okazaki E, Kobayashi Y, Takahashi M, Ohtani K, Ogawa A, Narita M, et al. (2003). Apoptosis and microglial activation in influenza encephalopathy. Acta Neuropathol. 105, 233–239. 10.1007/s00401-002-0605-x. - DOI - PubMed

LinkOut - more resources