. 2024 Jun 25;43(6):114311.
doi: 10.1016/j.celrep.2024.114311. Epub 2024 Jun 5.

Role of the afferent lymph as an immunological conduit to analyze tissue antigenic and inflammatory load

Affiliations

Role of the afferent lymph as an immunological conduit to analyze tissue antigenic and inflammatory load

Padma P Nanaware et al. Cell Rep. .

Abstract

The lymphatic fluid is the conduit by which part of the tissue "omics" is transported to the draining lymph node for immunosurveillance. Following cannulation of the pre-nodal cervical and mesenteric afferent lymphatics, herein we investigate the lymph proteomic composition, uncovering that its composition varies according to the tissue of origin. Tissue specificity is also reflected in the dendritic cell-major histocompatibility complex class II-eluted immunopeptidome harvested from the cervical and mesenteric nodes. Following inflammatory disruption of the gut barrier, the lymph antigenic and inflammatory loads are analyzed in both mice and subjects with inflammatory bowel diseases. Gastrointestinal tissue damage reflects the lymph inflammatory and damage-associated molecular pattern signatures, microbiome-derived by-products, and immunomodulatory molecules, including metabolites of the gut-brain axis, mapped in the afferent mesenteric lymph. Our data point to the relevance of the lymphatic fluid to probe the tissue-specific antigenic and inflammatory load transported to the draining lymph node for immunosurveillance.

Keywords: CP: Immunology; Crohn's disease; MHC immunopeptidome; MHC molecules; antigen presentation; antigen processing; immunosurveillance; inflammation; lymph; lymphatics.


Conflict of interest statement

Declaration of interests The authors declare that they do not have any conflict of interest.

Figures

Figure 1.
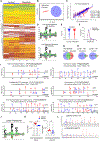
Figure 1.. Differential proteomic profile between mesenteric and cervical lymph
(A) Pre-nodal mesenteric lymphatic vessel draining to the mesenteric node and inset of the same pre-nodal lymphatic vessel following peri-lymphatic fat removal. (B) Pipette tip (2–4 μm) showing the collected lymph fluid from the pre-nodal lymphatic vessel. (C) Pre-nodal cervical afferent lymphatic vessel draining to the deep cervical node. (D) Detail of the cannulation of a pre-nodal lymphatic vessel. (E) Separation of the mesenteric and cervical lymph proteome (3 μg of protein) on a silver-stained 4%–20% gradient acrylamide SDS-PAGE. (F) Deep Venn area proportional diagram displaying the degree of overlap and differential expression profiling of proteins identified in the mesenteric and cervical lymph using a combination of LFQ proteomics platforms (see STAR Methods protocol). (G) Volcano plot depicting the significant differential expression (n = 4, p < 0.05 by t test) of 2,752 proteins. Highlighted in blue and red are the 681 proteins showing at least 2-fold downregulation and 799 proteins showing at least 2-fold upregulation in the cervical vs. mesenteric lymph proteomes. (H) Principal component analysis (PCA), generated by MetaboAnalyst, based on the DIA intensities of the proteins identified in n = 4 biological replicates of afferent mesenteric and cervical lymph. (I–K) LFQ comparative analysis of selected proteins displaying significant differences in their relative abundance (extracted from DIA intensities) as determined in (G). Blue and orange dots depict the mesenteric and cervical lymph proteins respectively. Statistical significance was determined using the Holm-Sidak method, with alpha = 0.05: *p < 0.05; **p < 0.01; ***p < 0.001; ****p < 0.0001. (L) Euclidian Ward’s dual heatmap of the top 2,000 proteins identified in all four biological replicates of mouse pre-nodal mesenteric and cervical lymph. The map highlights the significant difference in the proteomic signature of the two biological fluids harvested from the distinct anatomical regions. Only proteins that passed a selected significance statistical threshold (ANOVA/t test applied in PEAKS XPro, p < 0.05) are displayed in the heatmap. (M and N) The subsequently generated METASCAPE analysis of protein networks and GO annotations defining the different molecular functions and metabolic pathways of proteins from mesenteric (M) vs. cervical (N) lymph. All proteins and details of LFQ analysis and GO annotations related to the mesenteric and cervical proteomic analysis are presented in Table S1.
Figure 2.
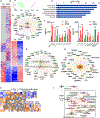
Figure 2.. Differential I-Ab elution profile from dendritic cells harvested from the mesenteric or deep cervical nodes
(A) Representative clustered heatmap contrasting the top 600 I-Ab eluted peptides from nodal dendritic cells (DCs), harvested from cervical and mesenteric lymph nodes. Peptides exhibit a significant differential expression (n = 3, p < 0.05 by t test). The colors indicate the peptides’ average relative abundance calculated from the log2 (DIA MS exclusive intensities) indexed in TableS4: red = increase (log2 DIA MS intensities ≥0); blue = decrease (log2 DIA MS intensities ≤0). The map was generated in MetaboAnalyst using the Pearson distance and Ward clustering method, after filtering, normalization, and autoscaling of Log2 (MS DIA intensities) for all peptides identified with FDR <5% using both PEAKS and Scaffold DIA proteome software. (B) Principal component analysis (PCA), generated by MetaboAnalyst, using the DIA MS intensities of the I-Ab cervical and mesenteric eluted peptidomes (n = 3) shown in the clustered map in (A). (C) Person correlation plot among the cervical and mesenteric replicates indicates differences between the I-Ab immunopeptidomes eluted from cervical or mesenteric DCs. (D) The MHCMotifDecon 1.1 algorithm for motif deconvolution of multi-allele immunopetidomics data was used for motif analysis of the I-Ab eluted peptides. Peptides within a 9–35 amino acid length and percent rank of ≤30% were selected for the motif analysis. 505 I-Ab-eluted peptides from the cervical nodes and 456 I-Ab-eluted peptides from the mesenteric nodes passed the criteria for I-Ab binders. (E) Predicted rank of the I-Ab bound peptidome did not show statistical difference between the cervical and mesenteric node ligandome. The significance was calculated using Mann-Whitney test. (F) Length distribution for the filtered I-Ab binders. The median length distribution is 15 aa for both cervical and mesenteric lymph nodes. (G) Deep Venn area proportional diagram displaying the degree of overlap between the cervical and mesenteric I-Ab-eluted peptidome. (H) Deep Venn area proportional diagram displaying the percentage of protein source overlap between the cervical or mesenteric lymph proteome within the I-Ab-eluted peptidome from cervical and mesenteric lymph nodes. (I) Fragmentation profiles of some of the identified mouse peptides matched against a generated mouse I-Ab DDA and DIA spectral library or against the FASTA mouse SwissProt database. The predicted affinity and the percent rank, predicted using NetMHCIIpan 4.1 algorithm, are indicated. The predicted binding core is underlined. (J) The MHCMotifDecon 1.1 algorithm for motif deconvolution of multi-allele immunopetidomics data was used for motif analysis of the mesenteric and cervical peptidomes shown in Table S4N. Peptides within a 9–35 amino acid length and percent rank of ≤30% were selected for the motif analysis. The motif prediction showed that about 7,157 endogenous processed peptides identified in the cervical and mesenteric lymph by DIA timsTOF-PASEF method could be potential I-Ab MHC-II binders (Table S4N). (K) Example of peptide epitopes derived from albumin (ALBU) and apolipoprotein E (Apo-E) found in both the mesenteric lymph and the I-Ab immunopeptidome eluted from the mesenteric nodes and identified by de novo sequencing algorithm built into PEAKS. (L) MS/MS spectra of the peptides in (K).
Figure 3.
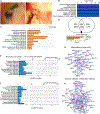
Figure 3.. Differential proteomic profiles between afferent mesenteric lymph harvested from control and mice with DSS-induced colitis
(A) Heatmap of representative biological quadruplicates (n = 4) of mouse mesenteric lymph contrasting all fold changes between the 726 nodal proteins identified in the afferent lymph (FDR < 3%) from the Ctr and DSS colitis mice and quantified by label-free (LFQ) proteomic analysis of first level of mass spectrometry (MS1) area (Table S2). Only proteins that passed a selected statistical significance threshold are displayed in the heatmap. The hierarchical clustering was generated using a neighbor-joining algorithm and Euclidean distance similarity measurement of the log2 ratios of the abundance of each sample relative to the average abundance, built into PEAKS X + Q module (ANOVA/t test applied in PEAKS XPro, p < 0.05). In the heatmap, the positive values reflect fold increases (red color), and negative values reflect fold decreases (blue color). The clustering is shown in Table S2H. (B) Principal component analysis (PCA) generated by Scaffold Quant LFQ, based on exclusive spectra counts of four biological replicates of afferent lymph from control mice and mice with DSS colitis, highlighting distinct proteomics signatures. (C) IPA-enabled enrichment analysis of afferent mesenteric lymph from mice with DSS colitis depicting the increased number of proteins overrepresenting the inflammation pathways, GI tract injuries, redox stress, and immunological responses to metabolic, hepatic, and nutritional distress induced by the gut inflammation. (D and E) IPA-predicted colitis- and enteritis-associated pathways in the afferent mesenteric lymph from DSS vs. Ctr mice. In all IPA predictions, the quantitative analysis of the log2 fold change, corresponding to the proteomic changes in the ratio (efferent DSS/efferent Ctr) are displayed as colored-coded networks. IPA-calculated activation Z score, in orange, predicts z > 2.0 pathway activation; red and green color molecules, in each pathway, are experimentally determined to be up- and downregulated, respectively. (F) Enzyme linked immunosorbent assay (ELISA) quantitation of IFN-g and pro-inflammatory cytokines in the afferent lymph from DSS vs. control mice (two-way ANOVA and multiple t test comparison analysis. Statistical significance was determined using the Holm-Sidak method, with alpha = 0.05: *p < 0.05; **p < 0.01; ***p < 0.001; ****p < 0.0001). (G) IPA analysis indicates increased damage-associated molecular patterns (DAMPs) in the afferent mesenteric lymph from DSS vs. control mice. (H) IPA-generated heatmap using the (afferent DSS/afferent Ctr) protein ratios (Table S1) and colored by Z score (orange = activation and Z score >2.0; blue = inactivation and Z score ≤2.0). (I) IPA analysis indicates increased presence of proteolytic enzymes such as trypsin, chymotrypsin, carboxypeptidases, elastases, and cathepsin B (CTSB) in the proteome of the afferent lymph harvested from DSS vs. control mice. The quantitative analysis of the log2 fold change corresponding to the proteomic changes in the ratio (afferent DSS/afferent Ctr) is displayed as networks colored coded by the IPA-calculated activation Z score (orange predicts Z >2.0 activation/increase). The GO annotation and pathway analysis is presented in Table S2.
Figure 4.
Figure 4.. Metabolic changes in the afferent lymph harvested from mice with DSS-induced colitis
(A–D) The relative abundance of (A) amino acids, (B) short, medium, and long chain fatty acids, (C) metabolic by-products of amino acid catabolism, and (D) bile acids, as mapped in control and DSS mesenteric afferent lymph. The median values of MS1 intensities from n = 5 control and n = 6 DSS replicates are shown. (E) Partial least squares discriminant analysis (PLS-DA) in METABOANALYST 5.0 of identified metabolites, listed in Table S3, shows different clusters for the mesenteric control and DSS afferent lymph. (F) Untargeted metabolomic analysis identifies differentially expressed metabolites in control versus DSS afferent mouse mesenteric lymph (red: >1.5× upregulated, blue: <1.5× downregulated). Identified metabolites include molecules derived from bacterial metabolism of dietary substrates, modification of host biomolecules, such as bile acids (i.e., taurine), or de novo synthesized molecules by the gut microbiome. Metabolites IDs, quantitation, and associated metabolic pathways are presented in Table S3. The statistical significance was calculated in MetaboAnalyst 5.0 using the built-in t test/ANOVA and displayed as (*) (for p ≤ 0.05).
Figure 5.
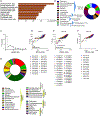
Figure 5.. Increased microbiome-derived proteins in the afferent mesenteric lymph harvested from mice with DSS-induced colitis
(A) Pie chart representing the frequency of microbiota phyla identified from 262 proteins mapped to the afferent mesenteric lymph harvested from DSS mice from n = 5 control and n = 6 DSS replicates is shown. The identified phyla are all known components of the mouse gut microbiota. The proteomics analysis was performed using a fused database containing FASTA sequences of proteins translated from the bacterial 16S rRNA sequenced genomes identified in the mouse gut microbiota and the UniProt Mus musculus FASTA database (17,155 entries, March 2024). (B) MS1-based LFQ analysis showing a significant increase in the relative abundance of gut bacteria-derived proteins in the lymph harvested from DSS mice compared to control (p < 0.01 by unpaired t test). (C) Bar graph representing the LFQ quantitation of the iron-regulated protein A (from Synechococcus elongatus, Cyanobacteriota phylum) displaying a significant increase in the afferent lymph collected from DSS vs. control mice (p < 0.01 by unpaired t test). (D) GO annotations and functional analysis of the bacterial proteins found in the afferent mesenteric lymph of DSS mice using Pantherdb databases. (E) MS1 LFQ analysis showing specific increase in the number and relative abundance of proteins derived from Klebsiella pneumoniae in the afferent mesenteric lymph harvested from DSS mice vs. Ctr (Table S4O).
Figure 6.
Figure 6.. Inflammatory signatures in human mesenteric lymph harvested from subjects with IBD
(A) Cannulations of pre-nodal mesenteric afferent lymphatic vessels from a human specimen obtained from surgery of IBD subjects following ileocolic resection procedure (n = 5). (B) IPA analysis of the top-scoring biochemical and pathophysiological pathways, derived from the 799 protein IDs identified in pre-nodal mesenteric human lymph with a statistically significant identification score (p < 0.05 by Fisher’s exact test with Benjamini-Hochberg correction). IPA identified significant cellular and molecular functions associated with inflammation, cell death, immunological response, and metabolic changes overrepresented in the IBD subjects. (C) IPA analysis depicting the activation networks found in the IBD proteome. (D) Venn diagram contrasting the qualitative differences between 799 proteins identified in the IBD lymph (this study) and 733 proteins retrieved from the studies of human mesenteric lymph from patients undergoing abdominal surgery following traumatic injuries. GO annotation and pathway analysis of the two-proteomics dataset confirms that both proteomes are generated from intestine, liver, and adipose tissue. (E) IPA pathway enrichment analysis of the unique proteome characterizing the lymph harvested from an individual with traumatic abdominal injuries. (F) IPA pathway enrichment analysis of the unique proteome characterizing the IBD lymph. (G and H) Top protein networks describing the immunologically driven inflammatory response in the mesenteric lymph of IBD subjects (Table S5F).
Figure 7.
Figure 7.. Gut inflammation in IBD subjects increases the microbiome-derived degradome in the afferent pre-nodal lymph
(A) METSCAPE cellular and molecular pathway enrichment analysis highlights the intestine and pancreatic tissues as the primary anatomical regions of the lymph peptidome/degradome mapped in the IBD subjects. (B) The heterogeneity of microbial proteins from acid elutions of human IBD mesenteric afferent lymph (n = 1). (C) Length distribution of the acid-eluted peptides of the human samples showing higher fraction of smaller length peptides with a mean distribution of 8 aa. (D–F) The NetMHCpan 4.1 predictions for frequently observed HLA alleles (D) HLA-A, (E) HLA-B, and (F) HLA-C for the acid-eluted microbial peptides present in the IBD lymph. The binders below rank percentile of 2 are indicated. (G) Spatial distribution of the microbes identified in trypsin-digested proteome across different human IBD lymph samples (n = 6).

References

    1. Mehrara BJ, Radtke AJ, Randolph GJ, Wachter BT, Greenwel P, Rovira II, Galis ZS, and Muratoglu SC (2023). The emerging importance of lymphatics in health and disease: an NIH workshop report. J. Clin. Invest. 133, e171582. 10.1172/JCI171582. - DOI - PMC - PubMed
    1. Tomasulo CE, Dori Y, and Smith CL (2023). Understanding the next circulation: lymphatics and what the future holds. Curr. Opin. Cardiol. 38, 369–374. 10.1097/HCO.0000000000001064. - DOI - PubMed
    1. Choe K, Jang JY, Park I, Kim Y, Ahn S, Park DY, Hong YK, Alitalo K, Koh GY, and Kim P (2015). Intravital imaging of intestinal lacteals unveils lipid drainage through contractility. J. Clin. Invest. 125, 4042–4052. 10.1172/JCI76509. - DOI - PMC - PubMed
    1. Azzali G (2003). Structure, lymphatic vascularization and lymphocyte migration in mucosa-associated lymphoid tissue. Immunol. Rev. 195, 178–189. 10.1034/j.1600-065x.2003.00072.x. - DOI - PubMed
    1. Rockson SG (2006). A roadmap for the lymphatics. Lymphatic Res. Biol. 4, 179–180. 10.1089/lrb.2006.4401. - DOI - PubMed

Publication types

MeSH terms