. 2024 Jun 25;43(6):114309.
doi: 10.1016/j.celrep.2024.114309. Epub 2024 Jun 5.

Lineage specification in glioblastoma is regulated by METTL7B

Affiliations

Lineage specification in glioblastoma is regulated by METTL7B

Myrianni Constantinou et al. Cell Rep. .

Abstract

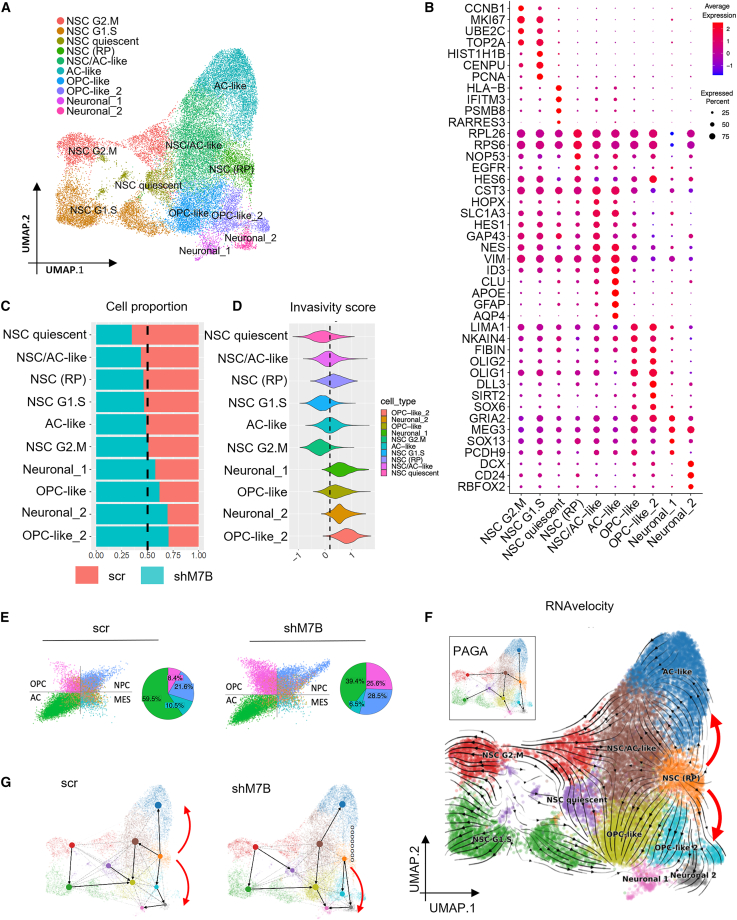
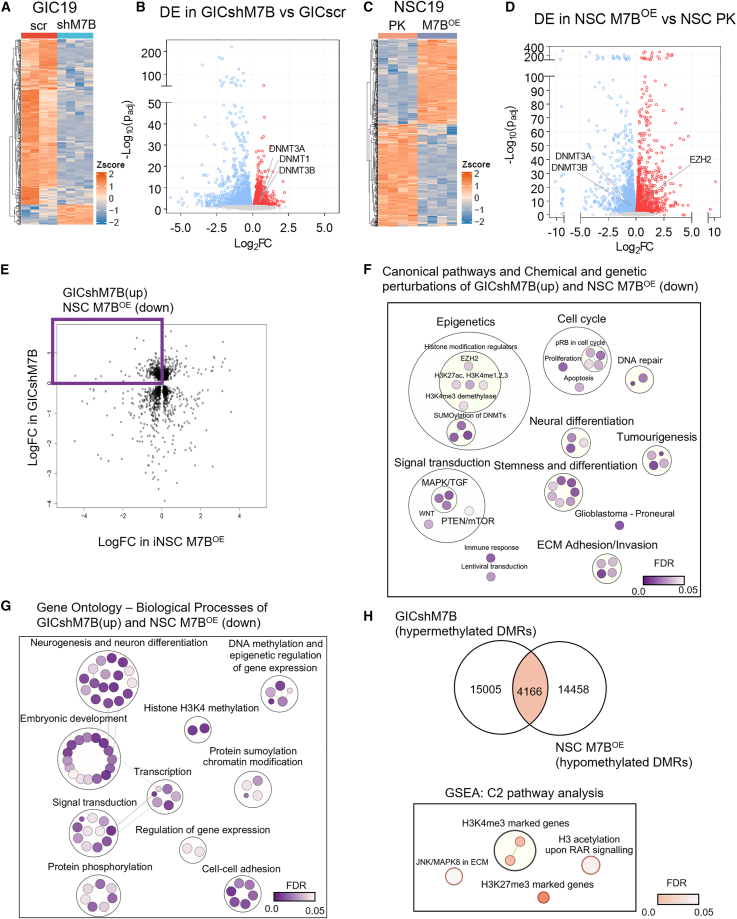
Glioblastomas are the most common malignant brain tumors in adults; they are highly aggressive and heterogeneous and show a high degree of plasticity. Here, we show that methyltransferase-like 7B (METTL7B) is an essential regulator of lineage specification in glioblastoma, with an impact on both tumor size and invasiveness. Single-cell transcriptomic analysis of these tumors and of cerebral organoids derived from expanded potential stem cells overexpressing METTL7B reveal a regulatory role for the gene in the neural stem cell-to-astrocyte differentiation trajectory. Mechanistically, METTL7B downregulates the expression of key neuronal differentiation players, including SALL2, via post-translational modifications of histone marks.

Keywords: CP: Cancer; CP: Stem cell research; METTL7B; SALL2; cancer stem cells; cerebral organoids; epigenetics; glioblastoma; in vivo models; lineage specification; neural stem cells; single-cell transcriptomic.


Conflict of interest statement

Declaration of interests The authors declare no competing interests.

Figures

None
Graphical abstract
Figure 1
Figure 1
METTL7B is expressed in GICs and contributes to glioblastoma growth in a xenograft model (A) PCA biplot visualization of gene expression data. x axis: glioblastoma and iNSCs. y axis: individual patients. Genes on the right are upregulated and those on the left are downregulated in all GICs as compared to iNSCs. 10 SYNGN GIC/iNSC pairs, n = 2 (independent passages) per cell line. (B) METTL7B expression in 156 bulk glioblastoma samples as compared to healthy tissue. All graphs report mean ± SEM. Two-tailed unpaired t test, ∗∗∗p < 0.001. (C) scRNA-seq data from Neftel et al. plotted in a 2D cell state plot. Quadrants: AC-like (bottom left), MES-like (bottom right), OPC-like (top left), and NPC-like (top right). METTL7B log transcripts per million (TPM) expression ranging from light orange to dark. (D) Kaplan-Meier survival curves of mice xenografted with GIC19scr (black) and GIC19shM7B (green) (n = 9 animals per group), two-tailed p values determined by log-rank (Mantel-Cox) test. (E) Top: H&E representative pictures of intracerebral xenografts derived from GIC19 scr and shM7B. Microvascular proliferations are shown in the inset. Scale bar: 100 μm. Bottom: immunostainings (immunohistochemistry [IHC]) with METTL7B antibody in xenografts derived from GIC19scr and GICshM7B. Scale bar: 50 μm. (F) IHC for human vimentin (hVIM) in brains of mice xenografted with GIC19scr and GICshM7B at endpoint and quantification of tumor area shown as percentage (%) of vimentin-positive cells in the overall area. Scale bar: 5 mm. All graphs report mean ± SEM. Welch’s t test, p = 0.03. Light green: scr, n = 9 animals; dark green: shM7B, n = 7 animals. (G) Invasiveness index of endpoint xenografts. Welch’s t test, p = 0.02. Light green: scr, n = 9 animals; dark green: shM7B, n = 7 animals. (H) IHC for hVIM in time-matched GIC19scr and GICshM7B xenografted mouse brains. Light green: scr, n = 3 animals; dark green: shM7B, n = 3 animals. Scale bar: 5 mm. All graphs report mean ± SEM. Welch’s t test, p = 0.03. (I) Invasiveness index of time-matched xenografts. Light green: scr, n = 3 animals; dark green: shM7B, n = 3 animals. Welch’s t test, p = 0.03. See also Figures S1 and S2.
Figure 2
Figure 2
METTL7B silencing polarizes lineage specification away from the astrocytic fate toward neuronal/oligodendrocytic phenotypes (A) Uniform manifold approximation and projection (UMAP) plot of xenograft samples (GICshM7B [n = 3], GICscr [n = 2]) with cells colored by annotated cell type. (B) Dot plot of cluster marker gene expression used for cell-type annotation. x axis: cell clusters; y axis: marker genes. Average gene expression ranges from low (blue) to high (red), and dot size is proportional to the percentage of cells expressing the genes. (C) Cell-type proportions from GICscr vs. GICshM7B samples. Orange, GICscr; blue, GICshM7B. Dashed line marks 50%. (D) Patient-derived GIC cell state (OPC-like, AC-like, NPC-like, MES-like) distribution in the scr and shM7B samples (quadrant plot as defined in Neftel et al.16). Pie charts depict the percentages of the four cellular states in each group. (E) Violin plot showing cell-type enrichment of glioma invasiveness gene set. (F) RNA velocity streamlines projected onto UMAP embeddings shows a split vector field from NSCs (RP) toward either AC-like cells or neuronal/OPC-like cell types. (G) UMAPs overlaid with PAGA graph abstractions calculated on scr samples (left) or GICshM7B samples. Weighted edges correspond to the connectivity between two clusters, and directionality is RNAvelocity inferred. See also Figures S3 and S4.
Figure 3
Figure 3
METTL7B regulates lineage specification in COs toward an oRG/Astrocytic phenotype (A) UMAP plot of CO samples (CO19PK, CO19M7BOE, CO61CAS9PK, CO61M7BOE) with cells colored by annotated cell type. (B) Dot plot of cluster marker gene expression used for cell type annotation. x axis: cell clusters; y axis: marker genes. Average gene expression ranges from low (blue) to high (red), and dot size is proportional to the percentage of cells expressing the genes. (C) Cell proportions in control COs vs. COM7BOE. Orange, CO; blue, COM7BOE. Dashed line marks 50%. (D) Volcano plot of DEGs in COM7BOE as compared to control in the NSC cluster. x axis: average log2 fold change (avg_log2FC); y axis: −log(p_val). Upregulated genes in COM7BOE: avg_log2FC > 0. Downregulated genes in COM7BOE: avg_log2FC < 0. (E) GSEA for GOBPs of DEGs in the NSC cluster, visualized on Cytoscape. Bubbles are colored based on false discovery rate (FDR) values, and size is proportional to the number of genes included in each GO term. See also Figures S5 and S6.
Figure 4
Figure 4
METTL7B is an epigenetic regulator of DNA methylation and histone modification marks (A) Heatmap of normalized gene expression of DEGs in GIC19shM7B (light blue column annotation bar) as compared to GIC19scr (red column annotation bar). 479 DEGs are shown (log2FC |1| and padj ≤ 0.05). Color range from orange to blue indicates high to low gene expression. (B) Volcano plot of all DEGs in GIC19shM7B as compared to GIC19scr. x axis, log2FC; y axis, −log10(padj). Red dots: upregulated genes (log2FC > 0) in GIC19shM7B as compared to scr with padj ≤ 0.05. Blue dots: downregulated genes (log2FC < 0) in GIC19shM7B as compared to scr with padj ≤ 0.05. Gray: non-significant. (C) Heatmap of normalized gene expression of DEGs in iNSC19M7BOE (light blue column annotation bar) as compared to control PK (orange column annotation bar). 643 DEGs are shown (log2FC |1| and padj ≤ 0.05). Color range from orange to blue indicates high to low gene expression. (D) Volcano plot of all DEGs in iNSC19M7BOE as compared to iNSC19PK. x axis, log2FC; y axis, −log10(padj). Red dots: upregulated genes (log2FC > 0) in GIC19shM7B as compared to scr with padj ≤ 0.05. Blue dots: downregulated genes (log2FC < 0) in GIC19shM7B as compared to scr with padj ≤ 0.05. Gray: non-significant. (E) Correlation scatterplot indicates genes of inverse log2FCs in the two contrasts. All genes shown in the plot are with padj ≤ 0.05. The intersect is highlighted in purple: GICshM7B(up) (upregulated DEGs in GIC19shM7B vs. GIC19scr) and NSC M7BOE (down) (downregulated DEGs in iNSC19M7BOE vs. iNSC19PK). (F) Deregulated C2 pathways in GICshM7B(up) and NSCM7BOE (down) identified by enrichment analysis using a hypergeometric test. padj < 0.05, DEGs are upregulated (log2FC > 0) in the GIC comparison (GIC19shM7B vs. GIC19scr) and downregulated (log2FC < 0) in the iNSC comparison (iNSCM7BOE vs. iNSCPK). Bubbles are colored based on FDR values, and size is proportional to the number of genes included in each C2 term. (G) Deregulated biological processes in GICshM7B(up) and iNSCM7BOE (down). Bubbles are colored based on FDR values, and size is proportional to the number of genes included in each GO term. (H) Venn diagram (left) of overlapping DMRs in the intersect; hypermethylated DMRs in GICshM7B vs. GICscr and hypomethylated DMRs in iNSCM7BOE vs. NSCPK. For hypermethylated regions: maximum differences (maxdiff) between CpG probes > 0 and mean differences (meandiff) between CpG probes > 0, Fisher ≤ 0.05. For hypomethylated regions: maxdiff < 0 and meandiff < 0, Fisher ≤ 0.05. Right: Cytoscape visualization of GSEA; C2 pathway analysis of DMRs in the intersect GIChyper/iNSChypo. Bubbles are colored based on FDR values, and size is proportional to the number of genes included in each C2 term. See also Figures S7 and S8.
Figure 5
Figure 5
METTL7B epigenetically regulates genes involved in neuronal differentiation in GICs (A) Western blot (left) and quantification (right) of tri-methylation of H3K27/total H3 histone (H3K27me3) in scr (light green) and upon METTL7B silencing (dark green) in GICs or in control (PK, light purple) and in METTL7B-overexpressing (M7BOE, dark purple) iNSCs. GAPDH immunoreactivity was used to normalize protein loading. N = 3 independent experiments, unpaired two-tailed t test. All graphs report mean ± SEM of 6 blots. ∗∗p = 0.0022 and p = 0.0480. (B) Representative images of H3K27me3 IHC staining in GICscr- and GICshM7B-derived intracerebral xenografts. Scale bar: 50 μm. (C) Heatmaps of H3K27me3 ChIP-seq peak enrichments in scr (blue) and shM7B (orange) GICs. Heatmaps are centered at transcription start site (TSS) covering ±10 Kb and ordered by H3K27me3 intensity. Signals were clustered based on the distribution of H3K27me3 surrounding the promoters and divided by genomic loci acquiring (GAIN) or losing (LOSS) the H3K27me3 mark upon METTL7B silencing. (D) Venn diagram showing the integration of DEGs from RNA-seq data and genes presenting differential H3K27me3 peaks from ChIP-seq data (top). Volcano plot representing FCs of expression for DEGs (RNA-seq [log2FC]) and FC of H3K27me3 peak enrichment (ChIP-seq [FC]) upon METTL7B silencing in GICs (bottom). Highlighted genes with concordant gain/loss of H3K27me3 peaks and down-/upregulation. (E) Bubble plot showing GO biological processes significantly enriched for the 63 concordant genes in GICs upon METTL7B silencing (highlighted in D, bottom) identified in ChIP-seq and RNA-seq integration. Bubbles are colored based on FDR values, and size is proportional to the number of genes included in each GO term. (F) Venn diagram showing the overlap between genes upregulated and with loss of H3K27me3 in GICs upon METTL7B silencing. (G) Genome browser view showing H3K27me3 ChIP-seq and RNA-seq peaks around SALL2, SEMA5B, WNT3A, and AKNA promoters in GIC scr (light green) and upon METTL7B silencing (shM7B, dark green). (H) ChIP qPCR for the SALL2 promoter region where the H3K27me3 peak was identified through ChIP-seq (chromosome 14 [chr14]: 22,004,347–22,005,057). Two amplicons covering the region were analyzed in GIC19 (scr, dark green and shM7B, light green) and GIC61 (scr, dark blue and shM7B, light blue). N = 3 independent experiments. Graphs show FC of scr and shM7B normalized to the 1% of chromatin input for each sample. All graphs report mean ± SEM. Two-tailed paired t test. p < 0.05, ∗∗p < 0.01, and ∗∗∗p < 0.001. See also Figure S9.
Figure 6
Figure 6
Silencing of METTL7B in GICs drives cells toward a neuronal phenotype via METTL7B epigenetically regulated genes (A) Expression intensity of concordant ChIP-/RNA-seq targets (SALL2, WNT3, SEMA5B, and AKNA) in our PDX scRNA-seq dataset. (B) Representative images and quantification of immunostainings with SALL2 in xenografts derived from GIC19 intracerebrally injected with scr and shM7B. Immunostaining with anti-TurboRFP (GIC, in red) and SALL2 (green); nuclei counterstained with DAPI. Scale bar: 10 μm. N = 2 mice for each group, and n = 3 fields captured at 40×, where all cells were TurboRFP+. Graph reports double-positive cells for DAPI/SALL2 with mean ± SEM. Two-tailed unpaired t test. p < 0.05. (C) Representative images and quantification of in vitro differentiation assay of GIC19scr and GIC19shM7B for 10 days. Immunostainings with GFAP (green) and TUJ1 (red). Nuclei were counterstained with DAPI. Scale bar: 10 μm. Graphs on the left show the quantification as a percentage (%) of GFAP (top graph) or TUJ1 (bottom graph), middle graphs show the quantification of GFAP processes (top) and TUJ1 neurites (bottom) as counts, and right graphs show the total length in μm of GFAP processes (top) and TUJ1 neurites (bottom). All results are based on N = 2 independent infections for each group, from scr: n = 14 and shM7B: n = 18. All graphs report mean ± SEM. Two-tailed unpaired t test. p < 0.05, ∗∗p < 0.01, ∗∗∗p < 0.001, and ∗∗∗∗p < 0.0001. (D) Representative images for SOX2, GFAP, SYN, and hVIM IHC staining in scr and shM7B GIC19-derived intracerebral xenografts. Scale bar: 100 μm. See also Figures S9 and S10.

References

    1. Valor L.M., Hervás-Corpión I. The Epigenetics of Glioma Stem Cells: A Brief Overview. Front. Oncol. 2020;10:602378. doi: 10.3389/fonc.2020.602378. - DOI - PMC - PubMed
    1. Safa A.R., Saadatzadeh M.R., Cohen-Gadol A.A., Pollok K.E., Bijangi-Vishehsaraei K. Glioblastoma stem cells (GSCs) epigenetic plasticity and interconversion between differentiated non-GSCs and GSCs. Genes Dis. 2015;2:152–163. doi: 10.1016/j.gendis.2015.02.001. - DOI - PMC - PubMed
    1. Uribe D., Niechi I., Rackov G., Erices J.I., San Martín R., Quezada C. Adapt to Persist: Glioblastoma Microenvironment and Epigenetic Regulation on Cell Plasticity. Biology. 2022;11:313. - PMC - PubMed
    1. Raviram R., Raman A., Preissl S., Ning J., Wu S., Koga T., Zhang K., Brennan C.W., Zhu C., Luebeck J., et al. Integrated analysis of single-cell chromatin state and transcriptome identified common vulnerability despite glioblastoma heterogeneity. Proc. Natl. Acad. Sci. USA. 2023;120 doi: 10.1073/pnas.2210991120. - DOI - PMC - PubMed
    1. Tooley J.G., Catlin J.P., Tooley C.E.S. METTLing in Stem Cell and Cancer Biology. Stem Cell Rev. Rep. 2023;19:76–91. doi: 10.1007/s12015-022-10444-7. - DOI - PMC - PubMed

Publication types

MeSH terms

Substances