. 2024 Jun 7;9(96):eadn3954.
doi: 10.1126/sciimmunol.adn3954. Epub 2024 Jun 7.

Human γδ T cells in diverse tissues exhibit site-specific maturation dynamics across the life span

Affiliations

Human γδ T cells in diverse tissues exhibit site-specific maturation dynamics across the life span

Joshua I Gray et al. Sci Immunol. .

Abstract

During ontogeny, γδ T cells emerge from the thymus and directly seed peripheral tissues for in situ immunity. However, their functional role in humans has largely been defined from blood. Here, we analyzed the phenotype, transcriptome, function, and repertoire of human γδ T cells in blood and mucosal and lymphoid tissues from 176 donors across the life span, revealing distinct profiles in children compared with adults. In early life, clonally diverse Vδ1 subsets predominate across blood and tissues, comprising naïve and differentiated effector and tissue repair functions, whereas cytolytic Vδ2 subsets populate blood, spleen, and lungs. With age, Vδ1 and Vδ2 subsets exhibit clonal expansions and elevated cytolytic signatures, which are disseminated across sites. In adults, Vδ2 cells predominate in blood, whereas Vδ1 cells are enriched across tissues and express residency profiles. Thus, antigenic exposures over childhood drive the functional evolution and tissue compartmentalization of γδ T cells, leading to age-dependent roles in immunity.


Figures

Fig. 1.
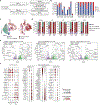
Fig. 1.. Enrichment of γδ T cells in pediatric compared to adult tissues.
(A) Schematic of donors, tissue sites, and experimental methods of analysis (top left). Scatter plots indicate the age range of samples from 117 children (left) and 59 adults (right). Pie charts show distribution of sex and ethnicity. (B) Frequency of γδ T cells in pediatric and adult blood and indicated tissues in representative flow plots (pediatric: 5 years old; adult: 60 years old) and summary box plot (lower). (C) γδ T cell frequency within indicated sites over childhood (0–12 years) shown in a scatter plot with a separate column for proportions in adults. The midline of each box plot represents the median. Boxes represent the interquartile range and whiskers represent the minimum and maximum values. *P<0.05, **P<0.01, ***P<0.001, ****P<0.0001. Statistical significance was determined by one-way ANOVA with Tukey’s correction for multiple comparisons. For scatterplots of infant γδ T cell proportions, r and P-values were calculated using a nonparametric Spearman’s correlation test. Linear regression analyses show the line of best fit and 95% confidence interval bands. Each dot represents an individual donor (children: n=31–48; adults: n=8–15). Abbreviations: BLD, blood; SPL, spleen, LNG, lung; LLN, lung-associated lymph node; JEJ, jejunum; MLN, mesenteric lymph node.
Fig. 2.
Fig. 2.. Distinct composition and phenotypes for Vδ1 and Vδ2 γδ T cells over sites and age.
(A) Proportion of Vδ1 or Vδ2 subsets in blood and tissues of children (left) or adults (right) shown in representative flow plots (pediatric: 5 years old; adult: 60 years old) and box plots depicting the compiled frequency from multiple donors. (B) Frequency of Vδ1 or Vδ2 subsets over childhood (0–12 years) compared to adults (Ad) for each site. (C) Frequency of naïve (CD27+CD45RA+) Vδ1 or Vδ2 cells in children and adults for each site shown in box plots. (D) Expression of tissue-resident markers CD69, CXCR6, CD103, and CD49a by Vδ1 or Vδ2 subsets in children across tissues as percentage of each subset. The midline of each box plot represents the median. Boxes represent the interquartile range and whiskers represent the minimum and maximum values. *P<0.05, **P<0.01, ***P<0.001, ****P<0.0001; one-way ANOVA with Tukey’s correction for multiple comparisons. For scatterplots, r and P-values were calculated using a nonparametric Spearman’s correlation test. Linear regression analyses show the line of best fit and 95% confidence interval bands. Each dot represents an individual donor (children: n=31–48; adults: n=8–15). Abbreviations: BLD, blood; SPL, spleen, LNG, lung; LLN, lung-associated lymph node; JEJ, jejunum; MLN, mesenteric lymph node.
Fig. 3.
Fig. 3.. Heterogeneous transcriptome profiles of pediatric and adult tissue γδ T cells.
scRNA-seq profiling was performed on sorted γδ T cells from pediatric (aged 1–2 years) spleen (SPL), lung (LNG), lung-associated LN (LLN), mesenteric LN (MLN), and jejunum (JEJ). For pediatric human thymus (THY) and adult tissues, scRNA-seq data were extracted from published datasets. (A) UMAP of pediatric γδ T cells (13,882 cells) colored by tissue and cluster (B) Differentially expressed genes (DEGs) per cluster shown in a dot plot. (C) Cluster proportion by tissues shown in a stacked bar plot. (E) UMAP showing classification of Vδ1, Vδ2, and other (non-Vδ1 and non-Vδ2) and stacked bar plot of the proportion of Vδ1, Vδ2, or other cells within each cluster. (E) Dot plot of TRDV and TRGV gene pairings within each organ, split by classification of Vδ1 or Vδ2. (F to J) Concordant analysis as in (A to E) for adult γδ T cells (7417 cells) in equivalent tissues. For all dot plots, gene expression values are scaled to a log2-fold change. Dots are colored by average logFC expression and sized by the percentage of cells expressing the gene. Gene lists are filtered based on a minimum logFC of >1, adjusted P<0.01. Statistical significance was calculated using a two-sided Wilcoxon with tie correction.
Fig. 4.
Fig. 4.. Age- and site-specific transcriptional signatures for human tissue γδ subsets.
(A) Adult and pediatric γδ T cells were integrated using MMoCHi gene-based classification according to the hierarchy providing four functional modules: thymic naïve, tissue-adapted, cytolytic/effector, or repair. (B) Box plot indicating the number (left) and proportion (right) of γδ T cells classified as Vδ1, Vδ2, or other by tissue site and age. (C) UMAP visualization of the classifications in children (left) and adults (right). (D) Stacked bar plots of the proportional composition of the functional modules in (A) by tissue, Vδ chain, and age. (E) Volcano plots comparing cytolytic/effector Vδ1 cells between children (blue) and adults (green) for the spleen (left), lung (center), and jejunum (right). P<0.01, log2FC>1. (F) Common and tissue-specific DEGs across the three tissues shown in the dot plots. For all dot plots, gene expression values are scaled to a log2-fold change. Dots are colored by average logFC expression and sized by the percentage of cells expressing the gene. Gene lists were filtered based on a minimum logFC of >1, adjusted P<0.01. Statistical significance was calculated using a two-sided Wilcoxon with tie correction.
Fig. 5.
Fig. 5.. Pediatric γδ T cells exhibit elevated tissue repair and reduced effector function compared to adult cells across sites.
T cells from blood and indicated tissues were stimulated for 4 hours with PMA–ionomycin and the functional profile of γδ T cell subsets determined by flow cytometry. Representative flow plots (spleen, 4-year-old) and box plots of (A) GzmB, (B) IFN-γ, and (C) amphiregulin (AREG) expression for Vδ1 and Vδ2 cells in children and adults. (D) Spider plots indicating the proportion of cells capable of producing the indicated combination of GzmB, IFN-γ, or TNF-α for each tissue, separated by Vδ subset and age. *P<0.05, **P<0.01, ***P<0.001, ****P<0.0001; one-way ANOVA with multiple comparisons. The midline of each box plot represents the median. Boxes represent the interquartile range and whiskers represent the minimum and maximum values. Each dot represents an individual donor (children: n=16–47; adults: n=5–11).
Fig. 6.
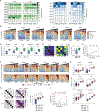
Fig. 6.. γδ T cells in children are clonally diverse and exhibit increased expansion and dissemination with age.
(A) Heatmaps of V-gene usage for the γ-chain or δ-chain across tissues in children and adults. (B) Clonal proportion graphs showing the proportion of the repertoire occupied by the top 1, 2–10, 11–100, 101–1000, and 1001+ clones for the TRDV chain. (C) Box plots indicating the Simpson clonality of each donor by tissue stratified by age for the TRDV chain. (D) Heatmaps of the mean Jaccard overlap for children and adults and the average per donor shown as a box plot. Average overlap per donor shown as a scatterplot over age. (F) Clonal proportion graphs showing the proportion of the TRDV1 or TRDV2 repertoire occupied by the same clonal indices as in (A). (G) Box plots indicating the Simpson clonality of clones possessing a TRDV1 or TRDV2 chain for children or adults for each organ. (H) Heatmaps of the mean Jaccard overlap of TRDV1 or TRDV2 clones for children and adults and the mean overlap per donor quantified in a box plot. (I) Mean Jaccard overlap per subset shown as a scatterplot over age. The midline of each box plot represents the median. Boxes represent the interquartile range and whiskers represent the minimum and maximum values. Statistical significance was calculated using the Kruskal–Wallis test with Dunn’s correction for multiple comparisons. *P<0.05, **P<0.01. For scatterplots, r and P-values were calculated using a nonparametric Spearman’s correlation test. Linear regression analyses show the line of best fit. Each dot represents an individual donor (children: n=7–12; adults: n=4–5). Abbreviations: BL, blood; SP, spleen, LG, lung; LN, lung-associated lymph node; JE, jejunum; MN, mesenteric lymph node.

Similar articles

Cited by

References

    1. Guy-Grand D, Vassalli P, Eberl G, Pereira P, Burlen-Defranoux O, Lemaitre F, Di Santo JP, Freitas AA, Cumano A, Bandeira A, Origin, trafficking, and intraepithelial fate of gut-tropic T cells. J Exp Med 210, 1839–1854 (2013). - PMC - PubMed
    1. Itohara S, Farr AG, Lafaille JJ, Bonneville M, Takagaki Y, Haas W, Tonegawa S, Homing of a gamma delta thymocyte subset with homogeneous T-cell receptors to mucosal epithelia. Nature 343, 754–757 (1990). - PubMed
    1. Jiang X, Campbell JJ, Kupper TS, Embryonic trafficking of gammadelta T cells to skin is dependent on E/P selectin ligands and CCR4. Proc Natl Acad Sci U S A 107, 7443–7448 (2010). - PMC - PubMed
    1. Jin Y, Xia M, Saylor CM, Narayan K, Kang J, Wiest DL, Wang Y, Xiong N, Cutting edge: Intrinsic programming of thymic gammadeltaT cells for specific peripheral tissue localization. J Immunol 185, 7156–7160 (2010). - PMC - PubMed
    1. Qu G, Wang S, Zhou Z, Jiang D, Liao A, Luo J, Comparing Mouse and Human Tissue-Resident gammadelta T Cells. Front Immunol 13, 891687 (2022). - PMC - PubMed

Publication types

Substances