. 2024 Jun 7;10(23):eadj0385.
doi: 10.1126/sciadv.adj0385. Epub 2024 Jun 7.

A dynamic in vitro model of Down syndrome neurogenesis with trisomy 21 gene dosage correction

Affiliations

A dynamic in vitro model of Down syndrome neurogenesis with trisomy 21 gene dosage correction

Prakhar Bansal et al. Sci Adv. .

Abstract

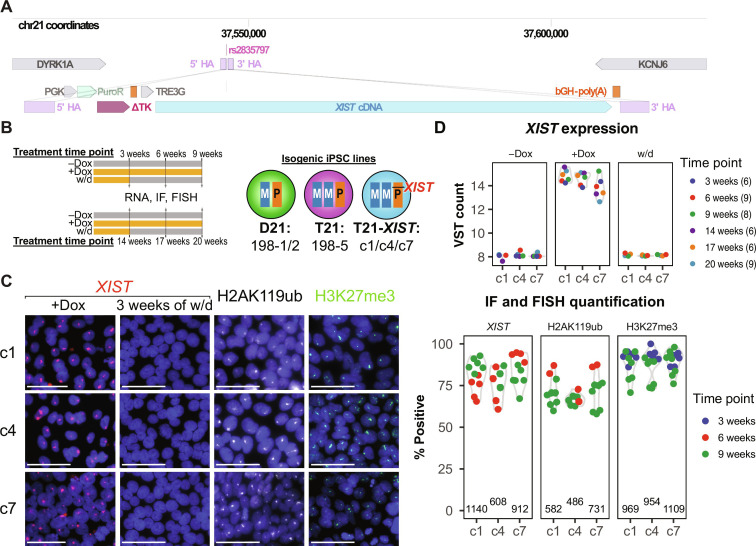
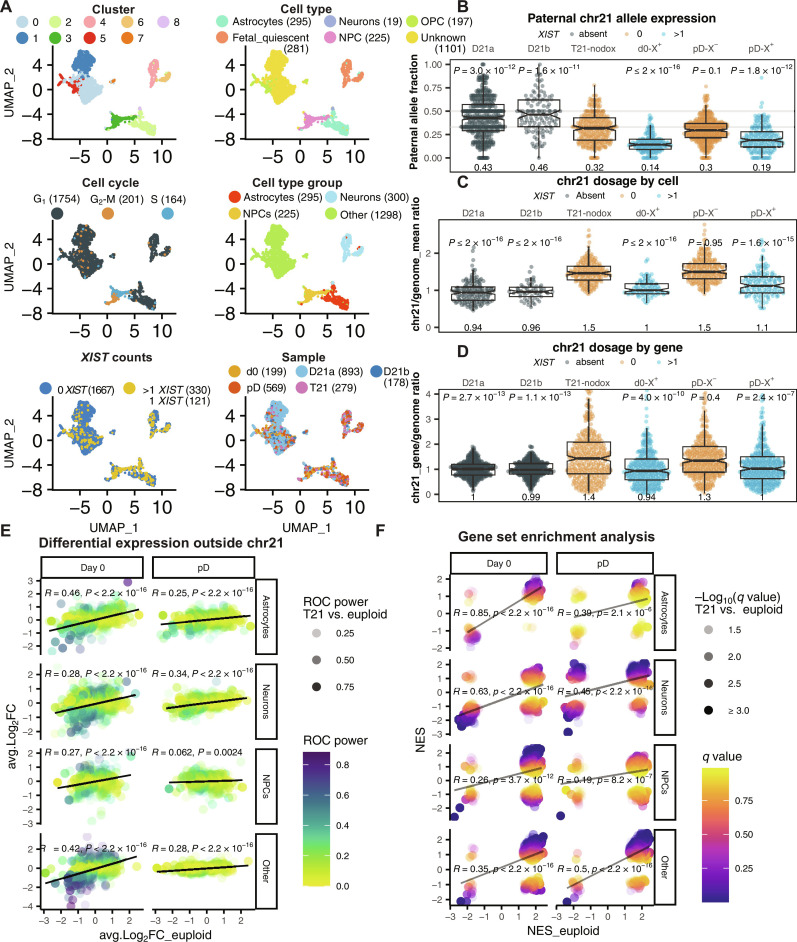
Excess gene dosage from chromosome 21 (chr21) causes Down syndrome (DS), spanning developmental and acute phenotypes in terminal cell types. Which phenotypes remain amenable to intervention after development is unknown. To address this question in a model of DS neurogenesis, we derived trisomy 21 (T21) human induced pluripotent stem cells (iPSCs) alongside, otherwise, isogenic euploid controls from mosaic DS fibroblasts and equipped one chr21 copy with an inducible XIST transgene. Monoallelic chr21 silencing by XIST is near-complete and irreversible in iPSCs. Differential expression reveals that T21 neural lineages and iPSCs share suppressed translation and mitochondrial pathways and activate cellular stress responses. When XIST is induced before the neural progenitor stage, T21 dosage correction suppresses a pronounced skew toward astrogenesis in neural differentiation. Because our transgene remains inducible in postmitotic T21 neurons and astrocytes, we demonstrate that XIST efficiently represses genes even after terminal differentiation, which will empower exploration of cell type-specific T21 phenotypes that remain responsive to chr21 dosage.


Figures

Fig. 1.
Fig. 1.. T21 iPSCs induce XIST transgene and deposit heterochromatin on one chr21 allele.
(A) A Tet-On 3G (TRE3G)–driven XIST cDNA is delivered to chr21 by homologous recombination using 5′ and 3′ homology arms (HAs) flanking rs2835797 (pink), which abrogates the protospacer motif of the Cas9 guide RNA on two of three alleles. Additional components include PGK-driven puromycin and thymidine kinase selection markers. Bovine growth hormone (BGH) polyadenylation [bGH-poly(A)] signals terminate the XIST cDNA and PuroR-TK genes. (B) Schematic of iPSC sample collection time points and dox treatment conditions, alongside cell line names. Samples were collected after 3 to 9 weeks of +dox or no-dox treatment, or 3 weeks of +dox and 3 or 6 weeks of w/d. Another set of samples were collected at longer time points of 14 to 20 weeks of +dox or no-dox treatment or 14 weeks of +dox and 3 or 6 weeks of w/d. (C) Representative images (left; scale bars, 50 μm) for XIST-FISH, H2AK119ub and H3K27me3 IF, and image quantification (right). Control panel of XIST-negative cells after 3 weeks of w/d for XIST-FISH included on the left. On right, each dot represents an individual image from a total of two time points (color) per clone and target. Total number of cells quantified for each clone and target annotated at bottom of panel. (D) XIST expression in T21-XIST samples from mRNA-seq (VST counts, approaching a log transformation). Total number of samples at each time point are noted in parentheses in “time point” color legend.
Fig. 2.
Fig. 2.. XIST-mediated silencing extends across entire chr21P and attracts DNAme.
(A) Represented M/M2 and P alleles of protein-coding chr21 genes (N = 60) ordered along chr21 across dox conditions and genotypes (sample n: D21 = 16, T21 = 8, T21-XIST −dox = 14, +dox = 18, 3 weeks of w/d = 6, 6 weeks of w/d = 6). Thick black line at 0.5 marks expected biallelic expression in euploid (D21) cells, and dashed thin black line expected one-third representation for chr21P allele in T21 cells. Asterisks denote genes with unresolved allelic origin. (B) Heatmap of VST differential of all samples (n = 68, cell line and batch denoted below) relative to the mean VST of T21 samples (left) for all expressed protein coding, long noncoding RNA (lncRNA), and pseudo-genes on chr21 (N = 208), ordered by VST count of T21 cells (violet annotation; left). (C) Distributions of log2FC of T21-XIST +dox (n = 30) and w/d (n = 12) samples relative to T21 samples (n = 22), for all genes with ≥1000 base mean expression (N = 84). “Combined” (T21-XIST +dox and w/d, n = 30) represents the differential expression condition used in subsequent figures as “T21-XIST/T21.” Blue- and green-shaded bands indicate ±10 and ±15% variations from a log2FC of −0.59 (dashed vertical line; expected log2FC of complete T21 dosage correction). (D) Log2FC values across chr21 genes (N = 131 to 160; arranged by position) comparing D21, T21-XIST +dox, and T21-XIST w/d samples to T21 samples. Bubble colors are indicated in the legend above, and bubble size reflects base mean. (E) As in (B), displaying only genes that maintain an LAF ≥ 1/6 in allelic T21 mRNA-seq under +dox or w/d conditions. (F) Distribution of DNAme values from promoter-associated methylEPIC probes on chr21 genes in T21-XIST no-dox, +dox, and w/d. Bimodal distribution medians of probes > and ≤60% methylated displayed on their respective peaks.
Fig. 3.
Fig. 3.. Transcriptome-wide response to T21 gene dosage and correction via XIST.
(A) Fraction of genes differentially expressed in response to T21 (n = 22) relative to D21 (n = 16) (top) and T21-XIST dosage correction (n = 30) relative to T21 (bottom), by direction (increasing, decreasing, or unchanged, ~0) and by chromosome. (B) Principal components analysis (PCA) of all mRNA-seq samples (n = 68) using all genes (N = 18,929), batch-corrected for time point and dox status. Open symbols denote original euploid (198-1/2) and T21 (198-5) lines, and filled symbols denote T21-XIST transgenic lines (c1/c4/c7). Colors indicate effective chr21 dosage as indicated in Figs. 1 and 2 (w/d colored separately to distinguish from +dox T21-XIST samples). (C) Overlap of differential expression between iPSC T21/D21 (y axis, n = 22/n = 16) over the dox effect (left; comparing only nontransgenic +dox, n = 9, and no-dox, n = 15) and T21-XIST dosage correction (n = 30) relative to T21 (n = 22). Adjusted P values combined by Fisher’s method (c.Padj) for all DEGs and colored by–log10(c.Padj) provided c.Padj ≤ 0.1. Linear regression plotted with the Spearman correlation coefficient and P value for genes with c.Padj ≤ 0.1 (left, N = 8417; right, N = 9396). (D) Overlap of enriched GSEA terms comparing NES for iPSC T21/D21 (n = 22/n = 16) over dosage-corrected T21-XIST/T21 (n = 30/n = 22). Adjusted P values combined by Fisher’s method (c.Padj) for all GSEA terms and shown as bubble size by −log10(c.Padj). Colors denote terms within selected categories (c.Padj ≤ 0.2). (E) Individual significantly enriched terms (c.Padj ≤ 0.1) from each of the categories in (D), selected by concordance measure [Euclidean distance from origin in (D)]. Colors denote NES, and size denotes individual −log10(P.adj).
Fig. 4.
Fig. 4.. Concordant T21 dosage imbalance and transcriptomic response after neural differentiation.
(A) Heatmap of VST differential for each sample (n = 17) relative to the mean VST of all T21 neural samples (left) for all expressed protein-coding, long noncoding RNA, and pseudo-genes on chr21 (N = 213). Schematic (right) details dox conditions, neural differentiation end point, and cell lines. (B) Distribution of log2FC relative of +dox (n = 3) and w/d (n = 2) to neural T21 samples (n = 4), for all genes with ≥1000 base mean expression (N = 86). Combined (n = 5) represents the differential expression condition used in subsequent figures as T21-XIST/T21. Blue- and green-shaded bands correspond to ±10 and ± 15% variation from a log2FC of −0.59 (dashed vertical line; log2FC expected for complete T21 dosage correction). (C) Overlap of differential expression between neural T21/D21 (y axis; n = 4/n = 8) and T21-XIST (y axis; +dox and w/d, n = 5) relative to T21 (n = 4). Adjusted P values combined by Fisher’s method (c.Padj) for all DEGs and colored by −log10(c.Padj) provided c.Padj ≤ 0.1. Linear regression plotted with the Spearman correlation coefficient and P value for genes with c.Padj ≤ 0.1 (N = 586). (D) Overlap of enriched GSEA terms comparing NESs for neural T21/D21 (y axis) to NES for dosage-corrected T21-XIST/T21 (x axis). Adjusted P values combined by Fisher’s method (c.Padj) for all GSEA terms and shown as bubble size by −log10(c.Padj). Colors denote terms within selected categories with c.Padj ≤ 0.2. (E) Individual significantly enriched terms (c.Padj ≤ 0.1) from each of the categories in (D), selected by concordance measure [Euclidean distance from origin in (D)]. Colors denote NES, and size denotes the individual −log10(P.adj).
Fig. 5.
Fig. 5.. Increased cell death of T21 relative to euploid interneurons and excitatory forebrain neurons.
(A) Representative sequence of a T21 interneuron labeled with RGEDI-P2a-EGFP dying over the course of imaging and a control neuron surviving during the course of imaging (scale bar is 10 μm). The colors of the cells in red and green directly correspond to the “red indicator RGEDI” and “EGFP” morphology, respectively, as these images were captured using red fluorescent protein and green fluorescent protein channels. The two labeled channels are in separate panels and also presented as overlays (yellow), while maintaining the color scheme in the manuscript to ensure clarity and coherence. (B) Plot of the cumulative rate of death of T21 (707 cells) and euploid control interneurons (1092 cells). Step functions correspond to the mean cumulative death rate across all wells per line, and the faint lines represent cumulative death rate of each replicate well [n = 6 wells each, hazard ratio (HR) = 4.08, linear mixed model with Holm correction, **P < 0.01]. (C) As in (B) for the cumulative rate of death of TS21 (1953 cells) and euploid control (1151 cells) excitatory forebrain neurons (n = 6 wells each, HR = 2.57, linear mixed model with Holm correction, **P < 0.01).
Fig. 6.
Fig. 6.. Early astrogenesis at neurogenic expense is suppressed by T21 dosage correction before NPC stage.
(A) Schematic details dox conditions, differentiation timeline, and cell lines used in assessing the impact of T21 dosage correction on reversing neural cell lineage bias. Quantification (left; data points indicate images and numbers of the total of scored cells across three replicate rounds of differentiation) and representative images (right; scale bars, 100 μm) of H2AK119ub (IF) and XIST (FISH) signal after neural differentiation. Cells were dox-treated as iPSCs (top left) or d0 (bottom left). (B) Relative lineage commitment to neurons (MAP2; top left) or astrocytes (S100B; bottom left) in euploid, T21, and T21-XIST upon terminal plating of d28 cells. Symbols (two-tailed Wilcoxon P value level, *P ≤ 0.1, **P ≤ 0.01, ***P ≤ 0.001, or “ns” for P > 0.1) above each box plot denote significance of median difference from the corresponding euploid (198-1/2) condition, whereas symbols below each box plot compare to T21 (198-5) lineage proportions. Fraction of all committed cells (top right) shows the sum of neurons and astrocytes. Total number of cells counted in each image (bottom right). Replicate rounds of differentiation indicated for each cell line and dox condition (x axis). Data points represent individual images. (C) Representative images 3 weeks after terminal plating of d28 cells (scale bars, 100 μm; 198-1: scale bar, 50 μm) in euploid (left), T21 (center), and dosage-corrected T21-XIST (right; with dox addition time point) detecting nuclei (blue; Hoechst), neuronal MAP2 (magenta), astroglial S100B (green), and H2AK119ub accumulating on chr21 (white). Insets (labeled 1 to 3) display H2AK119ub foci in astrocytes and neurons.
Fig. 7.
Fig. 7.. Postmitotic neurons and astrocytes induce XIST and deposit H2AK119ub after lineage commitment.
(A) Sample and timeline schematic of T21-XIST induction during (d0 +dox) and after terminal neural differentiation via DAPT treatment (d28 to d32), with LD pre-DAPT dox treatment (LD +dox) or without (pD +dox). Cell cycle exit of NPCs is assessed by EdU labeling of S phase–transiting cells, with codetection of XIST by FISH after 2 days +dox. Chr21 Barr body formation (H2AK119Ub) and lineage commitment (MAP2/S100B) are assessed by IF in 8 and 10 to 12 weeks of cultures, and snRNA-seq (single nucleus RNA-seq). (B) Quantification of EdU-labeling efficiency (left), EdU/XIST codetection (middle), and representative XIST (magenta) and EdU (green) image (right; scale bar, 50 μm) at d36 of neural differentiation following DAPT (4 days) and dox treatment (2 days). Number of total nuclei counted noted above box plots in EdU-labeling efficiency. For EdU/XIST codetection, clones (color) and differentiation rounds (shape) are noted, and each data point represents an image. The composition of all cells counted (n = 2816) across both clones and rounds of differentiation is XIST+EdU+ = 1.8%, XIST+ = 40%, EdU+ = 5.1%, and XISTEdU = 53%. (C and D) Representative images (C) (scale bars, 100 μm) and quantification (D) of H2AK119ub (white) IF and XIST-FISH (red) signals after neural differentiation from different dox treatments. Number of cells counted noted above box plots in (D). IF panels in (C) show H2AK119ub (white) costained with MAP2 (magenta) and S100B (green).
Fig. 8.
Fig. 8.. Effective monoallelic repression of chr21 genes by XIST induced in terminal neurons and astrocytes.
(A) Single-nucleus RNA-seq Uniform Manifold Approximation and Projection (UMAP) of terminal 10 to 12 weeks of neural cultures (integrating n = 2118 cells on N = 3000 genes) colored by original clusters, granular and grouped cell types, cell cycle stage, XIST counts, and samples (n cells per category in parentheses). (B) Paternal allele fraction by cell, aggregated over all chr21 genes. Cells split by sample (D21a/b, T21-XIST-nodox, d0 +dox, and pD +dox) and XIST status (0, >1 counts denoted “X“ and “X+”), except for euploid lines (transgene absent; gray). Median paternal allele fraction and significance of median differences relative to T21-nodox cells (Wilcoxon P value) denoted below and above box plot, respectively. (C) Normalized expression ratio (over genome mean excluding chr21) by cell, aggregated over all chr21 genes. Cells split as in (B) (excluding other cells), with median expression ratio and difference in medians relative to T21-nodox cells (Wilcoxon P value) denoted above and below box plot, respectively. (D) Normalized expression ratio by chr21 gene relative to their mean euploid expression aggregated over cells. Mean ratios per gene calculated from cells split and annotated as in (C). (E) Differential expression of non-chr21 genes relative to pD-X and T21-nodox cells. Sample-averaged log2FC values in euploid cells (x axis) correlate with XIST-positive d0 and pD log2FC values (y axis) by cell type group. Colors denote ROC (receiver operating characteristic curve) power and transparency ROC power comparing euploid to T21 cells. Regression line (black), Pearson coefficient, and P value (Fisher-transformed) are shown as indicated. (F) GSEA results of expression comparisons in (E), correlating NESs, and plotted as in (E). MSigDB gene sets limited to Hallmark and canonical pathways significant (q ≤ 0.1) in T21/euploid comparison (x axis). Log10-transformed q values denoted by color (d0 and pD to T21) and transparency (euploid to T21). Regression line (gray), Pearson coefficient, and P value (Fisher-transformed) are shown as indicated.

Similar articles

Cited by

References

    1. Capone G. T., Chicoine B., Bulova P., Stephens M., Hart S., Crissman B., Videlefsky A., Myers K., Roizen N., Esbensen A., Peterson M., Santoro S., Woodward J., Martin B., Smith D., Co-occurring medical conditions in adults with Down syndrome: A systematic review toward the development of health care guidelines. Am. J. Med. Genet. A 176, 116–133 (2018). - PubMed
    1. Antonarakis S. E., Skotko B. G., Rafii M. S., Strydom A., Pape S. E., Bianchi D. W., Sherman S. L., Reeves R. H., Down syndrome. Nat. Rev. Dis. Prim. 6, 9 (2020). - PMC - PubMed
    1. Kazuki Y., Gao F. J., Li Y., Moyer A. J., Devenney B., Hiramatsu K., Miyagawa-Tomita S., Abe S., Kazuki K., Kajitani N., Uno N., Takehara S., Takiguchi M., Yamakawa M., Hasegawa A., Shimizu R., Matsukura S., Noda N., Ogonuki N., Inoue K., Matoba S., Ogura A., Florea L. D., Savonenko A., Xiao M., Wu D., Batista D. A. S., Yang J., Qiu Z., Singh N., Richtsmeier J. T., Takeuchi T., Oshimura M., Reeves R. H., A non-mosaic transchromosomic mouse model of down syndrome carrying the long arm of human chromosome 21. eLife 9, e56223 (2020). - PMC - PubMed
    1. Kazuki Y., Gao F. J., Yamakawa M., Hirabayashi M., Kazuki K., Kajitani N., Miyagawa-Tomita S., Abe S., Sanbo M., Hara H., Kuniishi H., Ichisaka S., Hata Y., Koshima M., Takayama H., Takehara S., Nakayama Y., Hiratsuka M., Iida Y., Matsukura S., Noda N., Li Y., Moyer A. J., Cheng B., Singh N., Richtsmeier J. T., Oshimura M., Reeves R. H., A transchromosomic rat model with human chromosome 21 shows robust Down syndrome features. Am. J. Hum. Genet. 109, 328–344 (2022). - PMC - PubMed
    1. Herault Y., Delabar J. M., Fisher E. M. C., Tybulewicz V. L. J., Yu E., Brault V., Rodent models in Down syndrome research: Impact and future opportunities. Dis. Model. Mech. 10, 1165–1186 (2017). - PMC - PubMed

MeSH terms