. 2024 Jun 7;10(23):eadk0306.
doi: 10.1126/sciadv.adk0306. Epub 2024 Jun 7.

B1-B2 transition in shock-compressed MgO

Affiliations

B1-B2 transition in shock-compressed MgO

June K Wicks et al. Sci Adv. .

Abstract

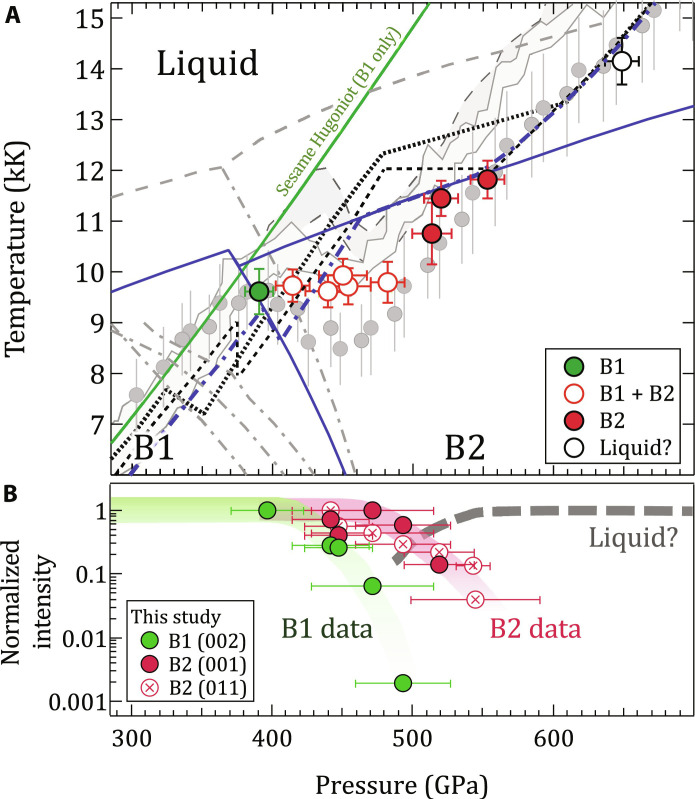
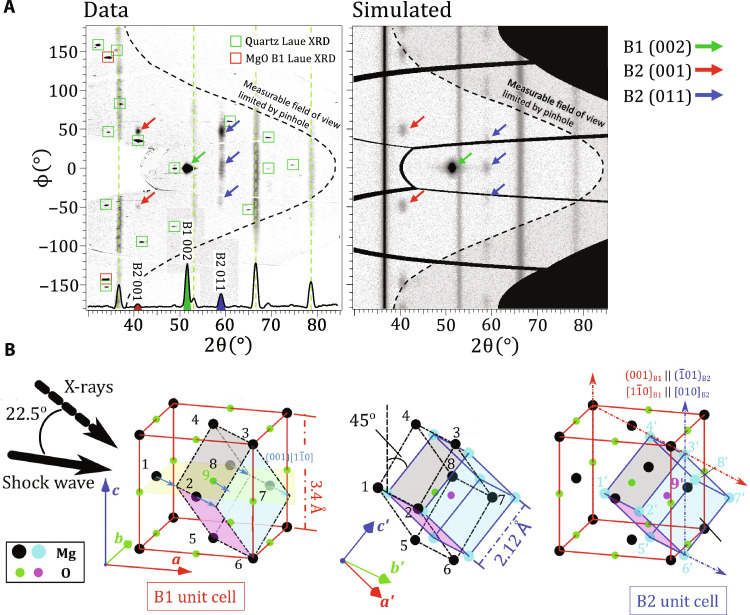
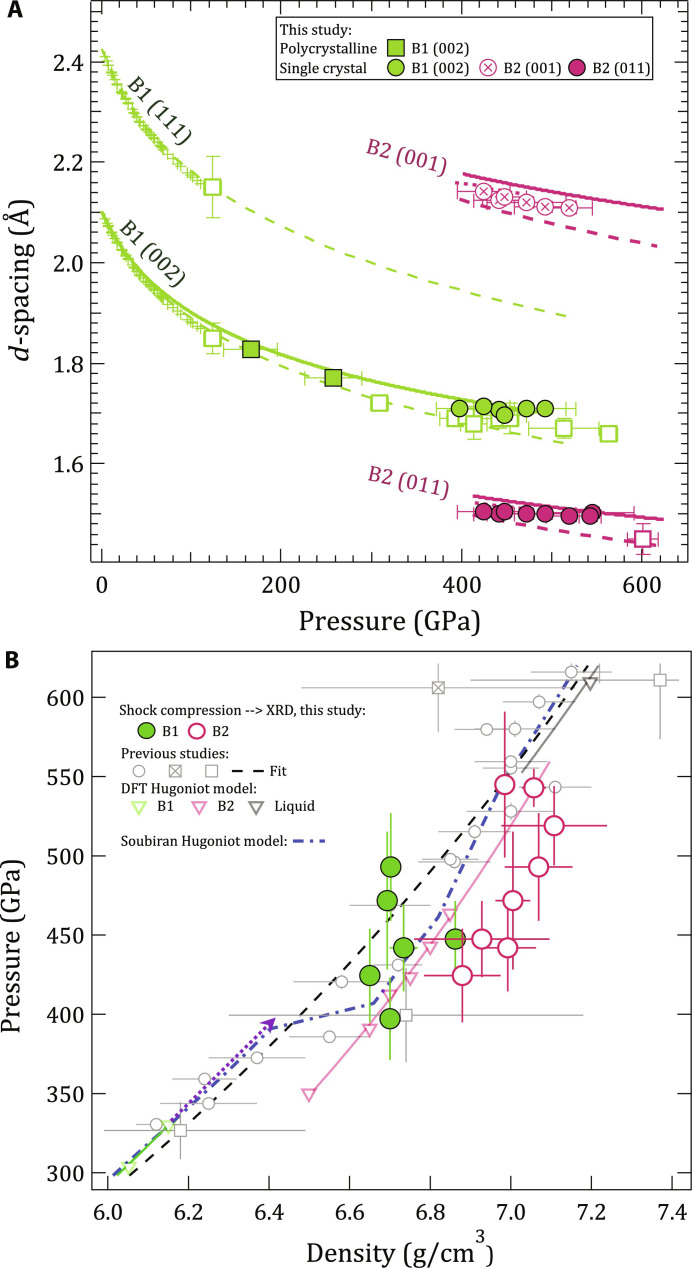
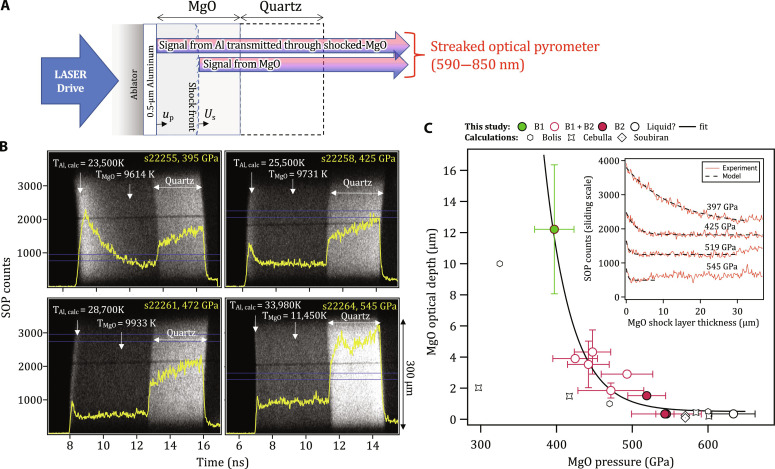
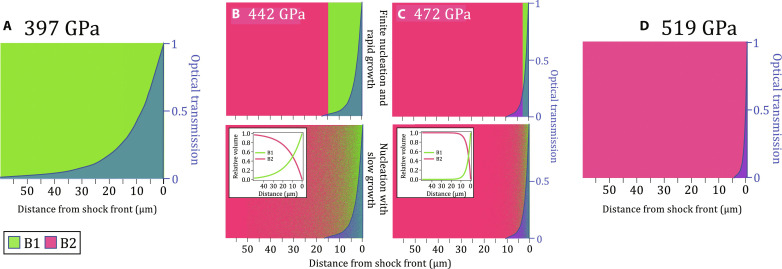
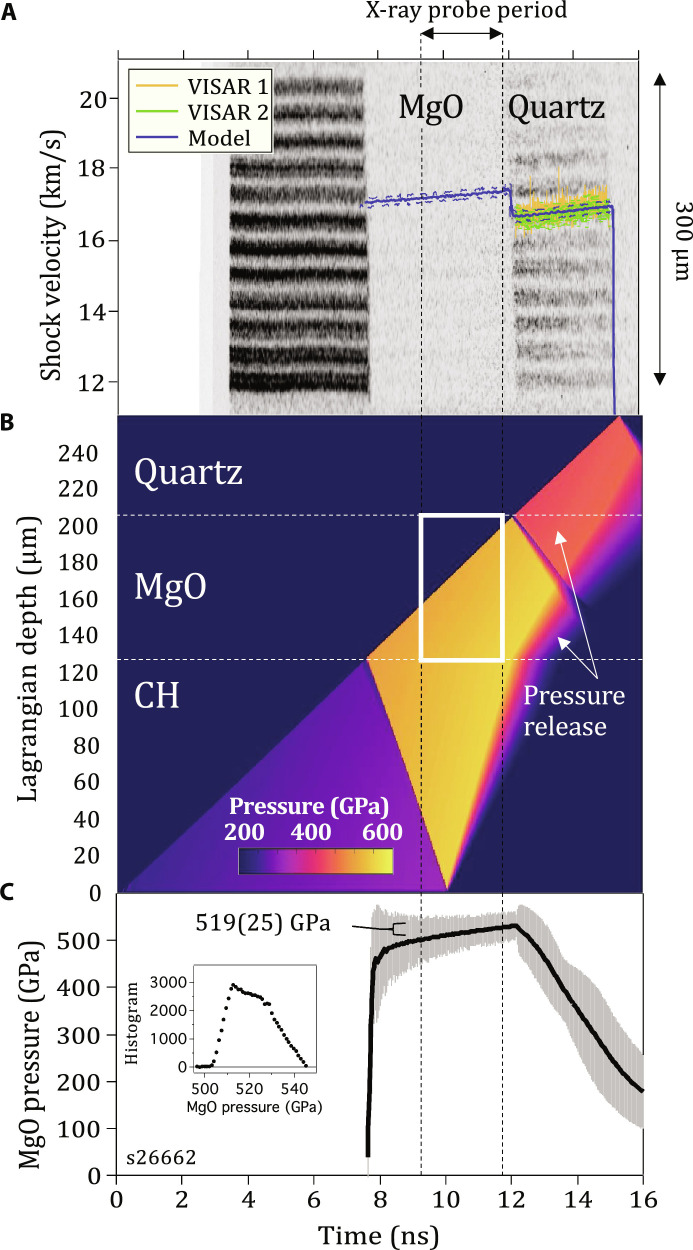
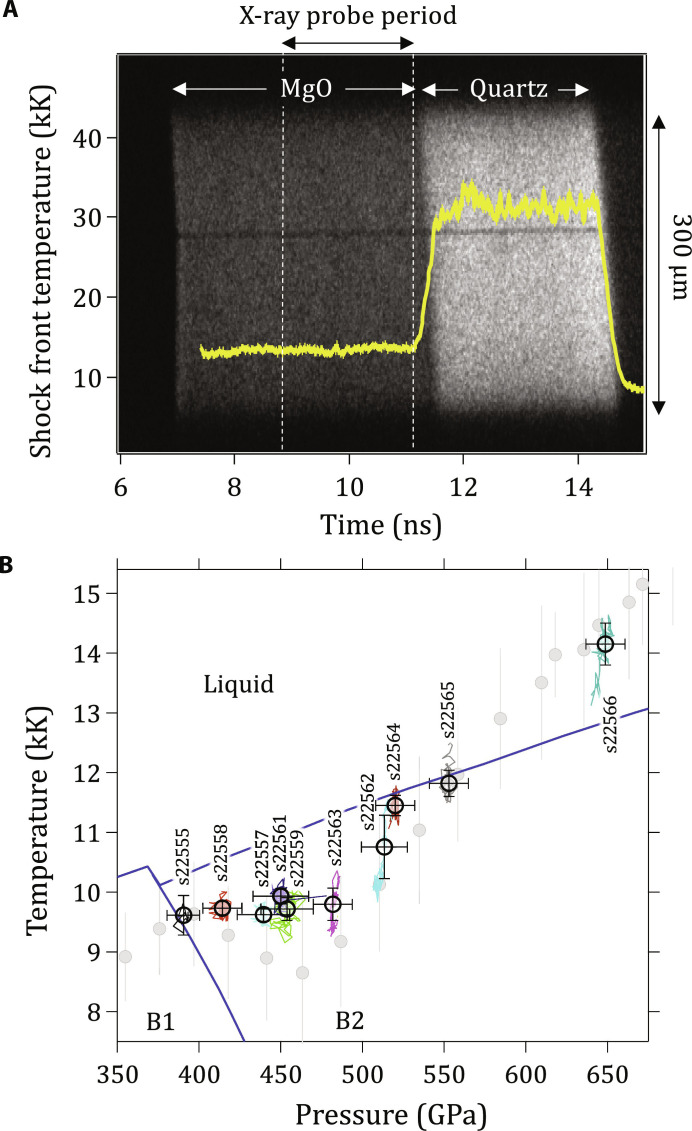
Magnesium oxide (MgO) is a major component of the Earth's mantle and is expected to play a similar role in the mantles of large rocky exoplanets. At extreme pressures, MgO transitions from the NaCl B1 crystal structure to a CsCl B2 structure, which may have implications for exoplanetary deep mantle dynamics. In this study, we constrain the phase diagram of MgO with laser-compression along the shock Hugoniot, with simultaneous measurements of crystal structure, density, pressure, and temperature. We identify the B1 to B2 phase transition between 397 and 425 gigapascal (around 9700 kelvin), in agreement with recent theory that accounts for phonon anharmonicity. From 425 to 493 gigapascal, we observe a mixed-phase region of B1 and B2 coexistence. The transformation follows the Watanabe-Tokonami-Morimoto mechanism. Our data are consistent with B2-liquid coexistence above 500 gigapascal and complete melting at 634 gigapascal. This study bridges the gap between previous theoretical and experimental studies, providing insights into the timescale of this phase transition.


Figures

Fig. 1.
Fig. 1.. Summary of single-crystal MgO results.
(A) Measured temperature and phase identifications of MgO as a function of pressure (see also fig. S1). The region of largest disagreement in previous shock experiments [gray bands, (19); gray circles, (8) with a pressure correction from (10); see fig. S11] is between 400 and 500 GPa, which corresponds in this study to that of the mixed B1 + B2 phase region. In contrast, theoretical calculations predict smaller temperature excursions along the shock Hugoniot [dotted (10), black dashed (15), and blue dash-dot (16)]. The corresponding phase boundaries are shown for melting [gray dashed, (17)] and the B1-B2 boundary [gray dash-dot, in increasing pressure (17, 18, 77, 78)]. B1 and B2 temperatures measured in this study are most consistent with the phase diagram of recent theory [blue solid lines, (16)]. The Hugoniot from the single phase (B1-only) Sesame equation-of-state table #7460 is shown as the solid green curve (64). (B) Integrated diffraction signal for B1 and B2 diffraction peaks as a function of sample pressure (see Materials and Methods). We note that the pressures associated with temperature (top, calculated over a skin depth at the shock front) differ slightly from those from XRD (bottom, calculated over the entire shocked volume). See table S1, and Materials and Methods for details.
Fig. 2.
Fig. 2.. Texture analysis of XRD data.
(A) Qualitative agreement between experimental image plates projected in 2θ-ϕ and a simulated diffraction pattern at P = 442(28) GPa. (Left, bottom axis) An averaged intensity lineout shows features consistent with both the B1 and B2 phases, and Ta calibrant at 1 bar. The red and green boxes represent simulated Laue diffraction locations from MgO B1 and uncompressed quartz [001] single crystals, respectively, from broadband x-ray thermal emission generated within the Cu He-α x-ray source plasma (see Materials and Methods). Also shown are Ta reference peaks (dashed green lines). (B) Our data are consistent with the WTM mechanism (26, 27), which is described in two steps: (left) sliding of atoms within alternate (001)B1 layers in the [11¯0]B1 direction (blue arrows along yellow plane) to unit cell denoted by black dashed-dot lines, followed by (center) an expansion in the [110]B1 direction (vectors connecting atoms 1 to 8 and 2 to 7) and a uniform compression perpendicular to this direction, i.e., the [001]B1 and the [11¯0]B1 direction (atoms 3 to 6, 4 to 5, 1 to 2, and 8 to 7). The resulting [010]B2 axis is orientated 45° to [001]B1. (right) The WTM mechanism results in (001)B1 || ( 1¯01)B2 and [11¯0]B1 || [010]B2 and produces six variants that can be detected in our experiments.
Fig. 3.
Fig. 3.. Lattice spacings of observed diffraction peaks of MgO and determined density.
(A) d-spacing as a function of pressure for our data (maroon and green circles) are compared to those measured under ramp compression [open squares, (9)]. Static data are shown as crosses with an extrapolation to high pressure using a Vinet EOS fit (green dashed) (30). Theoretical d-spacing curves for the B2 phase are shown for calculations both at 0 K (18) (maroon dashed) and along the Hugoniot (maroon dotted) (10). d-spacing determined from a cubic fit to Hugoniot shock and particle velocity data are also plotted (solid green and solid maroon curves) (10). (B) Calculated pressure and measured density for the B1 (green circles) and B2 phases (maroon circles) (see Materials and Methods). Hugoniot data based on shock-speed measurements are shown as the open circle, open square, and crossed square symbols (, , , –61). A Hugoniot based on density functional theory calculations is shown as the green (B1), maroon (B2), and black (liquid) open triangles (10). Solid line fits to these points are based on linear fits in Us-up. The Hugoniot calculated from quasi-harmonic ab initio molecular dynamics calculations from Soubiran et al. (16) are shown as the blue dash-dot curve). The purple dashed arrow represents an extension of the B1 phase up to pressure where we see only B1 in our XRD data. An expanded pressure-density plot range is shown in fig. S2.
Fig. 4.
Fig. 4.. Measurement of optical depth in shocked MgO as a function of pressure.
(A) The target design consists of a polyimide ablator, a 0.5-μm Al layer directly coated on to an 80-μm-thick MgO [100] single crystal and a 60-μm-thick quartz layer. As the shock propagates through the target assembly, thermal emission from the hot, compressed Al layer, ∼constant over the lifetime of the experiment, is transmitted and attenuated through the shocked-MgO crystal and recorded by the SOP diagnostic. The raw data from the SOP for four different pressures are shown in (B) with intensity lineouts, taken from the region defined by two horizontal blue lines, shown as the bold yellow curves. In each case, the calculated Al shock temperature is shown (79) as well as the measured MgO shock temperature. (C) (Inset) The optical depth is determined by considering the time taken for Al thermal emission to drop from a peak level to 37% of the peak, while the associated MgO shock-thickness is calculated from US and uP estimates. (Main plot) Estimated values of optical depth are plotted along with calculations based on theory (15, 19, 72) (see Materials and Methods).
Fig. 5.
Fig. 5.. Possible distributions of phase fractions within compressed MgO.
(A) Representation of a compressed volume of MgO at a shock pressure of 397 GPa (B1-only, green). On the basis of the measured optical depth at this pressure (∼12 μm, Fig. 4C), the optical transmission as a function of distance away from the shock front can be calculated (blue-shaded region). This represents the relative volume-dependent contribution to the SOP temperature measurement (as plotted in Fig. 1A). (B and C) represent pressures within the XRD measured mixed B1 + B2 phase region (Fig. 1A). For each pressure, the relative proportion of B1 (green) and B2 (maroon) phases are estimated by relative changes in normalized XRD intensity with pressure, as plotted in Fig. 1B. As our XRD data are volume-integrated, we cannot determine how the B1 and B2 phases are distributed within the compressed MgO, and knowledge of this distribution within the optical skin depth is needed to correctly interpret the measurements of temperature. Here, we consider two possibilities based on different transformation kinetics models: (top) finite nucleation and rapid (instantaneous) growth into the B2 phase, which results in a two-phase structure with distinctly separated B1 and B2 volumes and (bottom) nucleation with slow growth, resulting in a random mixed-phase assemblage within the measured optical skin depth. Our data are most consistent with the latter model and B2 nucleation time scales of <0.25 ns. The representation in (D) for a shock pressure of 519 GPa is B2-only (maroon) with a measured optical depth of <1 μm (Fig. 4C).
Fig. 6.
Fig. 6.. Pressure determination of shock compressed MgO.
(A) Raw VISAR image with shock transit periods within the MgO and quartz layers highlighted. Shock velocity in quartz, US,Qtz(t), measured by two independent VISAR channels, is shown with uncertainties as the orange and green traces. Simulated US (t) through the MgO and quartz layers are shown as the blue trace, with dashed blue error bands based on experimental measurement uncertainties. Time = 0 ns represents the laser turn on time. (B) P(x,t) output from an HYADES hydrocode simulation (57). (C) Calculated average pressure versus time within the MgO sample with uncertainties that reflect the pressure distribution during the x-ray probe period. Inset figure shows a histogram of the pressure states within the MgO sample during the x-ray probe time [white box in (B)]. See Materials and Methods for details.
Fig. 7.
Fig. 7.. Determination of MgO temperature from pyrometry measurements.
(A) Raw SOP data for shot s22264 [P = 520(12) GPa], where thermal emission from the MgO and quartz layers, over the 300-μm field of view, are indicated. Also plotted is the calculated shock-front temperature (yellow; see Materials and Methods). (B) Measured MgO shock-front temperature plotted as a function of calculated MgO shock-front pressure during the x-ray probe period. The shot number for each data point is shown. Recent quasi-anharmonic calculations by Soubiran et al. (2020) for the melt, and the B1-B2 phase boundary (blue curves) are also shown (16). The gray circles represent decaying shock measurements by McWilliams et al. (8), which have been corrected in pressure based on the subsequent Us-up measurements by Root et al. (see fig. S11) (10). Data points (as plotted in Fig. 1A) are shown as circles with uncertainties that represent the SD of the measured temperature and calculated pressure distribution (colored curves) during the probe period. An additional estimated ±300 K random temperature uncertainty associated with SOP measurements is combined with the distribution error bars shown here for the uncertainties shown in Fig. 1A (see Materials and Methods).

References

    1. Mehl M., Hemley R., Boyer L., Potential-induced breathing model for the elastic moduli and high-pressure behavior of the cubic alkaline-earth oxides. Phys. Rev. B 33, 8685–8696 (1986). - PubMed
    1. Duffy T. S., Hemley R. J., Mao H.-K., Equation of state and shear strength at multimegabar pressures: Magnesium oxide to 227 GPa. Phys. Rev. Lett. 74, 1371–1374 (1995). - PubMed
    1. T. Irifune, T. Tsuchiya, Phase transitions and mineralogy of the lower mantle, in Treatise on Geophysics (Elsevier BV, ed. 2, 2015).
    1. Coppari F., Smith R., Wang J., Millot M., Kim D., Rygg J., Hamel S., Eggert J., Duffy T., Implications of the iron oxide phase transition on the interiors of rocky exoplanets. Nat. Geosci. 14, (2021).
    1. Spaargaren R. J., Wang H. S., Mojzsis S. J., Ballmer M. D., Tackley P. J., Plausible constraints on the range of bulk terrestrial exoplanet compositions in the solar neighborhood. Astrophys. J. 948, 53 (2023).