. 2024 Jun 7;10(23):eadn7191.
doi: 10.1126/sciadv.adn7191. Epub 2024 Jun 7.

Mechanism of human PINK1 activation at the TOM complex in a reconstituted system

Affiliations

Mechanism of human PINK1 activation at the TOM complex in a reconstituted system

Olawale G Raimi et al. Sci Adv. .

Abstract

Loss-of-function mutations in PTEN-induced kinase 1 (PINK1) are a frequent cause of early-onset Parkinson's disease (PD). Stabilization of PINK1 at the translocase of outer membrane (TOM) complex of damaged mitochondria is critical for its activation. The mechanism of how PINK1 is activated in the TOM complex is unclear. Here, we report that co-expression of human PINK1 and all seven TOM subunits in Saccharomyces cerevisiae is sufficient for PINK1 activation. We use this reconstitution system to systematically assess the role of each TOM subunit toward PINK1 activation. We unambiguously demonstrate that the TOM20 and TOM70 receptor subunits are required for optimal PINK1 activation and map their sites of interaction with PINK1 using AlphaFold structural modeling and mutagenesis. We also demonstrate an essential role of the pore-containing subunit TOM40 and its structurally associated subunits TOM7 and TOM22 for PINK1 activation. These findings will aid in the development of small-molecule activators of PINK1 as a therapeutic strategy for PD.


Figures
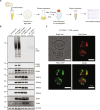
Fig. 1.
Fig. 1.. Co-expression of human PINK1 and TOM complex in yeast is sufficient for PINK1 activation.
(A) Schematic of experimental workflow of PINK1 reconstitution in yeast. Image was created using BioRender.com. Yeast cells were transformed with all four plasmids carrying two plasmids each of the eight components for reconstitution. Cells were selected on a synthetic complete dropout plate, and positive clones were used for protein expression. After expression, cells were harvested and lysed, and the cell lysate was analyzed for protein expression. (B) Co-expression of human PINK1 and TOM complex subunits induces PINK1 activation. Stable yeast transformants were selected expressing wild-type (WT) or kinase-inactive (KI; D384A) full-length human PINK1-3FLAG and TOM5, TOM6, TOM7, TOM20, TOM22, TOM40, and TOM70 subunits (TOM complex) or WT human PINK1 alone. Expression was induced by supplementing the growth medium with 2% galactose. 20 μg of whole-cell lysates was run on 4 to 12% bis-tris gel and transferred onto nitrocellulose membrane followed by immunoblotting with anti-Ub pS65, anti-PINK1 pS228, anti-total PINK1, and other indicated antibodies. Data for three independent experiments are shown in fig. S14. (C) Localization of expressed human PINK1 to yeast mitochondria. Stable yeast transformants expressing WT full-length human PINK1-GFP and TOM5, TOM6, TOM7, TOM20, TOM22, TOM40, and TOM70 subunits (TOM complex) were generated, and mitochondria were stained by addition of 500 nM of MitoTracker CMXRos Red. Following incubation, cells were briefly spun down, washed twice with phosphate-buffered saline, and applied to concavalin A–coated coverslips that were placed on glass slides for immediate image acquisition using a Leica DMi8 microscope. Further processing was carried out in the Leica LAS X software platform that includes histogram adjustment and denoising with THUNDER. Images correspond to bright-field microscopy, and mitochondria were stained by MitoTracker (red) and PINK1-GFP (green).
Fig. 2.
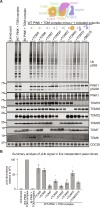
Fig. 2.. Intact TOM complex required for optimal PINK1 activation.
(A) Genetic analysis of role of TOM subunits on PINK1 activation. Stable yeast transformants were selected expressing WT or KI (D384A) full-length human PINK1-3FLAG and TOM5, TOM6, TOM7, TOM20, TOM22, TOM40, and TOM70 subunits (TOM complex or TOM complex minus indicated subunits). Expression was induced by supplementing the growth medium with 2% galactose. Whole-cell lysates (20 μg) were run on 4 to 12% bis-tris gel and transferred onto nitrocellulose membrane followed by immunoblotting with anti-Ub pS65, anti-PINK1 pS228, anti-total PINK1, and other indicated antibodies. Data representative of two independent experiments. (B) Summary quantification of Ub pS65 levels normalized to WT PINK1 + TOM complex. Data represents means ± SEM of five independent yeast clones.
Fig. 3.
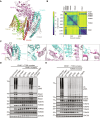
Fig. 3.. Structural modeling of PINK1-TOM complex predicts direct interaction between PINK1 and TOM20.
(A) Overall structure of AlphaFold prediction of PINK1-TOM complex (TOM7, green; TOM22, yellow/red; and TOM40, orange/gray) indicates direct PINK1 (pink) interaction with TOM20 (cyan). (B) Predicted aligned error (PAE) plot highlights predicted interaction between PINK1 and TOM20, marked by red boxes. N-terminal segment of PINK1 transverses one TOM40 pore [moderate confidence (blue boxes)], while other TOM components form high confident model as indicated. (C) A close-up view illustrates binding interface between PINK1 and TOM20, wherein the N-terminal extension (NTE) and C-terminal extension (CTE) regions of PINK1 interact with C-terminal region of TOM20 (α1 to α3 helices). Key interactions between conserved amino acids of PINK1 and TOM20 are indicated. (D and E) Mutational analysis in yeast cells confirms critical role of PINK1 NTE/CTE interaction with TOM20 for PINK1 activation. (D) Hydrophobic leucines on PINK1 at the interface were mutated to alanine (L532A, L539A, and L540A and L532A/L539A/L540A), cells expressing these mutants were grown on YP medium supplemented with 2% raffinose, and protein expression was induced by the addition of galactose. Whole-cell lysate (20 μg) was subjected to immunoblot analysis, phospho-ubiquitin was blotted as a readout of PINK1 activation, and PINK1 was detected by anti-total PINK1 antibody. (E) Residues on TOM20 making interactions with PINK1 were mutated to alanine (Q67A and E78A), cells expressing these mutants were grown on YP medium supplemented with 2% raffinose, and protein expression was induced by the addition of galactose. Whole-cell lysate (20 μg) was subjected to immunoblot analysis, phospho-ubiquitin was blotted as a readout of PINK1 activation, and PINK1 was detected by anti-total PINK1 antibody. The effect of these mutations on PINK1 activity was assayed and compared with the WT, KI PINK1, and the minus TOM20 cells.
Fig. 4.
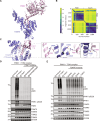
Fig. 4.. PINK1 binds TOM70 via N-terminal region preceding NTE.
(A) AlphaFold model of PINK1 in complex with TOM70. PINK1 is colored in pink and TOM70 in purple. (B) PAE plot highlights the interaction between PINK1 and TOM70, indicated with red boxes. (C) Close-up view shows residues making direct interaction between the two proteins. (D and E) Mutational analysis in yeast cells confirms role of PINK1-TOM70 interaction for PINK1 activation. Cells carrying mutations and the corresponding controls were grown on YP medium supplemented with 2% raffinose, and protein expression was induced by the addition of galactose. Cells were harvested and processed, and phospho-ubiquitin was blotted as a readout of PINK1 activation with anti-total PINK1 antibody and indicated antibodies using Li-COR Odyssey CLx imaging system. (D) N-terminal residues on PINK1 at the interface were mutated (R83A, R88A, and R98A and R83A/R88A/R98A or R83E/R88E/R98E), cells expressing these mutants were grown on YP medium supplemented with 2% raffinose, and protein expression was induced by the addition of galactose. Whole-cell lysate (20 μg) was subjected to immunoblot analysis, phospho-ubiquitin was blotted as a readout of PINK1 activation, and PINK1 was detected by anti-total PINK1 antibody. The membranes were also blotted using the indicated antibodies. (E) Residues on TOM70 making interactions with PINK1 were mutated to alanine (D488A, D545A, and E549A), cells expressing these mutants were grown on YP medium supplemented with 2% raffinose, and protein expression was induced by the addition of galactose. Whole-cell lysate (20 μg) was subjected to immunoblot analysis, phospho-ubiquitin was blotted as a readout of PINK1 activation, and PINK1 was detected by anti-total PINK1 antibody. The membranes were also blotted using the indicated antibodies using Li-COR. The effect of these mutations on PINK1 activity was assayed and compared with the WT, KI PINK1, and the minus TOM70 cells.
Fig. 5.
Fig. 5.. Optimal PINK1 activation requires interaction with TOM20 and TOM70 in mammalian cells following mitochondrial depolarization.
(A) Schematic of workflow of analysis of PINK1 TOM-binding mutants in PINK1 knockout (KO) Flp-In Trex HeLa cells. The schematic image was made using BioRender. (B) PINK1 CTE TOM20-defective binding mutants lead to reduced PINK1 activation. Stably expressing PINK1-3FLAG WT, KI (D384A), and CTE mutant [L532A, L539A, and L540A and triple mutant (L532A/L539A/L540A)] cell lines were generated in PINK1-knockout Flp-In TRex HeLa cells. PINK1-3FLAG expression was induced by 24 hours of treatment with 0.2 μM doxycycline (Dox), and mitochondrial depolarization was induced by 3 hours of treatment with 10 μM antimycin A/1 μM oligomycin (AO) where indicated. Whole-cell lysates were subjected to immunoblotting with anti-PINK1, anti-Ub pS65 [Cell Signaling Technology (CST)], anti-OPA1 [BD Biosciences (BD)], and anti–glyceraldehyde-3-phosphate dehydrogenase (GAPDH) primary antibodies. Data representative of three independent experiments. (C) PINK1 TOM70-defective binding mutants lead to reduced PINK1 activation. Stably expressing PINK1-3FLAG WT, KI (D384A), and N-terminal mutant [R83A, R88A, and L98A and triple (R83A/R88A/L98A or R83E/R88E/R98E)] cell lines were generated in PINK1 knockout Flp-In TRex HeLa cells. PINK1-3FLAG expression was induced by 24 hours of treatment with 0.2 μM doxycycline, and mitochondrial depolarization was induced by 3 hours of treatment with AO where indicated. Whole-cell lysates were subjected to immunoblotting with anti-PINK1, anti-Ub pS65 (CST), anti-OPA1 (BD), and anti-GAPDH primary antibodies. Data representative of three independent experiments.
Fig. 6.
Fig. 6.. PINK1 stabilization at the TOM complex is dependent on TOM20 and TOM70 interaction in mammalian cells upon mitochondrial depolarization.
(A) Schematic of workflow of BN-PAGE analysis of PINK1 TOM-binding mutants in HeLa cells. (B) Mitochondrial enriched fractions were isolated from PINK1 knockout Flp-In TRex HeLa cells stably expressing PINK1-3FLAG WT, KI (D384A), and TOM20-defective binding mutant (L532A/L539A/L540A), and TOM70-defective binding mutant (R83E/R88E/R98E) mutants were treated with antimycin/oligomycin for 3 hours and then subjected to BN-PAGE and immunoblotted (IB) for anti-TOM40 or anti-PINK1 antibodies. Samples were also subjected to SDS-PAGE and immunoblotting with anti-TOM40 or anti-PINK1 antibodies, and total protein was visualized by Ponceau S staining.
Fig. 7.
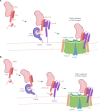
Fig. 7.. Schematic models of role of TOM70 and TOM20 interaction with PINK1 mediating stabilization and activation at the TOM complex at sites of damaged mitochondria.
(A) Interaction of the PINK1 TIR region with the CTD pocket of TOM70 occurs concurrently with interaction of the PINK1 NTE:CTE interface with the C-terminal α1 to α3 helices of TOM20 and is required for PINK1 stabilization at the TOM complex. Image was created using BioRender.com. (B) Sequential binding of PINK1 TIR region to CTD pocket of TOM70 followed by PINK1 NTE:CTE interface with the C-terminal α1 to α3 helices of TOM20 is required for PINK1 stabilization at the TOM complex. Image was created using BioRender.com.

References

    1. Valente E. M., Abou-Sleiman P. M., Caputo V., Muqit M. M. K., Harvey K., Gispert S., Ali Z., Del Turco D., Bentivoglio A. R., Healy D. G., Albanese A., Nussbaum R., González-Maldonado R., Deller T., Salvi S., Cortelli P., Gilks W. P., Latchman D. S., Harvey R. J., Dallapiccola B., Auburger G., Wood N. W., Hereditary early-onset Parkinson’s disease caused by mutations in PINK1. Science 304, 1158–1160 (2004). - PubMed
    1. Kitada T., Asakawa S., Hattori N., Matsumine H., Yamamura Y., Minoshima S., Yokochi M., Mizuno Y., Shimizu N., Mutations in the parkin gene cause autosomal recessive juvenile parkinsonism. Nature 392, 605–608 (1998). - PubMed
    1. Goodall E. A., Kraus F., Harper J. W., Mechanisms underlying ubiquitin-driven selective mitochondrial and bacterial autophagy. Mol. Cell 82, 1501–1513 (2022). - PMC - PubMed
    1. Agarwal S., Muqit M. M. K., PTEN-induced kinase 1 (PINK1) and Parkin: Unlocking a mitochondrial quality control pathway linked to Parkinson’s disease. Curr. Opin. Neurobiol. 72, 111–119 (2022). - PubMed
    1. Vargas J. N. S., Hamasaki M., Kawabata T., Youle R. J., Yoshimori T., The mechanisms and roles of selective autophagy in mammals. Nat. Rev. Mol. Cell Biol. 24, 167–185 (2023). - PubMed

MeSH terms

Substances