

Modeling dynamics of acute HIV infection incorporating density-dependent cell death and multiplicity of infection
- PMID: 38848426
- PMCID: PMC11189221
- DOI: 10.1371/journal.pcbi.1012129
Modeling dynamics of acute HIV infection incorporating density-dependent cell death and multiplicity of infection
Abstract
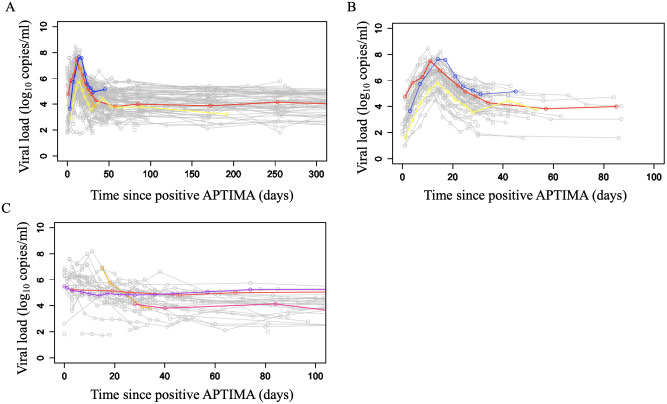
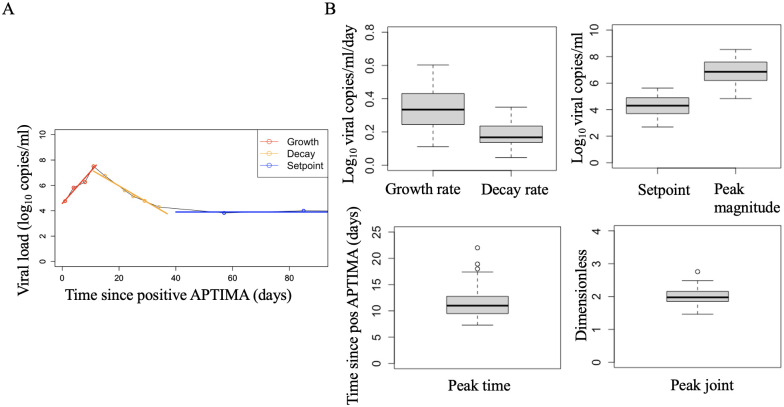
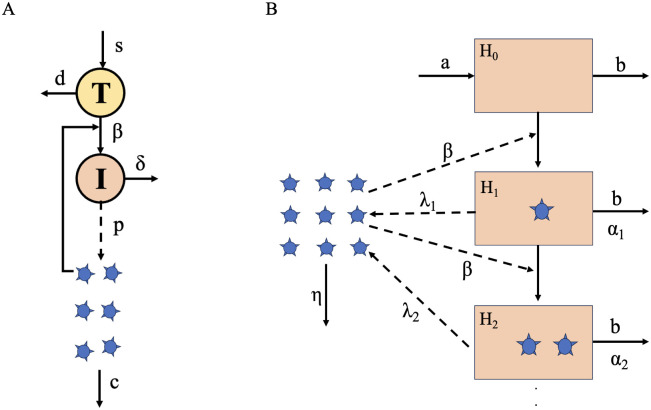
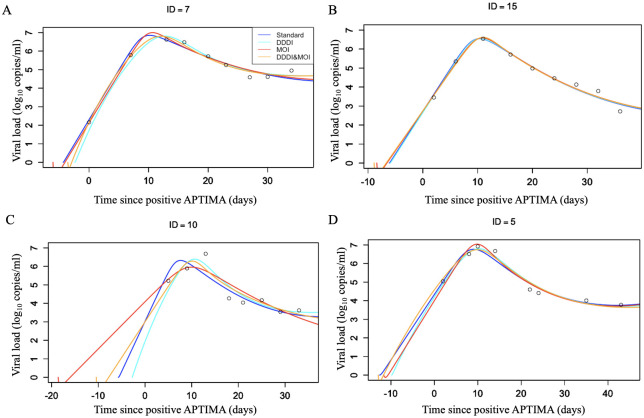
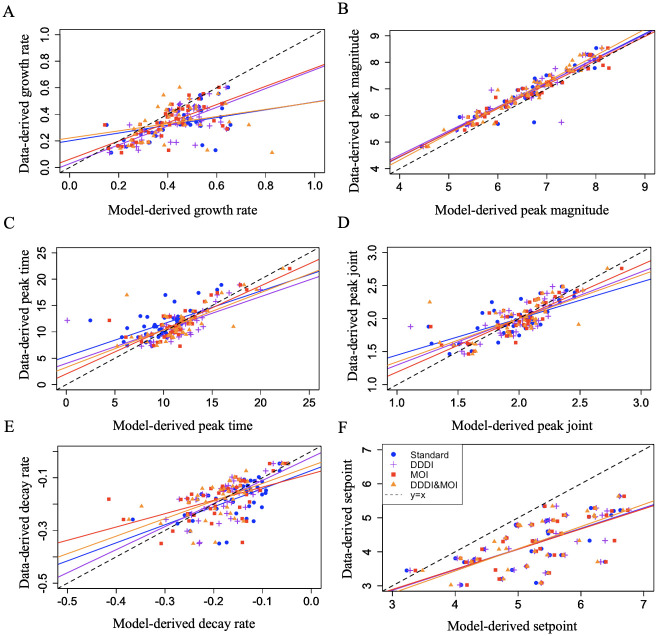
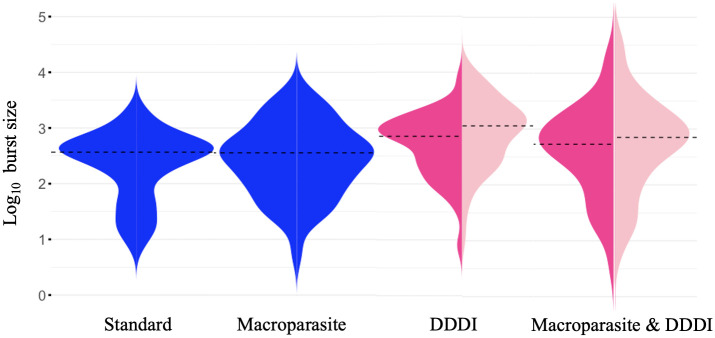
Understanding the dynamics of acute HIV infection can offer valuable insights into the early stages of viral behavior, potentially helping uncover various aspects of HIV pathogenesis. The standard viral dynamics model explains HIV viral dynamics during acute infection reasonably well. However, the model makes simplifying assumptions, neglecting some aspects of HIV infection. For instance, in the standard model, target cells are infected by a single HIV virion. Yet, cellular multiplicity of infection (MOI) may have considerable effects in pathogenesis and viral evolution. Further, when using the standard model, we take constant infected cell death rates, simplifying the dynamic immune responses. Here, we use four models-1) the standard viral dynamics model, 2) an alternate model incorporating cellular MOI, 3) a model assuming density-dependent death rate of infected cells and 4) a model combining (2) and (3)-to investigate acute infection dynamics in 43 people living with HIV very early after HIV exposure. We find that all models qualitatively describe the data, but none of the tested models is by itself the best to capture different kinds of heterogeneity. Instead, different models describe differing features of the dynamics more accurately. For example, while the standard viral dynamics model may be the most parsimonious across study participants by the corrected Akaike Information Criterion (AICc), we find that viral peaks are better explained by a model allowing for cellular MOI, using a linear regression analysis as analyzed by R2. These results suggest that heterogeneity in within-host viral dynamics cannot be captured by a single model. Depending on the specific aspect of interest, a corresponding model should be employed.
Copyright: This is an open access article, free of all copyright, and may be freely reproduced, distributed, transmitted, modified, built upon, or otherwise used by anyone for any lawful purpose. The work is made available under the Creative Commons CC0 public domain dedication.
Conflict of interest statement
I have read the journal’s policy and the authors of this manuscript have the following competing interests: JMC has served as a consultant for Excision BioTherapeutics and Merck.
Figures
Similar articles
-
Unveiling ecological/evolutionary insights in HIV viral load dynamics: Allowing random slopes to observe correlational changes to CpG-contents and other molecular and clinical predictors.Epidemics. 2024 Jun;47:100770. doi: 10.1016/j.epidem.2024.100770. Epub 2024 May 14. Epidemics. 2024. PMID: 38761432 Free PMC article.
-
Reassessing the human immunodeficiency virus type 1 life cycle through age-structured modeling: life span of infected cells, viral generation time, and basic reproductive number, R0.J Virol. 2009 Aug;83(15):7659-67. doi: 10.1128/JVI.01799-08. Epub 2009 May 20. J Virol. 2009. PMID: 19457999 Free PMC article.
-
Emergence of recombinant forms of HIV: dynamics and scaling.PLoS Comput Biol. 2007 Oct;3(10):2003-18. doi: 10.1371/journal.pcbi.0030205. Epub 2007 Sep 6. PLoS Comput Biol. 2007. PMID: 17967052 Free PMC article.
-
[Deep lung--cellular reaction to HIV].Rev Port Pneumol. 2007 Mar-Apr;13(2):175-212. Rev Port Pneumol. 2007. PMID: 17492233 Review. Portuguese.
-
The role of antigenic stimulation and cytotoxic T cell activity in regulating the long-term immunopathogenesis of HIV: mechanisms and clinical implications.Proc Biol Sci. 2001 Oct 22;268(1481):2085-95. doi: 10.1098/rspb.2001.1777. Proc Biol Sci. 2001. PMID: 11600072 Free PMC article. Review.
Cited by
-
Comparative analysis of within-host dynamics of acute infection and viral rebound dynamics in postnatally SHIV-infected ART-treated infant rhesus macaques.bioRxiv [Preprint]. 2024 May 23:2024.05.21.595130. doi: 10.1101/2024.05.21.595130. bioRxiv. 2024. Update in: Epidemics. 2024 Sep;48:100780. doi: 10.1016/j.epidem.2024.100780. PMID: 38826467 Free PMC article. Updated. Preprint.
-
Assessing the impact of autologous neutralizing antibodies on rebound dynamics in postnatally SHIV-infected ART-treated infant rhesus macaques.bioRxiv [Preprint]. 2024 Jun 3:2024.06.01.596971. doi: 10.1101/2024.06.01.596971. bioRxiv. 2024. Update in: Epidemics. 2024 Sep;48:100780. doi: 10.1016/j.epidem.2024.100780. PMID: 38895223 Free PMC article. Updated. Preprint.
-
A consensus mathematical model of vaccine-induced antibody dynamics for multiple vaccine platforms and pathogens.Front Immunol. 2025 Jun 26;16:1596518. doi: 10.3389/fimmu.2025.1596518. eCollection 2025. Front Immunol. 2025. PMID: 40642065 Free PMC article.
References
-
- WHO. HIV; 2022. apps.who.int/iris/handle/10665/342899.
MeSH terms
Grants and funding
LinkOut - more resources
Full Text Sources
Medical
