Host-defence caerin 1.1 and 1.9 peptides suppress glioblastoma U87 and U118 cell proliferation through the modulation of mitochondrial respiration and induce the downregulation of CHI3L1
- PMID: 38848430
- PMCID: PMC11161062
- DOI: 10.1371/journal.pone.0304149
Host-defence caerin 1.1 and 1.9 peptides suppress glioblastoma U87 and U118 cell proliferation through the modulation of mitochondrial respiration and induce the downregulation of CHI3L1
Abstract
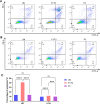
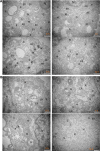
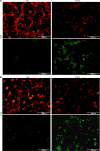
Glioblastoma, the most aggressive form of brain cancer, poses a significant global health challenge with a considerable mortality rate. With the predicted increase in glioblastoma incidence, there is an urgent need for more effective treatment strategies. In this study, we explore the potential of caerin 1.1 and 1.9, host defence peptides derived from an Australian tree frog, in inhibiting glioblastoma U87 and U118 cell growth. Our findings demonstrate the inhibitory impact of caerin 1.1 and 1.9 on cell growth through CCK8 assays. Additionally, these peptides effectively curtail the migration of glioblastoma cells in a cell scratch assay, exhibiting varying inhibitory effects among different cell lines. Notably, the peptides hinder the G0/S phase replication in both U87 and U118 cells, pointing to their impact on the cell cycle. Furthermore, caerin 1.1 and 1.9 show the ability to enter the cytoplasm of glioblastoma cells, influencing the morphology of mitochondria. Proteomics experiments reveal intriguing insights, with a decrease in CHI3L1 expression and an increase in PZP and JUNB expression after peptide treatment. These proteins play roles in cell energy metabolism and inflammatory response, suggesting a multifaceted impact on glioblastoma cells. In conclusion, our study underscores the substantial anticancer potential of caerin 1.1 and 1.9 against glioblastoma cells. These findings propose the peptides as promising candidates for further exploration in the realm of glioblastoma management, offering new avenues for developing effective treatment strategies.
Copyright: © 2024 Wang et al. This is an open access article distributed under the terms of the Creative Commons Attribution License, which permits unrestricted use, distribution, and reproduction in any medium, provided the original author and source are credited.
Conflict of interest statement
The authors have declared that no competing interests exist.
Figures


Similar articles
-
Comparative Proteomic Study of the Antiproliferative Activity of Frog Host-Defence Peptide Caerin 1.9 and Its Additive Effect with Caerin 1.1 on TC-1 Cells Transformed with HPV16 E6 and E7.Biomed Res Int. 2018 May 13;2018:7382351. doi: 10.1155/2018/7382351. eCollection 2018. Biomed Res Int. 2018. PMID: 29862288 Free PMC article.
-
Iodine-125 labeled Australian frog tree host-defense peptides caerin 1.1 and 1.9 better inhibit human breast cancer cells growth than the unlabeled peptides. 125I-caerin 1.9 may better be used for the treatment of breast cancer.Hell J Nucl Med. 2018 May-Aug;21(2):115-120. doi: 10.1967/s002449910803. Epub 2018 Jul 12. Hell J Nucl Med. 2018. PMID: 30006645
-
Caerin 1.1 and 1.9 Peptides from Australian Tree Frog Inhibit Antibiotic-Resistant Bacteria Growth in a Murine Skin Infection Model.Microbiol Spectr. 2021 Sep 3;9(1):e0005121. doi: 10.1128/Spectrum.00051-21. Epub 2021 Jul 14. Microbiol Spectr. 2021. PMID: 34259550 Free PMC article.
-
Caerin 1 Peptides, the Potential Jack-of-All-Trades for the Multiple Antibiotic-Resistant Bacterial Infection Treatment and Cancer Immunotherapy.Biomed Res Int. 2022 Apr 11;2022:7841219. doi: 10.1155/2022/7841219. eCollection 2022. Biomed Res Int. 2022. PMID: 35445137 Free PMC article. Review.
-
Improving the efficacy of cancer immunotherapy by host-defence caerin 1.1 and 1.9 peptides.Hum Vaccin Immunother. 2024 Dec 31;20(1):2385654. doi: 10.1080/21645515.2024.2385654. Epub 2024 Aug 28. Hum Vaccin Immunother. 2024. PMID: 39193797 Free PMC article. Review.
Cited by
-
Caerin 1.1 and 1.9 peptides halt B16 melanoma metastatic tumours via expanding cDC1 and reprogramming tumour macrophages.J Transl Med. 2024 Oct 28;22(1):973. doi: 10.1186/s12967-024-05763-x. J Transl Med. 2024. PMID: 39468595 Free PMC article.
-
Caerin 1.1 and 1.9 peptides induce acute caspase 3/GSDME-mediated pyroptosis in epithelial cancer cells.Sci Rep. 2025 Apr 18;15(1):13377. doi: 10.1038/s41598-025-96438-0. Sci Rep. 2025. PMID: 40251208 Free PMC article.
References
-
- Lovely MP. Symptom management of brain tumor patients. Semin Oncol Nurs. 2004;20(4):273–83. . - PubMed
MeSH terms
Substances
LinkOut - more resources
Full Text Sources
Miscellaneous

