. 2024 Jun 7;20(6):e1012157.
doi: 10.1371/journal.pcbi.1012157. eCollection 2024 Jun.

Mechanistic computational modeling of monospecific and bispecific antibodies targeting interleukin-6/8 receptors

Affiliations

Mechanistic computational modeling of monospecific and bispecific antibodies targeting interleukin-6/8 receptors

Christina M P Ray et al. PLoS Comput Biol. .

Abstract

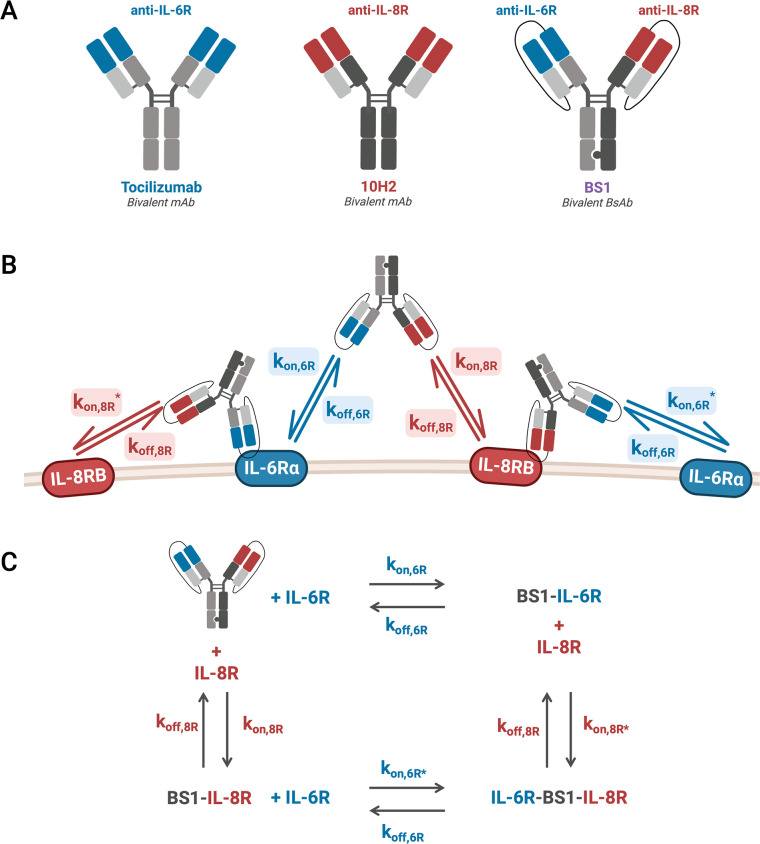
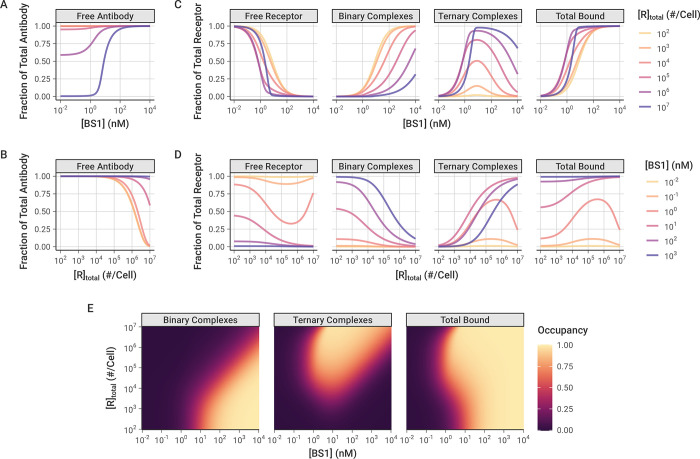
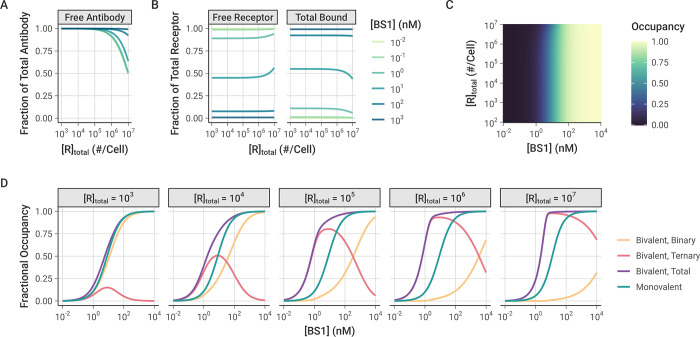
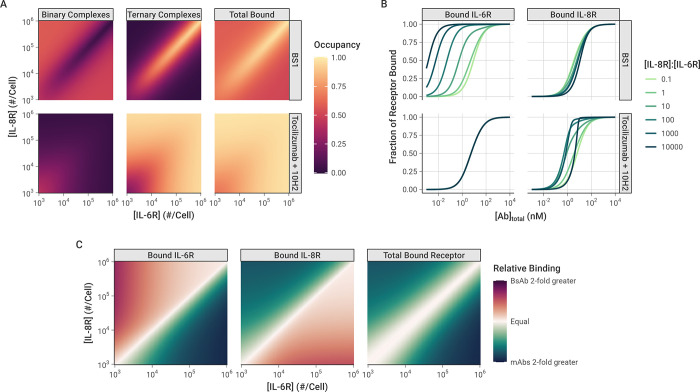
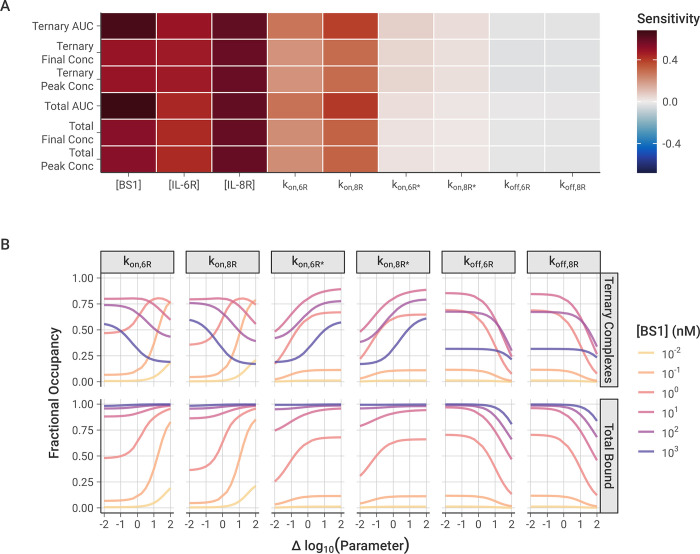
The spread of cancer from organ to organ (metastasis) is responsible for the vast majority of cancer deaths; however, most current anti-cancer drugs are designed to arrest or reverse tumor growth without directly addressing disease spread. It was recently discovered that tumor cell-secreted interleukin-6 (IL-6) and interleukin-8 (IL-8) synergize to enhance cancer metastasis in a cell-density dependent manner, and blockade of the IL-6 and IL-8 receptors (IL-6R and IL-8R) with a novel bispecific antibody, BS1, significantly reduced metastatic burden in multiple preclinical mouse models of cancer. Bispecific antibodies (BsAbs), which combine two different antigen-binding sites into one molecule, are a promising modality for drug development due to their enhanced avidity and dual targeting effects. However, while BsAbs have tremendous therapeutic potential, elucidating the mechanisms underlying their binding and inhibition will be critical for maximizing the efficacy of new BsAb treatments. Here, we describe a quantitative, computational model of the BS1 BsAb, exhibiting how modeling multivalent binding provides key insights into antibody affinity and avidity effects and can guide therapeutic design. We present detailed simulations of the monovalent and bivalent binding interactions between different antibody constructs and the IL-6 and IL-8 receptors to establish how antibody properties and system conditions impact the formation of binary (antibody-receptor) and ternary (receptor-antibody-receptor) complexes. Model results demonstrate how the balance of these complex types drives receptor inhibition, providing important and generalizable predictions for effective therapeutic design.


Conflict of interest statement

I have read the journal’s policy and the authors of this manuscript have the following competing interests: Johns Hopkins University has filed intellectual property on technologies described herein with HY and JBS listed as inventors (WO2020243479A1 and WO2020243489A1).

Figures

Fig 1
Fig 1. Bivalent antibody binding model antibodies, rate constants, and reactions.
A, Monoclonal (mAb) and bispecific (BsAb) antibodies simulated in our computational model. Tocilizumab is a recombinant humanized mAb with two anti-IL-6Rα (denoted anti-IL-6R) binding domains; 10H2 is a mAb with two anti-IL-8RB (denoted anti-IL-8R) binding domains; BS1 is an anti-IL-6Rα/anti-IL-8RB BsAb synthesized from the binding domains of tocilizumab and 10H2 by combining the knobs-into-holes and single-chain Fab methodologies. B, Schematic of the IL-6Rα/IL-8RB/BS1 antibody-binding model kinetics. BS1 can bind to either IL-6Rα or IL-8RB, and, having done so, the BS1-receptor complex can then bind to the other receptor. kon,6R and kon,8R describe the association rates for the formation of binary antibody-receptor complexes, and kon,6R* and kon,8R* describe the association rates for the formation ternary receptor-antibody-receptor complexes. The same koff,6R and koff,8R rate constants are used for the dissociation of both the binary and the ternary complexes. Schematics for the two monoclonal antibodies, tocilizumab and 10H2, are included in the Supporting Information (S1 Fig). C, Simplified view of the schematic in B illustrates how the reactions form a thermodynamic cycle. The reactions can proceed in a clockwise or counter-clockwise manner to return back to the starting reactants, forming a cycle with a net free energy change of 0. This figure was created with BioRender.com.
Fig 2
Fig 2. Optimization of binding association and dissociation constants to experimental data.
The cost function is calculated as the sum of the squared differences between the normalized model output and the normalized experimental data at each antibody concentration used. “All Norm” includes all of the optimized parameter sets from each of the different normalization options described in the Methods, and “BS1 Norm” highlights the parameter sets where the model output was normalized against the bound concentration of BS1 at the initial concentrations used to normalize the experimental data, which was the best-performing normalization. Figures separated by normalization scheme and figures with a narrow range of parameter values are available in the Supporting Information (S2–S4 Figs). A, Relationship between initial guesses and optimized values for each binding reaction rate constant. kon,8R* is not pictured because its initial and ‘optimized’ values were determined from the other parameters using the thermodynamic cycle relationship. B, Distribution of optimized parameter values across all optimizations performed. Marked points indicate the values of the lowest cost parameter set (values are listed in Table 2). C, Relationship between optimized parameter values and the cost of the optimized parameter sets compared to experimental data, separated by parameter. Optimized points with the same value are grouped into a single point, with the point size indicating how many optimized parameter values are in the group.
Fig 3
Fig 3. Model simulation results using the best-fit parameter set compared to the experimental data used to fit the model parameters.
Simulations were performed under the same conditions as the experiment: 105 cells/well, receptor expression levels from the transduced cell lines (Table 1), and with a 2-hour initial association period followed by a 15-minute free antibody washout. The model simulation results (lines) are compared to the equivalent experimental data (dots). Simulations beyond the range of antibody concentrations used in the experimental data are indicated with dashed lines. Experimental data was not obtained for the combination of tocilizumab and 10H2, but simulations are presented here for comparison. Model output and experimental data are each normalized to the bound BS1 concentration from the initial antibody concentrations where binding reached saturation. The error bars depict the standard error from three experimental replicates; the experimental data was previously published [28]. Simulation results with all obtained parameter sets are included in the Supporting Information (S7 Fig).
Fig 4
Fig 4. Simulations illustrate the dynamics of BS1 antibody binding to IL-6R and IL-8R over time.
Initial BS1 concentration = 100 nM and 105 cells/well for all simulations. Free (unbound) BS1 concentration was set to 0 nM at 2 hours to simulate antibody washout from the system. The expression levels of IL-6R and IL-8R from the transduced experimental cell lines (Table 1) were used in the simulations. Simulation results for additional antibodies and antibody concentrations are included in the Supporting Information (S8 Fig).
Fig 5
Fig 5. Simulated Binary (Ab-R), Ternary (R-Ab-R), and Total Bound (Binary + Ternary) levels of bispecific BS1-Receptor complexes, over a range of antibody doses and receptor expression levels.
In these simulations, IL-6R and IL-8R are present in a 1:1 ratio, and simulations were performed for 24 hours after antibody dosing. A-B, Fraction of total BS1 concentration in free (unbound) state for different levels of initial BS1 (A) and receptor (B). C-D, Fraction of total receptor (IL-6R + IL-8R) in different forms/complexes for different levels of initial BS1 (C) and receptor (D). E, Bound receptor fraction across different levels of initial BS1 and receptors. The color indicates the fraction of the total receptor (IL-6R + IL-8R) that is bound to BS1 in each antibody-receptor complex type. A similar heat map for different tocilizumab and 10H2 concentrations is included in the Supporting Information (S9 Fig).
Fig 6
Fig 6. Simulations of monovalent BS1 binding over varying initial antibody and receptor concentrations.
In these simulations, although the cells express both receptors, the formation of ternary complexes was suppressed by setting kon,6R* and kon,8R*to 0. IL-6R and IL-8R are present in a 1:1 ratio, and simulations were performed for 24 hours after antibody dosing. Similar results for the combination of the monospecific antibodies tocilizumab and 10H2 are included in the Supporting Information (S11 Fig). A, Fraction of total BS1 that is free (unbound) for different levels of receptor expression and initial BS1 concentration. B, Fraction of total receptor concentration (IL-6R + IL-8R) that is unbound (free) or bound (in binary antibody-receptor complexes) for different levels of receptor expression and initial BS1 concentration. The same results, but with antibody and receptor visualization reversed, are included in the Supporting Information (S10 Fig). C, Bound receptor fraction across different initial BS1 and receptor levels. The color indicates the fraction of the total receptor (IL-6R + IL-8R) that is bound to antibody. D, Comparison of monovalent and bivalent binding. The lines indicate the fraction of total receptor (IL-6R + IL-8R) that is bound in different complex types in the original simulations and the simulations restricted to monovalent binding only. Each panel represents a different receptor level (in # receptors/cell).
Fig 7
Fig 7. Comparison of antibody-receptor complex formation: BS1 vs. combination of tocilizumab and 10H2.
All simulations were performed for 24 hours after antibody dosing. A, Fraction of all receptors (IL-6R + IL-8R) that are bound in Binary and Ternary complexes, and Total Bound receptor (Binary + Ternary) across different IL-6R and IL-8R concentrations. The color indicates the fraction of all receptors (IL-6R + IL-8R) that are bound in each antibody-receptor complex type. Initial BS1 concentration = 10 nM; initial tocilizumab concentration = 5 nM and initial 10H2 concentration = 5 nM. Heat maps of additional total antibody concentrations are available in the Supporting Information (S12 Fig). B, The fractional occupancy of each receptor individually when one receptor (IL-8R) is in excess. IL-6R was fixed at 103 receptors/cell for these simulations, while IL-8R ranged from 102 to 107 receptors/cell. The fractional occupancy indicates the fraction of the specific receptor concentration (either IL-6R or IL-8R) that is bound to antibody (either BS1 or the combination of tocilizumab and 10H2). Results with IL-8R as the fixed receptor are included in the Supporting Information (S13 Fig). C, Comparison of receptor bound by BS1 (BsAb) or the combination of tocilizumab and 10H2 (mAbs) across different receptor concentrations. Relative binding is the ratio of fractional bound receptor (the fraction of total IL-6R + IL-8R bound to antibody) when BS1 is used compared to when the combination of mAbs is used. Similar heat maps for different total antibody concentrations are included in the Supporting Information (S14 Fig).
Fig 8
Fig 8. Local and global sensitivity of model output to association and dissociation rate constants and the initial antibody and receptor concentrations.
A, Local sensitivity analysis of model output with varying rate constants and initial concentrations. 10 nM baseline BS1 concentration, [IL-6R] = [IL-8R] = 5 × 10⁴ receptors/cell, and output at t = 2 hours for all simulations. Area Under the Curve (AUC) is calculated as the integration of the BS1-receptor complex concentration over time, determined for the ternary complexes and for the total bound receptor (IL-6R + IL-8R). Sensitivity is calculated as the percentage change in the output divided by the percentage change in the parameter (10% for these simulations). B, Global sensitivity of fractional bound receptor concentration over varying rate constant value. Each parameter was varied over two orders of magnitude below and above its optimized value. Fractional occupancy is determined as the fraction of total receptor (IL-6R + IL-8R) that is bound to BS1 in a particular complex type, separated for ternary complexes and total bound in binary or ternary complexes. Simulations were performed for 24 hours after antibody dosing, and [IL-6R] = [IL-8R] = 5 × 10⁴ receptors/cell for all simulations.

Update of

Similar articles

Cited by

References

    1. Hodge DR, Hurt EM, Farrar WL. The role of IL-6 and STAT3 in inflammation and cancer. Eur J Cancer 2005;41(16):2502–2512. doi: 10.1016/j.ejca.2005.08.016 - DOI - PubMed
    1. Hong DS, Angelo LS, Kurzrock R. Interleukin-6 and its receptor in cancer. Cancer 2007;110(9):1911–1928. doi: 10.1002/cncr.22999 - DOI - PubMed
    1. Hoch RC, Schraufstätter IU, Cochrane CG. In vivo, in vitro, and molecular aspects of interleukin-8 and the interleukin-8 receptors. J Lab Clin Med 1996;128(2):134–145. doi: 10.1016/s0022-2143(96)90005-0 - DOI - PubMed
    1. Petersen F, Flad HD, Brandt E. Neutrophil-activating peptides NAP-2 and IL-8 bind to the same sites on neutrophils but interact in different ways. Discrepancies in binding affinities, receptor densities, and biologic effects. J Immunol 1994;152(5):2467–2478. doi: 10.4049/jimmunol.152.5.2467 - DOI - PubMed
    1. Chuntharapai A, Kim KJ. Regulation of the expression of IL-8 receptor A/B by IL-8: possible functions of each receptor. J Immunol 1995;155(5):2587–2594. doi: 10.4049/jimmunol.155.5.2587 - DOI - PubMed

MeSH terms