. 2024 Jun 7;20(6):e1011311.
doi: 10.1371/journal.pgen.1011311. eCollection 2024 Jun.

An eQTL-based approach reveals candidate regulators of LINE-1 RNA levels in lymphoblastoid cells

Affiliations

An eQTL-based approach reveals candidate regulators of LINE-1 RNA levels in lymphoblastoid cells

Juan I Bravo et al. PLoS Genet. .

Abstract

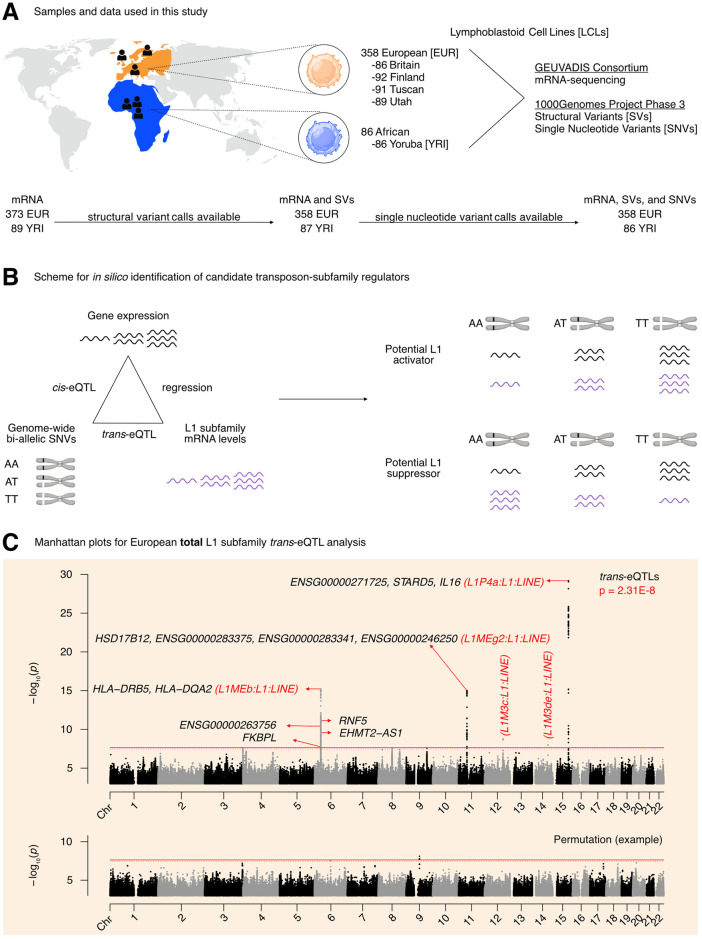
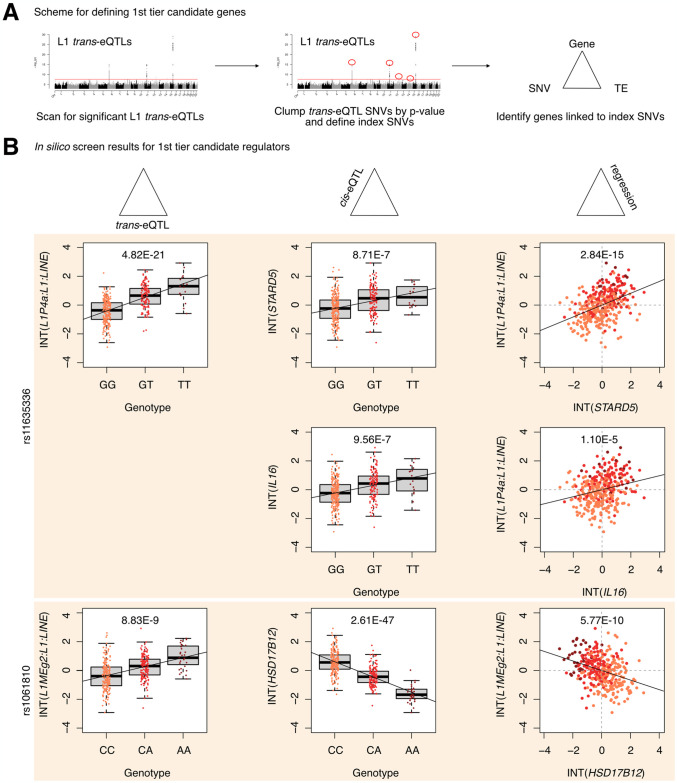
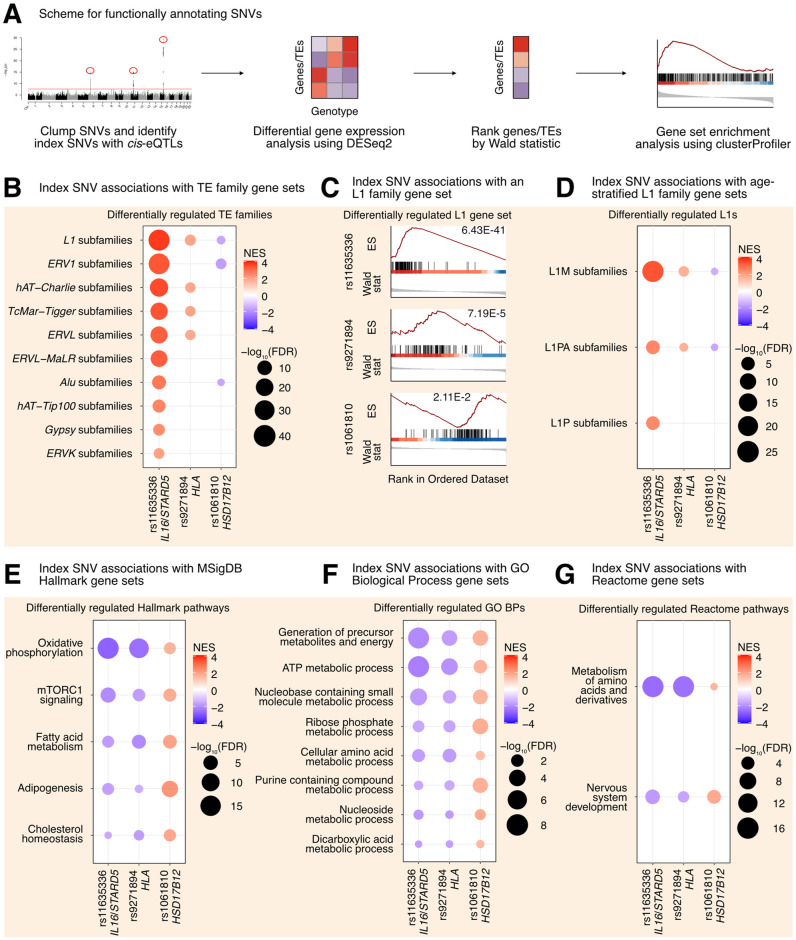
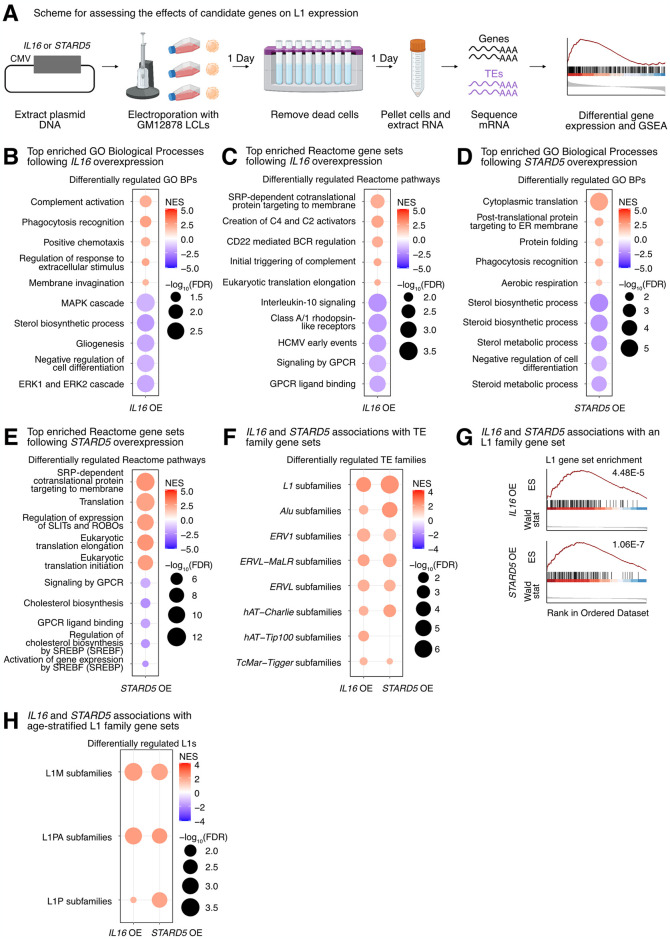
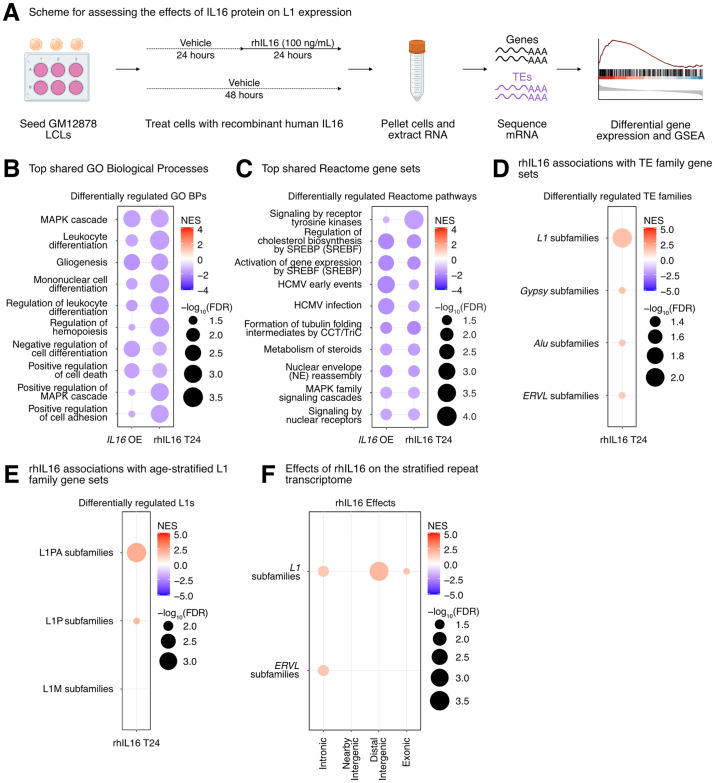
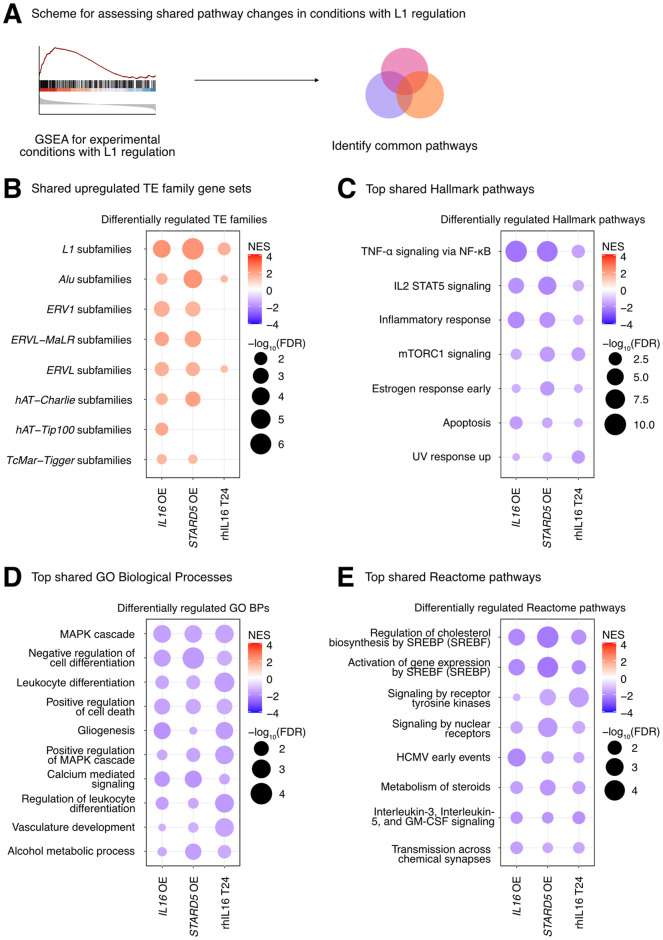
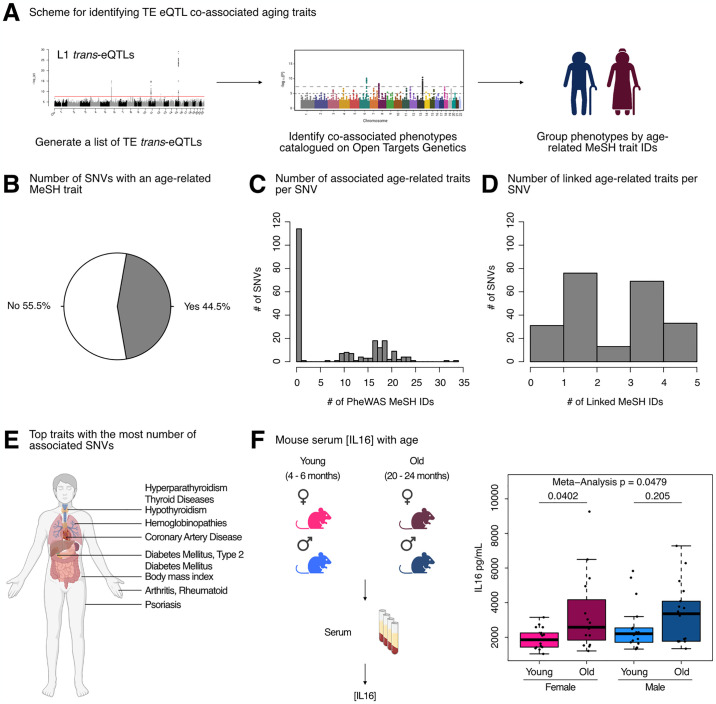
Long interspersed element 1 (LINE-1; L1) are a family of transposons that occupy ~17% of the human genome. Though a small number of L1 copies remain capable of autonomous transposition, the overwhelming majority of copies are degenerate and immobile. Nevertheless, both mobile and immobile L1s can exert pleiotropic effects (promoting genome instability, inflammation, or cellular senescence) on their hosts, and L1's contributions to aging and aging diseases is an area of active research. However, because of the cell type-specific nature of transposon control, the catalogue of L1 regulators remains incomplete. Here, we employ an eQTL approach leveraging transcriptomic and genomic data from the GEUVADIS and 1000Genomes projects to computationally identify new candidate regulators of L1 RNA levels in lymphoblastoid cell lines. To cement the role of candidate genes in L1 regulation, we experimentally modulate the levels of top candidates in vitro, including IL16, STARD5, HSD17B12, and RNF5, and assess changes in TE family expression by Gene Set Enrichment Analysis (GSEA). Remarkably, we observe subtle but widespread upregulation of TE family expression following IL16 and STARD5 overexpression. Moreover, a short-term 24-hour exposure to recombinant human IL16 was sufficient to transiently induce subtle, but widespread, upregulation of L1 subfamilies. Finally, we find that many L1 expression-associated genetic variants are co-associated with aging traits across genome-wide association study databases. Our results expand the catalogue of genes implicated in L1 RNA control and further suggest that L1-derived RNA contributes to aging processes. Given the ever-increasing availability of paired genomic and transcriptomic data, we anticipate this new approach to be a starting point for more comprehensive computational scans for regulators of transposon RNA levels.


Conflict of interest statement

The authors have declared that no competing interests exist.

Figures

Fig 1
Fig 1. Overview of the pipeline developed to scan for L1 transcriptional regulators in silico.
(A) An illustration of the samples and “omic” data used in this study. Of the 358 European individuals, 187 were female and 171 were male. Of the 86 African individuals, 49 were female and 37 were male. (Note that Utah subjects are of Northern European ancestry, and thus part of the European cohort for analytical purposes). (B) A schematic illustrating how genetic variants, gene expression, and TE expression can be integrated to identify highly correlated SNV-Gene-TE trios. (C) A Manhattan plot for the L1 subfamily trans-eQTL analysis in the European cohort. The genes that passed our three-part integration approach are listed next to the most significant trans-eQTL SNV they were associated with in cis. The dashed line at p = 3.44E-8 corresponds to an average empirical FDR < 0.05, based on 20 random permutations. One such permutation is illustrated in the bottom panel. The solid line at p = 2.31E-8 corresponds to a Benjamini-Hochberg FDR < 0.05. The stricter of the two thresholds, p = 2.31E-8, was used to define significant trans-eQTLs. FDR: False Discovery Rate. Panels (A) and (B) were created with BioRender.com.
Fig 2
Fig 2. Identification of 1st tier candidate L1 expression regulators in the European cohort.
(A) A schematic for how 1st tier candidate genes were defined. In short, these were genes in trios with index SNVs that were at the top of their respective peak. (B) The three-part integration results for three protein-coding genes—STARD5, IL16, HSD17B12—that we considered first tier candidates for functional, in vitro testing. In the left column are the trans-eQTLs, in the middle column are the cis-eQTLs, and in the right column are the linear regressions for gene expression against L1 subfamily expression. Expression values following an inverse normal transform (INT) are shown. The FDR for each analysis is listed at the top of each plot. FDR: False Discovery Rate.
Fig 3
Fig 3. L1 trans-eQTLs are associated with subtle, widespread differences in TE families and known TE-associated pathways.
(A) Scheme for functionally annotating gene-linked index SNVs by GSEA. (B) GSEA analysis for shared, significantly regulated TE family gene sets across genotypes for rs11635336 (IL16/STARD5), rs9271894 (HLA), and rs1061810 (HSD17B12). (C) GSEA plots for the L1 family gene set results summarized in (B). For these plots, the FDR value is listed. (D) GSEA analysis for shared, significantly regulated, evolutionary-age-stratified L1 gene sets across genotypes for rs11635336 (IL16/STARD5), rs9271894 (HLA), and rs1061810 (HSD17B12). L1M subfamilies are the oldest, L1P subfamilies are intermediate, and L1PA subfamilies are the youngest. GSEA analysis for top, shared, concomitantly regulated (E) MSigDB Hallmark pathway, (F) GO Biological Process, and (G) Reactome pathway gene sets across genotypes for rs11635336 (IL16/STARD5), rs9271894 (HLA), and rs1061810 (HSD17B12). Shared gene sets were ranked by combining p-values from each individual SNV analysis using Fisher’s method. In each bubble plot, the size of the dot represents the -log10(FDR) and the color reflects the normalized enrichment score. FDR: False Discovery Rate.
Fig 4
Fig 4. Impact of IL16 and STARD5 overexpression on LCL gene and TE expression landscapes.
IL16 and STARD5 overexpression induce changes consistent with their known biology, as well as subtle but widespread upregulation of TE families. (A) Scheme for experimentally validating the roles of IL16 and STARD5 in L1 regulation. GSEA analysis for top, differentially regulated (B) GO Biological Process and (C) Reactome pathway gene sets following IL16 overexpression. GSEA analysis for top, differentially regulated (D) GO Biological Process and (E) Reactome pathway gene sets following STARD5 overexpression. (F) GSEA analysis for shared, significantly regulated TE family gene sets following IL16 and STARD5 overexpression. (G) GSEA plots for the L1 family gene set results summarized in (F). For these plots, the FDR value is listed. (H) GSEA analysis for shared, significantly regulated, evolutionary-age-stratified L1 gene sets across IL16 and STARD5 overexpression. L1M subfamilies are the oldest, L1P subfamilies are intermediate, and L1PA subfamilies are the youngest. In each bubble plot, the size of the dot represents the -log10(FDR) and the color reflects the normalized enrichment score. FDR: False Discovery Rate. Panel (A) was created with BioRender.com.
Fig 5
Fig 5. rhIL16 treatment is sufficient to transiently upregulate an L1 family gene set.
(A) Scheme for experimentally validating the role of rhIL16 in L1 regulation. GSEA analysis for top, shared, concomitantly regulated (B) GO Biological Process and (C) Reactome pathway gene sets following IL16 overexpression and rhIL16 exposure for 24 hours. Shared gene sets were ranked by combining p-values from each individual treatment analysis using Fisher’s method. (D) GSEA analysis for top, differentially regulated TE family gene sets following rhIL16 exposure for 24 hours. (E) GSEA analysis for significantly regulated evolutionary-age-stratified L1 gene sets following rhIL16 exposure for 24 hours. L1M subfamilies are the oldest, L1P subfamilies are intermediate, and L1PA subfamilies are the youngest. (F) GSEA analysis for top, differentially regulated TE family gene sets in different genomic locations following rhIL16 exposure for 24 hours. In each bubble plot, the size of the dot represents the -log10(FDR) and the color reflects the normalized enrichment score. FDR: False Discovery Rate. Panel (A) was created with BioRender.com.
Fig 6
Fig 6. Consistent cellular responses to IL16 overexpression, STARD5 overexpression, and rhIL16 exposure for 24 hours.
IL16 overexpression, STARD5 overexpression, and rhIL16 exposure for 24 hours are associated with subtle but widespread differences in TE families and known TE-associated pathways. (A) Scheme for assessing concordantly regulated TE family and pathway gene sets across conditions where an L1 gene set is upregulated. GSEA analysis for top, shared, concomitantly regulated (B) TE family, (C) MSigDB Hallmark pathway, (D) GO Biological Process, and (E) Reactome pathway gene sets following IL16 overexpression, STARD5 overexpression, and rhIL16 exposure for 24 hours. Shared gene sets were ranked by combining p-values from each individual treatment analysis using Fisher’s method. In each bubble plot, the size of the dot represents the -log10(FDR) and the color reflects the normalized enrichment score. FDR: False Discovery Rate.
Fig 7
Fig 7. L1 trans-eQTLs are co-associated with aging traits in GWAS databases.
(A) Scheme for obtaining trans-eQTL SNV-associated aging phenotypes from the Open Targets Genetics platform. (B) A pie chart representing the number of SNVs (222/499) associated with an aging-related MeSH trait, either by PheWAS or indirectly linked to the phenotype through a proxy lead SNP in LD with the SNV. (C) Histogram depicting the distribution of number of aging MeSH traits associated with the 222/499 SNVs by PheWAS. (D) Histogram depicting the distribution of number of aging MeSH traits linked with the 222/499 SNVs through a proxy lead SNP in LD with the SNVs. (E) A diagram highlighting the organ targets of the top 10 most frequently associated aging traits. (F) The concentrations of circulating IL16 in aging mice of both sexes was assessed by ELISA. Each dot represents an independent animal, with n = 15–17 per group. Significance across age in each sex was assessed using a Wilcoxon test. The p-values from each sex (females in pink and males in blue) were combined by meta-analysis using Fisher’s method. Any p-value < 0.05 was considered significant. Panels (A), (E), and (F) were created with BioRender.com.

Update of

Similar articles

Cited by

References

    1. Lander ES, Linton LM, Birren B, Nusbaum C, Zody MC, Baldwin J, et al.. Initial sequencing and analysis of the human genome. Nature. 2001;409(6822):860–921. doi: 10.1038/35057062 - DOI - PubMed
    1. Venter JC, Adams MD, Myers EW, Li PW, Mural RJ, Sutton GG, et al.. The Sequence of the Human Genome. Science. 2001;291(5507):1304–51. doi: 10.1126/science.1058040 - DOI - PubMed
    1. Brouha B, Schustak J, Badge RM, Lutz-Prigge S, Farley AH, Moran JV, et al.. Hot L1s account for the bulk of retrotransposition in the human population. Proceedings of the National Academy of Sciences. 2003;100(9):5280–5. doi: 10.1073/pnas.0831042100 - DOI - PMC - PubMed
    1. Moran JV, Holmes SE, Naas TP, DeBerardinis RJ, Boeke JD, Kazazian HH Jr. High Frequency Retrotransposition in Cultured Mammalian Cells. Cell. 1996;87(5):917–27. doi: 10.1016/s0092-8674(00)81998-4 - DOI - PubMed
    1. Bravo JI, Nozownik S, Danthi PS, Benayoun BA. Transposable elements, circular RNAs and mitochondrial transcription in age-related genomic regulation. Development. 2020;147(11). doi: 10.1242/dev.175786 - DOI - PMC - PubMed