. 2024 Jun 3;40(6):btae337.
doi: 10.1093/bioinformatics/btae337.

spillR: spillover compensation in mass cytometry data

Affiliations

spillR: spillover compensation in mass cytometry data

Marco Guazzini et al. Bioinformatics. .

Abstract

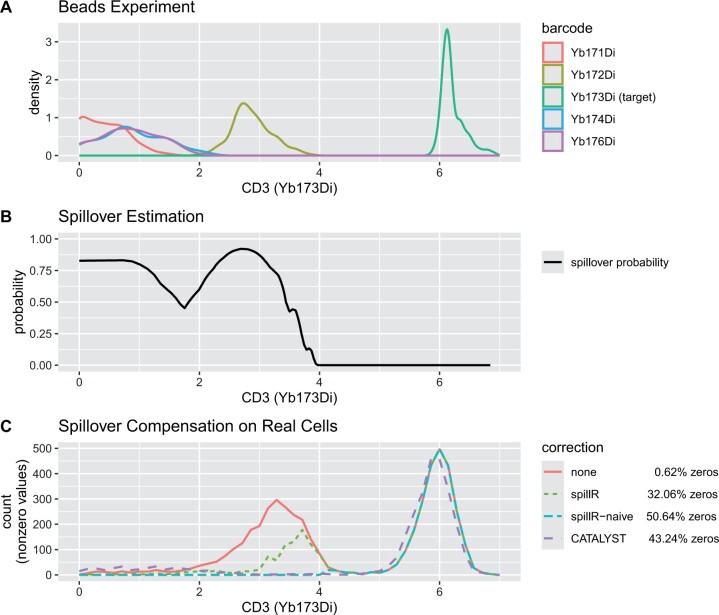
Motivation: Channel interference in mass cytometry can cause spillover and may result in miscounting of protein markers. Chevrier et al. introduce an experimental and computational procedure to estimate and compensate for spillover implemented in their R package CATALYST. They assume spillover can be described by a spillover matrix that encodes the ratio between the signal in the unstained spillover receiving and stained spillover emitting channel. They estimate the spillover matrix from experiments with beads. We propose to skip the matrix estimation step and work directly with the full bead distributions. We develop a nonparametric finite mixture model and use the mixture components to estimate the probability of spillover. Spillover correction is often a pre-processing step followed by downstream analyses, and choosing a flexible model reduces the chance of introducing biases that can propagate downstream.

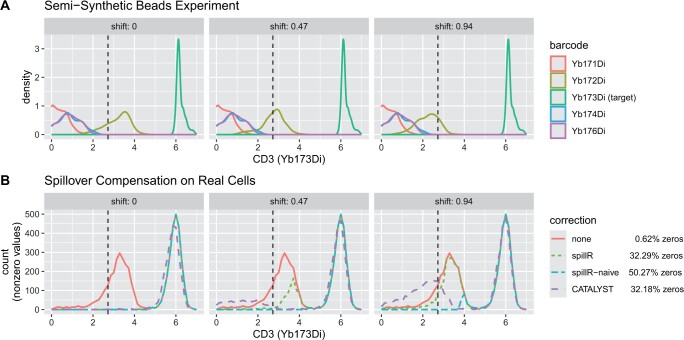
Results: We implement our method in an R package spillR using expectation-maximization to fit the mixture model. We test our method on simulated, semi-simulated, and real data from CATALYST. We find that our method compensates low counts accurately, does not introduce negative counts, avoids overcompensating high counts, and preserves correlations between markers that may be biologically meaningful.

Availability and implementation: Our new R package spillR is on bioconductor at bioconductor.org/packages/spillR. All experiments and plots can be reproduced by compiling the R markdown file spillR_paper.Rmd at github.com/ChristofSeiler/spillR_paper.


Conflict of interest statement

None declared.

Figures

Figure 1.
Figure 1.
Panel (A) shows a density plot of target and spillover markers based on the beads experiment, Panel (B) shows spillover probability for Yb173Di estimated by spillR, and Panel (C) compares spillover compensation on real cells by our methods and CATALYST. Counts are arcsinh transformed with cofactor of five (Bendall et al. 2011), zero counts are not shown. As seen in Panel (C), our baseline method spillR-naive performs similarly to CATALYST and compensates the first peak of the uncorrected data (red) between about 2 and 4 as spillover. By contrast, spillR is sensitive to the difference in shape between the peaks in the bead data (A) and the first peak in the real data (C, red) and only compensates the part of the red curve as spillover that matches the bead experiment. This figure is an example of the diagnostic plot obtained when using the function plotDiagnostics in spillR
Figure 2.
Figure 2.
Three experiments testing our assumptions and sensitivity to bimodal bead distributions. For each experiment, the top row are mean values over the entire range of the experimental setups. The mean values for spillR are computed on values not marked as NA, so the mean ignores the counts attributed to spillover. The bottom row are density plots for three parameter settings to illustrate the generated distributions. Y is the distribution with spillover. Y|Z=1 is the distribution without spillover. Y|Z=2 is the spillover. mean(Y) is the average of the distribution with spillover. mean(Y|Z=1) is the average count without spillover. spillR mean(Y) is the average count after correcting Y
Figure 3.
Figure 3.
Comparison of compensation methods and uncorrected counts on real data. Counts are arcsinh transformed with cofactor of five (Bendall et al. 2011)
Figure 4.
Figure 4.
Comparison of compensation methods and uncorrected counts on semi-synthetic data (spillR and spillR-naive are set to impute spillover values with 0). The vertical dashed line helps to interpret the spillover correction. It indicates the original mode of the bead distribution of Yb172Di at 2.7, before overwriting it with the first peak of the real observations of Yb173Di. Counts are arcsinh transformed with cofactor of five (Bendall et al. 2011). The zero percentages are averages over all three experiments

References

    1. Angelo M, Bendall SC, Finck R. et al. Multiplexed ion beam imaging of human breast tumors. Nat Med 2014;20:436–42. - PMC - PubMed
    1. Bagwell CB, Adams EG.. Fluorescence spectral overlap compensation for any number of flow cytometry parameters. Ann N Y Acad Sci 1993;677:167–84. - PubMed
    1. Bandura DR, Baranov VI, Ornatsky OI. et al. Mass cytometry: technique for real time single cell multitarget immunoassay based on inductively coupled plasma time-of-flight mass spectrometry. Anal Chem 2009;81:6813–22. - PubMed
    1. Bendall SC, Simonds EF, Qiu P. et al. Single-cell mass cytometry of differential immune and drug responses across a human hematopoietic continuum. Science 2011;332:687–96. - PMC - PubMed
    1. Bodenmiller B. Multiplexed epitope-based tissue imaging for discovery and healthcare applications. Cell Syst 2016;2:225–38. - PubMed

Publication types