. 2024 Aug 27;50(5):1255-1265.
doi: 10.1093/schbul/sbae087.

Shared Genetic Architecture Between Schizophrenia and Anorexia Nervosa: A Cross-trait Genome-Wide Analysis

Collaborators, Affiliations

Shared Genetic Architecture Between Schizophrenia and Anorexia Nervosa: A Cross-trait Genome-Wide Analysis

Zheng-An Lu et al. Schizophr Bull. .

Abstract

Background and hypothesis: Schizophrenia (SCZ) and anorexia nervosa (AN) are 2 severe and highly heterogeneous disorders showing substantial familial co-aggregation. Genetic factors play a significant role in both disorders, but the shared genetic etiology between them is yet to be investigated.

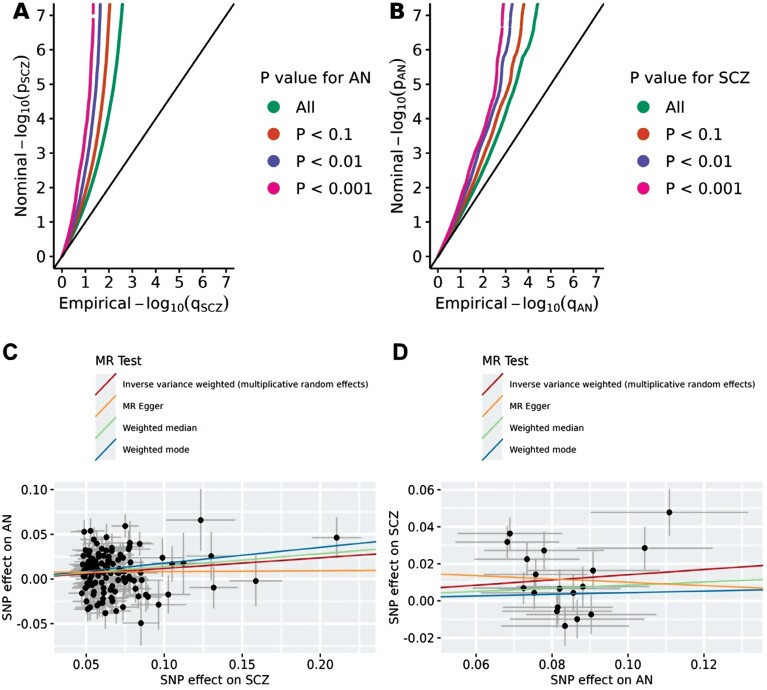
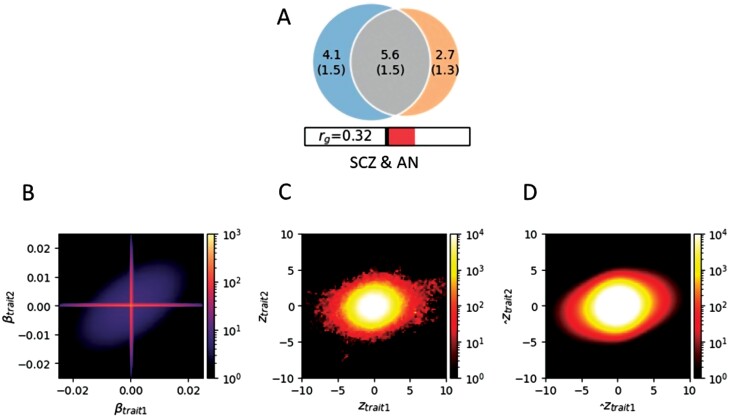
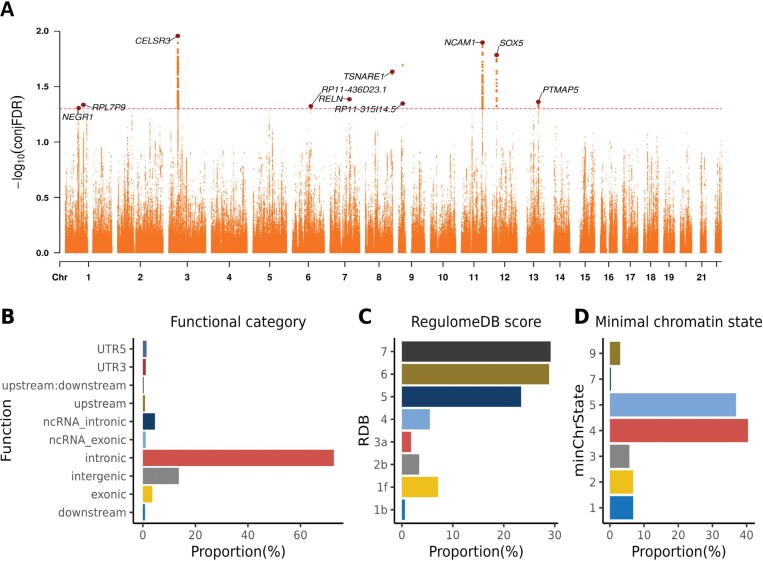
Study design: Using summary statistics from recent large genome-wide association studies on SCZ (Ncases = 53 386) and AN (Ncases = 16 992), a 2-sample Mendelian randomization analysis was conducted to explore the causal relationship between SCZ and AN. MiXeR was employed to quantify their polygenic overlap. A conditional/conjunctional false discovery rate (condFDR/conjFDR) framework was adopted to identify loci jointly associated with both disorders. Functional annotation and enrichment analyses were performed on the shared loci.

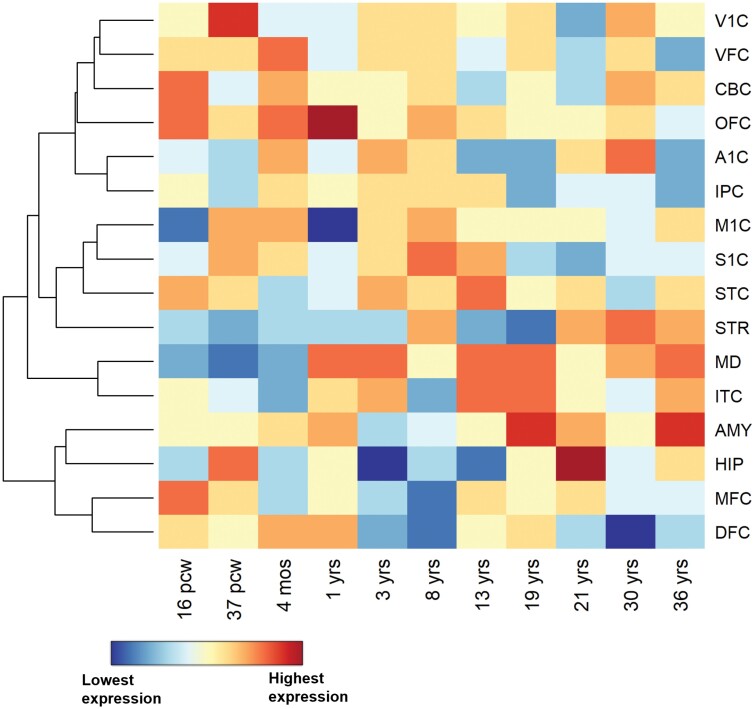
Study results: We observed a cross-trait genetic enrichment, a suggestive bidirectional causal relationship, and a considerable polygenic overlap (Dice coefficient = 62.2%) between SCZ and AN. The proportion of variants with concordant effect directions among all shared variants was 69.9%. Leveraging overlapping genetic associations, we identified 6 novel loci for AN and 33 novel loci for SCZ at condFDR <0.01. At conjFDR <0.05, we identified 10 loci jointly associated with both disorders, implicating multiple genes highly expressed in the cerebellum and pituitary and involved in synapse organization. Particularly, high expression of the shared genes was observed in the hippocampus in adolescence and orbitofrontal cortex during infancy.

Conclusions: This study provides novel insights into the relationship between SCZ and AN by revealing a shared genetic component and offers a window into their complex etiology.

Keywords: GWAS; Mendelian randomization; anorexia; architecture; genetic; nervosa; pleiotropy; polygenic overlap; schizophrenia.


Figures

Fig. 1.
Fig. 1.
Conditional quantile-quantile (Q-Q) plots and Mendelian randomization scatter plots for the associations between schizophrenia (SCZ) and anorexia nervosa (AN). The conditional quantile-quantile plot of nominal vs empirical −log10 p values for SCZ as a function of significant association with AN at P value <.1, P value <.01, and P value <.001 (A), and vice versa (B). The black diagonal line indicates the global null hypothesis. Scatter plots for effects of SCZ and AN for instrumental variants of SCZ (panel C, n = 127), and AN (panel D, n = 18). Lines represent the regression of SNP effects for exposure (SCZ for A and AN for B) on the SNP effects for outcome (AN for A and SCZ for B), corresponding to a meta-analysis using random-effects inverse variance weighted, MR-Egger regression, weighted-mode, and weighted-median methods. Note: MR, Mendelian randomization.
Fig. 2.
Fig. 2.
Polygenic overlap between schizophrenia (SCZ) and anorexia nervosa (AN). (A) The Venn diagram illustrates the estimated number of non-null variants shared between SCZ and AN, and specific to each disorder: numbers in the circle indicate the quantity (standard error) of genetic variants in thousands. The circle on the left represents SCZ, the circle on the right represents AN, and the center part represents overlap. The size of the circle indicates polygenicity, with a larger circle reflecting greater polygenicity. The estimated genetic correlation is also shown below the Venn diagram, with an accompanying directional scale (shading to the right indicates positive correlation). (B) The density plot for additive causal effects that underlie model prediction. (C) The density plot for observed GWAS signed test statistics. (D) The corresponding density plot predicted from the fitted MiXeR model. Trait1 = SCZ; Trait2 = AN. Note: GWAS, genome-wide association study.
Fig. 3.
Fig. 3.
Common genomic loci jointly associated with schizophrenia and anorexia nervosa at conjunctional false discovery rate (conjFDR) <0.05. (A) A Manhattan plot with −log10-transformed conjFDR values for each SNP on the y-axis and chromosomal positions along the x-axis. The dashed horizontal line represents the threshold for significant shared associations. Independent lead SNPs are marked by large dots. The gene nearest to each shared locus is annotated. (B) The distribution of functional consequences with SNPs annotated using ANNOVAR. (C) The distribution of likely regulatory functions annotated using RegulomeDB. (D) The distribution of the minimum chromatin states, annotated based on 15 categorical states, with lower states indicating higher accessibility to regulatory elements.
Fig. 4.
Fig. 4.
Spatiotemporal expression difference between shared genes between schizophrenia and anorexia nervosa and background genes across 16 brain regions and 11 developmental time points. The mean expression difference between 127 genes mapped to shared loci and 52 376 background genes with nonzero expression in the BrainSpan dataset is illustrated in color ranging from red (high expression) to blue (low expression). The gene expression values are log2-transformed, and the differences in transformed expression values are centered and scaled across 16 brain regions at each time point. The color represents the relative differential genetic expression in a brain region among all 16 brain regions at a specific time point. Brain regions are clustered using unsupervised hierarchical cluster analysis. Note: A1C, primary auditory cortex; ACC, anterior cingulate cortex; AMY, amygdala; CBC, cerebellum; DFC, dorsolateral prefrontal cortex; HIP, hippocampus; IPC, inferior parietal cortex; ITC, inferolateral temporal cortex; M1C, primary motor cortex; MD, mediodorsal nucleus of thalamus; MFC, medial prefrontal cortex; mos, months; OFC, orbitofrontal cortex; pcw, postconceptional weeks; S1C, primary somatosensory cortex; STC, superior temporal cortex; STR, striatum; V1C, primary visual cortex; VFC, ventrolateral prefrontal cortex; yrs, years.

Similar articles

Cited by

References

    1. Jauhar S, Johnstone M, McKenna PJ.. Schizophrenia. Lancet. 2022;399(10323):473–486. - PubMed
    1. Costandache GI, Munteanu O, Salaru A, Oroian B, Cozmin M.. An overview of the treatment of eating disorders in adults and adolescents: pharmacology and psychotherapy. Postep Psychiatr Neurol. 2023;32(1):40–48. - PMC - PubMed
    1. Duncan L, Yilmaz Z, Gaspar H, et al. .; Eating Disorders Working Group of the Psychiatric Genomics Consortium. Significant locus and metabolic genetic correlations revealed in genome-wide association study of anorexia nervosa. Am J Psychiatry. 2017;174(9):850–858. - PMC - PubMed
    1. Arcelus J, Mitchell AJ, Wales J, Nielsen S.. Mortality rates in patients with anorexia nervosa and other eating disorders. A meta-analysis of 36 studies. Arch Gen Psychiatry. 2011;68(7):724–731. - PubMed
    1. Treasure J, Duarte TA, Schmidt U.. Eating disorders. Lancet. 2020;395(10227):899–911. - PubMed

MeSH terms