. 2024 Jun 6;187(12):3056-3071.e17.
doi: 10.1016/j.cell.2024.05.004.

Isthmus progenitor cells contribute to homeostatic cellular turnover and support regeneration following intestinal injury

Affiliations

Isthmus progenitor cells contribute to homeostatic cellular turnover and support regeneration following intestinal injury

Ermanno Malagola et al. Cell. .

Abstract

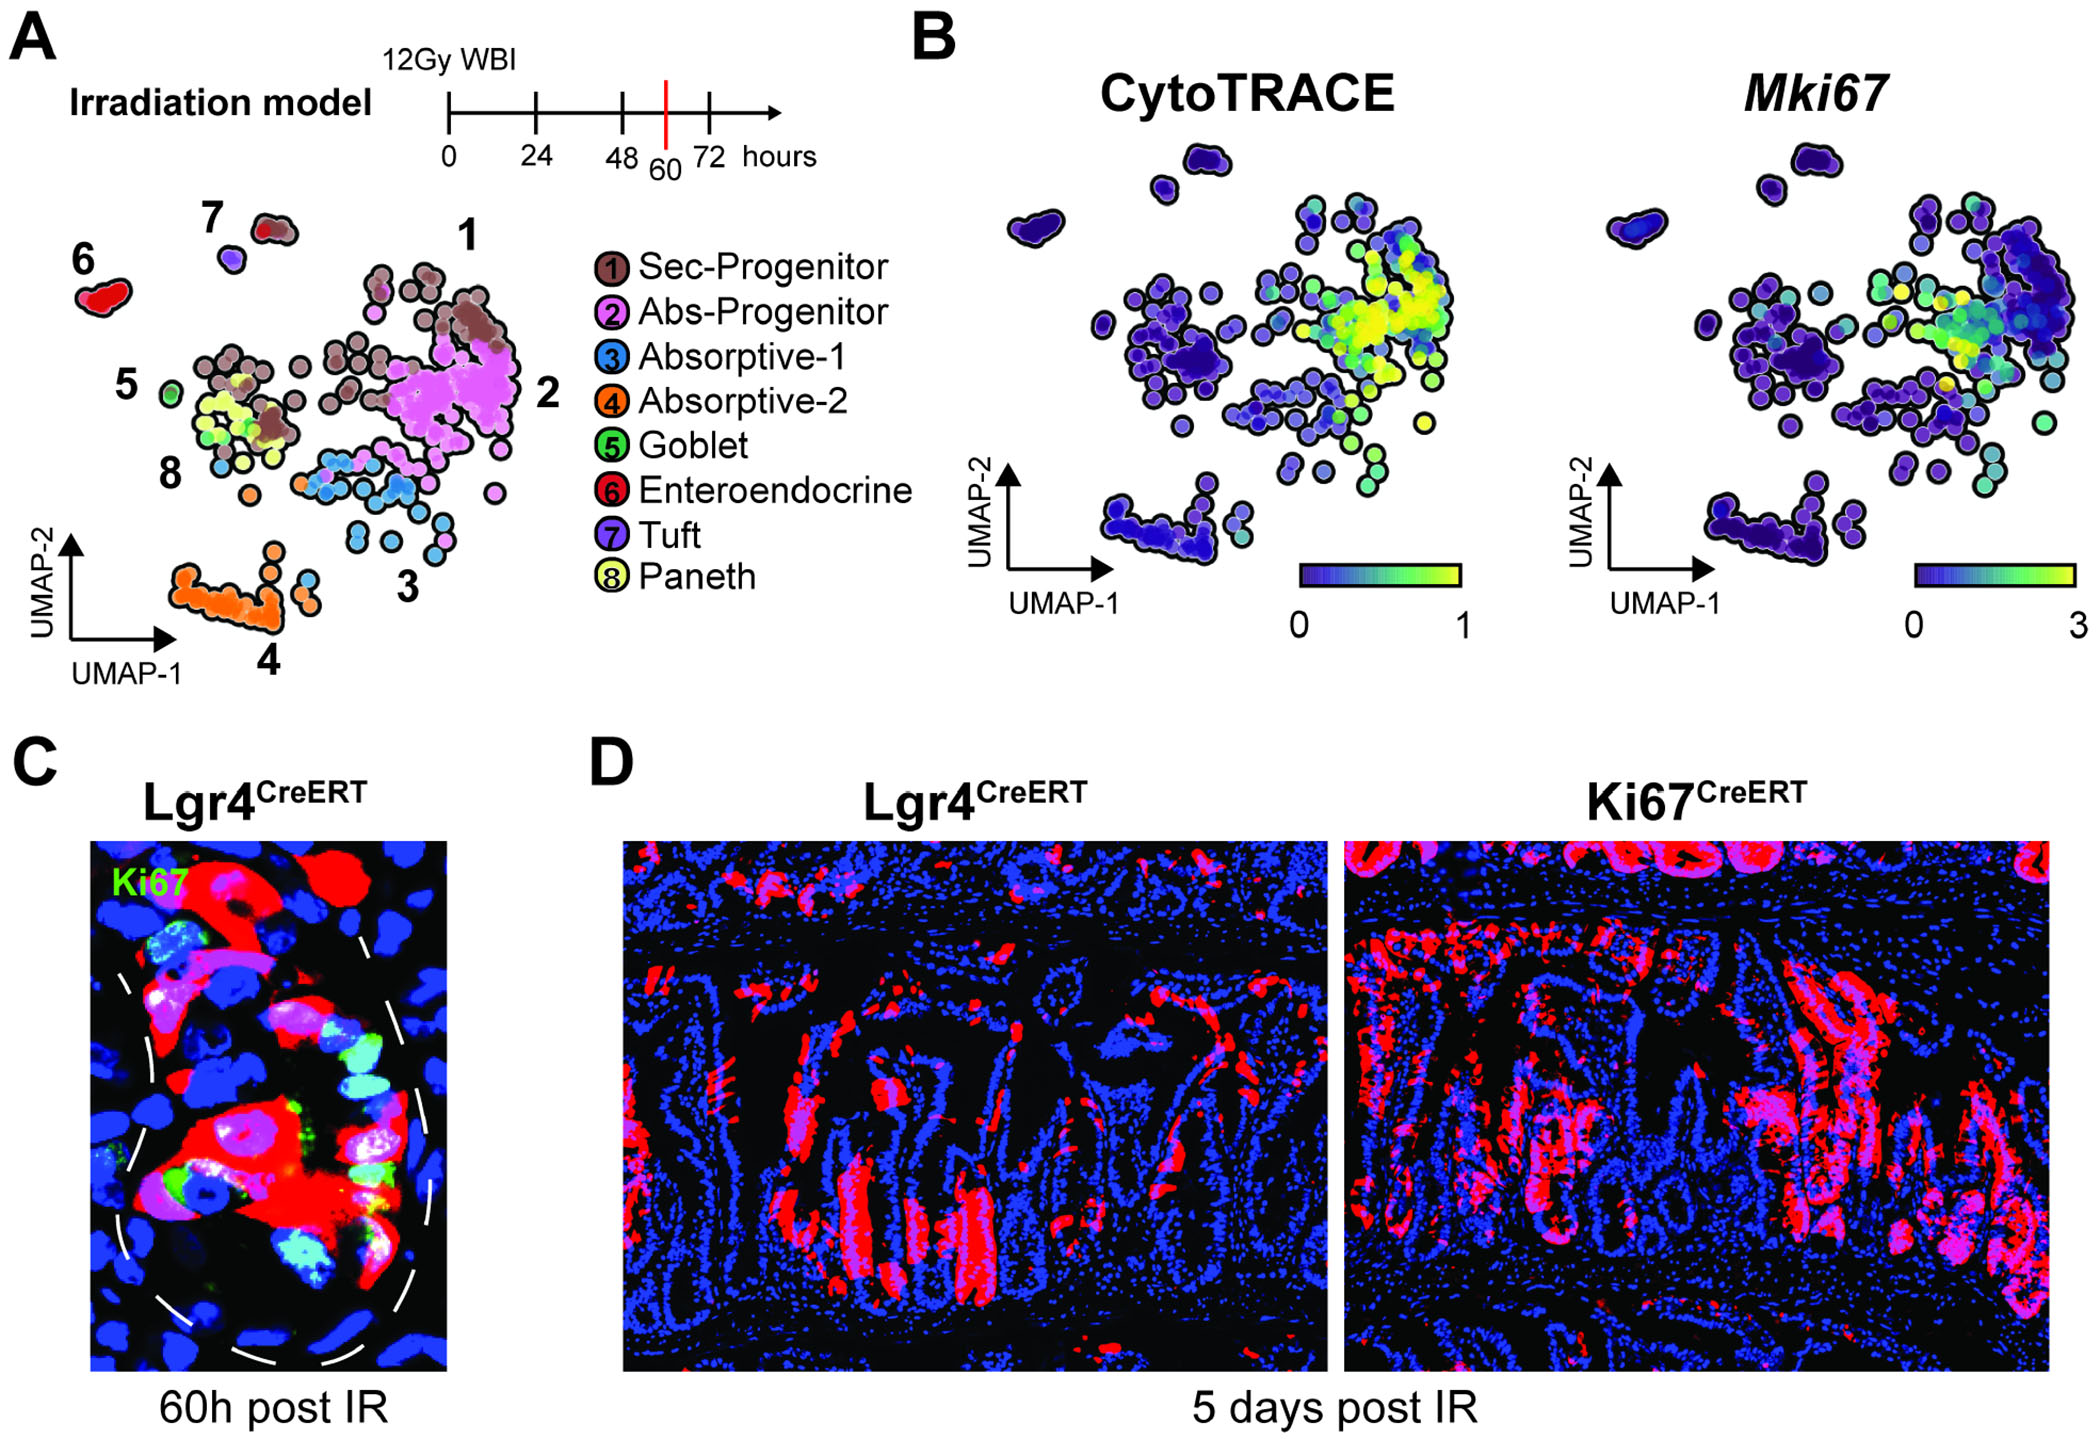
The currently accepted intestinal epithelial cell organization model proposes that Lgr5+ crypt-base columnar (CBC) cells represent the sole intestinal stem cell (ISC) compartment. However, previous studies have indicated that Lgr5+ cells are dispensable for intestinal regeneration, leading to two major hypotheses: one favoring the presence of a quiescent reserve ISC and the other calling for differentiated cell plasticity. To investigate these possibilities, we studied crypt epithelial cells in an unbiased fashion via high-resolution single-cell profiling. These studies, combined with in vivo lineage tracing, show that Lgr5 is not a specific ISC marker and that stemness potential exists beyond the crypt base and resides in the isthmus region, where undifferentiated cells participate in intestinal homeostasis and regeneration following irradiation (IR) injury. Our results provide an alternative model of intestinal epithelial cell organization, suggesting that stemness potential is not restricted to CBC cells, and neither de-differentiation nor reserve ISC are drivers of intestinal regeneration.

Keywords: adult stem cells; cell potency; epithelial stem cells; intestinal stem cells; intestine; plasticity; regeneration; regulatory network analysis; single cell; stemness signature.


Conflict of interest statement

Declaration of interests Dr. A.C. is the founder, equity holder, and consultant of DarwinHealth Inc., a company that has licensed some of the algorithms used in this manuscript from Columbia University. Columbia University is also an equity holder in DarwinHealth Inc.

Figures

Figure 1:
Figure 1:. An unbiased approach to elucidate the organization of intestinal crypt epithelial cells:
A. Schematic representation of the experimental workflow and computational pipeline for the analysis of crypt epithelial cells. (See Methods) B. UMAP plot of CTRL dataset showing protein activity -based clustering solution based on gene regulatory network analysis. C. Heatmap showing top differentially activated regulatory proteins. (Active scores in red) D. Violin- and UMAP plots showing CytoTRACE scores for individual cells in CTRL; black lines indicate median value per cluster. On the UMAP embedding, showing overlay of cell differentiation trajectories as vector fields computed by CellRank on protein activity data. E. Pseudotime analysis using CytoTRACE scores to order cells based on inferred cell potency (high – yellow - to low – blue - potency from left to right), showing protein activity changes of top correlating regulatory proteins. On the bottom, protein activity profile for known transcription factors involved in cellular differentiation. (Active scores in red)
Figure 2:
Figure 2:. Lgr5 expression is not restricted to intestinal stem and progenitor cells:
A. Pseudotime analysis using CytoTRACE scores to order cells based on inferred cell potency (high to low potency from left to right), showing expression levels of Lgr5 on y-axis. Cells are colored based on their cluster. B. Sorting strategy and UMAP plot of CTRL Lgr5DTR-eGFP crypt epithelial cells. (Sorted gate highlighted in Red) C. UMAP plots showing expression of Lgr5Mt and Lgr5DTR-eGFP alleles, below bar-plot showing the number of cells expressing each allele in the dataset (as % of total cells). D. Bar-plot and gating strategy for flow cytometry –based quantification of Lgr5-eGFP+ cells in purified crypts (n=30); together with representative image of immunofluorescence staining for Lgr5-eGFP in mouse jejunum. Data are represented as mean ± SD. E. Scatter plot of inferred cell potency (CytoTRACE) on y-axis and Normalized Enrichment Scores (NES) of Secretory lineage Master Regulator (MR) proteins on x-axis. Cells are colored based on Lgr5 expression. F. Immunofluorescence staining for Dclk1 and bar-plot showing quantification of double positive cells (Dclk1+Lgr5-eGFP+ over total Dclk1+). G. Representative image of low power magnification view of Dclk1 (Red) and Lgr5-eGFP (green) in intestinal jejunum of a Lgr5DTR-eGFP mouse. H. Sorting strategy for the isolation of Dclk1ZsGreen+ cells (Red gate). I. Bar-plots showing expression levels of Dclk1, Lgr5, and Ascl2 in sorted Dclk1ZsGreen+ cells. (Expression presented as fold induction relative to the negative population). Data are represented as mean ± SD (n=5).
Figure 3:
Figure 3:. Stemness potential exists beyond Lgr5+ cells:
A. Representative images for immunostaining of Atad2, Birc5, and Stmn1. On the right, bar-plots showing position based counting of selected markers labelling distribution within the crypt epithelium. Data are represented as mean ± SD (n=3). B. Representative scatter-plot for flow cytometry –based cells sorting (Ki67RFP;Lgr5DTReGFP). On the right, bar-plot showing number of organoids generated from the isolated fractions (5000 cells/dome). Data are represented as mean ± SD. C. Representative image of Ki67 staining combined with lineage tracing in Lgr4CreERT and Dll1CreERT mice (24h post TAM). Note that Lgr4CreERT traced cells are in green (ZsGreen) with Ki67 staining in red, whereas Dll1CreERT traced cells are in red (tdTomato) with Ki67 staining in green. On the right, bar-plot showing quantification of % of Ki67+/labelled+ cells. Data are represented as mean ± SD (n=3). D. Representative images of Lgr4CreERT and Dll1CreERT –derived labelling at day 1 (left) and 1 month (Dll1CreERT) or 6 months (Lgr4CreERT) months post TAM induction (right). E. Bar-plot showing quantification of the number of organoids generated from each sorted population (5000 cells/dome). Data are represented as mean ± SD. F. Flow cytometry analysis of overlap between Lgr4CreERT labelled cells (24h post TAM) and Lgr5eGFP+ cells; together with bar plots showing expression levels of Lgr5 (n=4) and organoids forming capacity (n=6) for individual sorted cell populations, groups labelled in the panel. Data are represented as mean ± SD. G. Flow cytometry analysis of overlap between Ki67CreERT labelled cells (24h post TAM) and Lgr5eGFP+ cells; together with bar plots showing expression levels of Lgr5 (n=3) and organoids forming capacity (n=6) for individual sorted cell populations, groups labelled in the panel. Data are represented as mean ± SD. Statistical method: Unpaired t-test, two-tailed; *: p<0.05,
Figure 4:
Figure 4:. Isthmus proliferating cells can participate in homeostatic cellular turnover:
A-B. Bar-plots showing quantification of traced cells in Lgr4CreERT (A) and Ki67CreERT (B) mice based on cell position within the crypt. Red dotted line used to mark the boundary between CBC and isthmus cells. Data are represented as mean ± SD (n=3). C. Bar-plots showing percentage of crypt-units with at least one labelled CBC cell in Lgr4CreERT and Ki67CreERT mice at indicated time points. Data are represented as mean ± SD (n=3) D. Bar-plots showing quantification of EdU-labelled cells based on cell position at the indicated time points. Red dotted line used to mark the boundary between CBC and isthmus cells. Data are represented as mean ± SD (n=3). E. Bar-plot showing average number of EdU labelled-CBC cells at indicated time points. Data are represented as mean ± SD. F. Representative images of EdU staining in the mouse intestine. Below, enlargement of the highlighted region to show absence/presence of CBC labelling. G. (Left) Schematic representation of the intestinal crypts, cells are colored based on inferred cell potency. Highest stemness potential is found in the isthmus region (e.g. Lgr5low cells). (Right) Schematic representation of intestinal crypts, isthmus cells, colored in blue, have the capacity to migrate downward and give rise to Lgr5+ CBCs during homeostasis. Statistical method: Unpaired t-test, two-tailed; *: p<0.05, **: p<0.01, ***: p<0.001, ****: p<0.0001.
Figure 5:
Figure 5:. Lgr5neg proliferating cells compensate for loss of Lgr5 expressing cells:
A. Schematic representation of DT based ablation model. B. On the left, representative dot-plot of gating strategy adopted for analysis of crypt epithelial cells in CTRL or DT ablated mice (sorted gate in red). On the right, bar-plot showing flow cytometry quantification of Lgr5DTReGFP+ cells in control and DT treated crypts. Data are represented as mean ± SD (n≥10). C. UMAP and violin plots showing clustering distribution and CytoTRACE scores in DT treated epithelial cells. D. Schematic representation of the model of study together with representative scatter plots for flow-cytometry -based analysis of lineage tracing (Lgr4CreERT). On the right, representative images for Lgr4CreERT;Lgr5DTReGFP mice lineage tracing upon concurrent DT treatment, together with bar-plots showing quantification of double positive (tdTomato+/Lgr5DTReGFP+) cells and single total tdTomato+ cells at the indicated time points (Lgr4CreERT). Data are represented as mean ± SD (n≥4) E. Flow-cytometry analysis of Ki67CreERT;Lgr5DTReGFP lineage tracing following DT treatment, bar-plots show percentage of double positive (eGFP+/tdTomato+) and total tdTomato+ cells at indicated time-points (Ki67CreERT). Data are represented as mean ± SD (n≥3). F. Representative images of Dll1creERT mice 10 days post TAM induction with or without DT treatment. G. Bar plot showing flow-cytometry based quantification of (Dll1CreERT) tdTomato+ cells at indicated time points. Data are represented as mean ± SD (n≥3). H. Schematic representation of the model proposed, on the left layout of intestinal crypts 3 days post DT treatment, at day 10 (on the right) cells turn back to homeostatic organization. Isthmus cells (blue) expand following loss of Lgr5+ cells, supporting normal tissue turnover. On the other hand, differentiated cells retain low cell potency and do not serve as facultative stem cells. Data are represented as mean ± SD. Statistical method: Unpaired t-test, two-tailed; *: p<0.05, **: p<0.01, ***: p<0.01, ****: p<0.01.
Figure 6:
Figure 6:. Surviving isthmus progenitor cells regenerate the intestinal epithelium following IR damage:
A. Schematic representation of irradiation damage model, together with UMAP plot showing protein activity-based clustering solution for irradiated crypt epithelial cells analyzed 60 hours post IR exposure. B. UMAP plots showing both inferred cell potency through CytoTRACE and Mki67 expression in irradiated crypt epithelial cells. C. Representative image for Ki67 staining 60h post IR, in red tdTomato labelling derived from lineage tracing of Lgr4CreERT. D. Representative images of Lgr4CreERT and Ki67CreERT linage tracing 5 days post IR.
Figure 7:
Figure 7:. Characterization of surviving regenerating cells following IR damage:
A. Volcano plot of differentially expressed genes in regenerating (positive LogFC) vs homeostatic ISC (negative LogFC). B. Signature of differentially activated regulatory proteins in ISC resulting from exposure to IR damage. Proteins are ranked (left to right) based on computed protein activity score (NES, normalized enrichment score). C. Schematic representation of the model proposed of surviving intestinal cells after IR exposure. Surviving pre-existing stem and progenitors expand and drive tissue repair while differentiated cells are unable to serve as regenerating ISCs.

References

    1. Sangiorgi E, and Capecchi MR (2008). Bmi1 is expressed in vivo in intestinal stem cells. Nat Genet 40, 915–920. 10.1038/ng.165. - DOI - PMC - PubMed
    1. Montgomery RK, Carlone DL, Richmond CA, Farilla L, Kranendonk ME, Henderson DE, Baffour-Awuah NY, Ambruzs DM, Fogli LK, Algra S, and Breault DT (2011). Mouse telomerase reverse transcriptase (mTert) expression marks slowly cycling intestinal stem cells. Proc Natl Acad Sci U S A 108, 179–184. 10.1073/pnas.1013004108. - DOI - PMC - PubMed
    1. Takeda N, Jain R, LeBoeuf MR, Wang Q, Lu MM, and Epstein JA (2011). Interconversion between intestinal stem cell populations in distinct niches. Science 334, 1420–1424. 10.1126/science.1213214. - DOI - PMC - PubMed
    1. Powell AE, Wang Y, Li Y, Poulin EJ, Means AL, Washington MK, Higginbotham JN, Juchheim A, Prasad N, Levy SE, et al. (2012). The pan-ErbB negative regulator Lrig1 is an intestinal stem cell marker that functions as a tumor suppressor. Cell 149, 146–158. 10.1016/j.cell.2012.02.042. - DOI - PMC - PubMed
    1. Asfaha S, Hayakawa Y, Muley A, Stokes S, Graham TA, Ericksen RE, Westphalen CB, von Burstin J, Mastracci TL, Worthley DL, et al. (2015). Krt19(+)/Lgr5(−) Cells Are Radioresistant Cancer-Initiating Stem Cells in the Colon and Intestine. Cell Stem Cell 16, 627–638. 10.1016/j.stem.2015.04.013. - DOI - PMC - PubMed

Substances

LinkOut - more resources