. 2024 Aug 1:596:217009.
doi: 10.1016/j.canlet.2024.217009. Epub 2024 Jun 5.

BIGH3 mediates apoptosis and gap junction failure in osteocytes during renal cell carcinoma bone metastasis progression

Affiliations

BIGH3 mediates apoptosis and gap junction failure in osteocytes during renal cell carcinoma bone metastasis progression

Tianhong Pan et al. Cancer Lett. .

Abstract

Renal cell carcinoma (RCC) bone metastatis progression is driven by crosstalk between tumor cells and the bone microenvironment, which includes osteoblasts, osteoclasts, and osteocytes. RCC bone metastases (RCCBM) are predominantly osteolytic and resistant to antiresorptive therapy. The molecular mechanisms underlying pathologic osteolysis and disruption of bone homeostasis remain incompletely understood. We previously reported that BIGH3/TGFBI (transforming growth factor-beta-induced protein ig-h3, shortened to BIGH3 henceforth) secreted by colonizing RCC cells drives osteolysis by inhibiting osteoblast differentiation, impairing healing of osteolytic lesions, which is reversible with osteoanabolic agents. Here, we report that BIGH3 induces osteocyte apoptosis in both human RCCBM tissue specimens and in a preclinical mouse model. We also demonstrate that BIGH3 reduces Cx43 expression, blocking gap junction (GJ) function and osteocyte network communication. BIGH3-mediated GJ inhibition is blocked by the lysosomal inhibitor hydroxychloroquine (HCQ), but not osteoanabolic agents. Our results broaden the understanding of pathologic osteolysis in RCCBM and indicate that targeting the BIGH3 mechanism could be a combinational strategy for the treatment of RCCBM-induced bone disease that overcomes the limited efficacy of antiresorptives that target osteoclasts.

Keywords: Apoptosis; BIGH3/TGFBI; Bone metastasis; Osteocyte; Renal cell carcinoma.


Conflict of interest statement

Declaration of competing interest The authors declare that they have no known competing financial interests or personal relationships that could have appeared to influence the work reported in this paper.

Figures

Fig. 1.
Fig. 1.
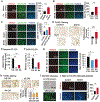
Osteocyte apoptosis in RCCBM in vivo. (A) Top proteins in the condition medium of bone metastasized 786-RCC tumor cells as determined by tandem mass spectrometry analysis (left). Bo-786 RCC cells secret BIGH3, inhibiting osteoblasts differentiation. (B) TUNEL staining of histological sections from human specimens of RCCBM, breast cancer bone metastasis (BCaBM), and lung cancer bone metastasis (LCaBM). Sections of “Adjacent bone” were from adjacent non-metastasis site of RCCBM. Sections were counterstained with methyl green (green). Representative images show examples of living (blue arrows) and TUNEL-positive apoptotic osteocytes (brown, indicated by red arrows). The number of TUNEL (+) cells were calculated over the sum of viable osteocytes, apoptotic osteocytes, and empty lacunae, expressed as “% of total.” Data were the mean ± SE. *: p < 0.05. (C) Silver nitrate staining of histological sections from human RCCBM specimens. The adjacent non-metastasis site (no tumor area) was used as the control. (D) The growth of Bo-786 RCC tumor cells in bone over 4 weeks was monitored by BLI, and total flux values were used for BLI quantification. (E) Representative images of micro-CT on mouse femurs from RCCBM mouse model. The contralateral left femurs without Bo-786 RCC cell injection were used as normal control. Bone mineral density (BMD) was quantified using Microview software. Data were the mean ± SE. *: p < 0.05. (F) TUNEL staining and (G) Silver nitrate staining of histological sections of mouse femurs from RCCBM mouse model and its contralateral non-tumor injected control. The number of TUNEL (+) osteocytes (Ocy) was quantified and expressed as “% of total” as described above. Blue arrow: normal osteocytes; red arrow: TUNEL (+) osteocytes. Data were the mean ± SE. *: p < 0.05.
Fig. 2.
Fig. 2.
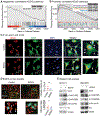
BIGH3 induces osteocyte apoptosis in vitro. MLO-Y4 osteocytes were (A) co-cultured with Bo-786 RCC cells, (B) treated with Bo-786 CM, and (C) treated with BIGH3 at 2 μg/mL and 4 μg/mL, for 48 h followed by a live/dead assay. Calcein-AM for live cells (green); ethidium homodimer-1 for dead cells (red); and Hoechst for nuclei (blue). The number of cells was quantified using Image J. The number of dead cells (red) was adjusted by total number (blue), and then the number of dead cells was expressed as a “%of Control.” *: P < 0.05; **: P < 0.01; ***: P < 0.001. (D) MLO-Y4 cells were treated with BIGH3 (2 μg/mL) for 48 h followed by TUNEL staining. Treatment of cells with vehicle PBS was used as control. The number of TUNEL-positive cells was determined using IHC profiler plugin for Image J and expressed as “% of area.” (E) mRNA levels for BIGH3 relative to the housekeeping gene β-actin were determined in Bo-786 RCC cells with or without knockdown of BIGH3 by Real-time RT-PCR. Bars are mean ± SD of triplicate determinations. (F) BIGH3 protein levels in BIGH3 knockdown Bo-786 RCC cells were determined by enzyme-linked immunosorbent assay #3: 786-shBG clones #3; #4: 786-shBG clones #4; NS: Bo-786 RCC cells transfected with non-silencing shRNA. MLO-Y4 cells were treated with CM from BIGH3-knockdown cell lines (#3 CM, #4 CM) and non-silencing control cells (NS CM) for 24 h followed by live/dead assay (G) or by TUNEL staining (H). The number of dead cells and the number of TUNEL-positive cells were determined as described above *: P < 0.05; **P < 0.01. (I) Cell morphology images of IDG-SW3 osteocytes (upper panel). Fluorescent imaging for positive GFP-expressing cells after differentiation (lower panel). (J) Differentiated IDG-SW3 osteocytes were treated BIGH3 at 2 μg/mL for 24 h, followed by a live/dead assay. The number of dead cells (red) was adjusted by total number (blue), and the number of dead cells was expressed as a “% of Control.” **: P < 0.01.
Fig. 3.
Fig. 3.
BIGH3 reduces Cx43 expression. (A) An RNAseq analysis of differentially expressed genes. Red dots: upregulated genes; blue dots: downregulated genes. (B) western blot analyses of Cx43 protein in MLO-Y4 and IDG-SW3 osteocytes treated with Bo-786CM and/or BIGH3 (2 μg/mL) for 15 min and 24 h, respectively. MLO-Y4 osteocytes were treated with BIGH3 (2 μg/mL) for 24 h followed by (C) IHC of anti-Cx43 antibody and (D) IF of anti-Cx43 antibody. The number of Cx43-positive cells was determined using IHC profiler plugin for Image J and expressed as “% of Area” (C). The green dots, as indicated by the white arrow, represent Cx43 expression (D). (E) MLO-Y4 cells transfected with Cxn-43 siRNA by three different clones: #49, #94, and #96. Transfection of cells with control siRNA was used as control. The knockdown of Cx43 was determined by Western blot assay 72 h after transfection (Lower panel). A live/dead assay was conducted on a parallel set of cells 72 h after Cxn-43 siRNA transfection and the number of cell death was quantified as described in Fig. 2 and was expressed as “% of total”. (F) Seventy-2 h after Cxn-43 siRNA transfection, cells were treated with BIGH3 (4 μg/mL) for additional 24 h followed by live/dead assay. Cells treated with PBS were used as vehicle control. The number of cells death was quantified as described in Fig. 2 and expressed as “% of Control”. (G) IHC of anti-Cx43 on human specimens from RCCBM and (H) IHC of anti-Cx43 on mouse femurs from the RCCBM mouse model. The number of Cx43-positive cells (brown) and total osteocytes, including empty lacunae were counted and the number of Cx43(+) cells were calculated and expressed as “% of total”. Data were the mean ± SE. **: p < 0.01.
Fig. 4.
Fig. 4.
Effects of BIGH3 on GJ. RNASeq analysis on BIGH3-treated MLOY4 cells showed (A) downregulation of the gap junction (GJ) (P < 0.05) and (B) upregulation of the phagosome and apoptosis-related pathways (P < 0.05). (C) Double immunofluorescent staining of Lamp1 and Cx43 on BIGH3-treated MLOY4 cells. Red: Lamp1; green: Cx43; blue: DAPI. (D) Effects of BIGH3 on dye transfer between MLO-Y4 cells. Green: Donor cells (MLOY4/calcein); red: receiver cells (MLOY4/LT); orange: receiver cells gained dyes from donor cells. The diffusion ratio and the number of orange cells were used to express dye transfer ability. Data were the mean ± SE. *: P < 0.05; **: P < 0.01. (E) MLO-Y4 cells or differentiated IDG-SW3 cells were treated with BIGH3 (2 μg/mL) for 24 h followed by Western blot assay.
Fig. 5.
Fig. 5.
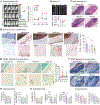
Effects of HCQ on BIGH3-mediated Cx43 reduction and death of osteocyte. (A) MLO-Y4 cells were treated with lysosomal inhibitor NH4Cl (1.5 mM) or HCQ (100 μM) with/without BIGH3 (2 μg/mL). Cx43 protein levels were determined by Western blot assay. Image J was used for quantification of CX43 intensity. (B) MLO-Y4 cells were pre-treated with HCQ (100 nM) with or without BIGH3 (2 μg/mL) for 24 h followed by live/dead assay. The number of cells was quantified using Image J as described in Fig. 2 and expressed as a “% of Total”. *: P < 0.05. (C) Parachute dye transfer assay. Receiving MLOY4/LT cells (Red) were pretreated with HCQ (100 nM) or vehicle for 2 h followed by BIGH3 (2 μg/mL) treatment for 15 min. Then MLO-Y4/calcein donor cells (Green) were added into receiving cells-containing dish via parachuting way at a ratio of 1:500 (donor to receiver). Two hours later, images were taken under fluorescent microscope. The number of receiver cells gained dyes from donor cells (orange cell) was visually determined and normalized to that of control cultures. The diffusion ratio and the number of orange cells were used to express dye transfer ability. *: P < 0.05.
Fig. 6.
Fig. 6.
Effects of HCQ on the RCCBM mouse model in vivo. (A) SCID mice were intra-femoral injected with Bo-786 RCC cells followed by oral administration of mice with HCQ (30 mg/kg body weight) or CBZ (20 mg/kg body weight) once a day, 5 days a week. Mice oral administrated with PBS were used as vehicle control. The growth of Bo-786 RCC tumor cells in bone was monitored by BLI. Total flux values were used for BLI quantification. *: p < 0.05; **: P < 0.01 as compared to week1. (B) Representative images of high-resolution micro-CT scans of femurs from mice of various groups (*Upper panel). N: non-786 RCC injected femur; V: vehicle control group; H: HCQ group; C: CBZ group. Quantification of bone mineral density (BMD) was shown in lower panel. ***: p < 0.001. (C) Histological H&E staining of femurs with the arrows for tumor area. (D) IHC of anti-Cx43 antibody on paraffin-embedded femur sections. The number of Cx43-positive cells (brown) and total osteocytes, including empty lacunae were counted and the number of Cx43(+) cells were expressed as “% of total”. The arrows show the Cx43 (+) osteocytes. Data were the mean ± SE. *: p < 0.05; **: P < 0.01. (E) Representative images of TUNEL staining of histological sections of mouse femurs from each group. The number of TUNEL (+) osteocytes (Ocy) was quantified and was calculated over the sum of viable osteocytes, apoptotic osteocytes and empty lacunae, expressed as “% of total”. Data were the mean ± SE. **: p < 0.01. Red arrow: TUNEL (+) osteocyte. (F) Representative images of TRAP-stained bone sections of each group. The red areas as indicated by the yellow arrows are the TRAP (+) osteoclasts. Histo-morphometric analysis of (G) osteocytes (Ocy), (H) osteoblasts (Ob), and (I) osteoclasts (Oc). *: p < 0.05.
Fig. 7.
Fig. 7.
BIGH3 from RCCBM tumor cells contributes to osteolysis. RCCBM causes osteolytic bone lesion via activated osteoclasts. RCCBM tumor cells secrete elevated levels of BIGH3. BIGH3 inhibits osteoblast differentiation, impairing the reparative response to osteoclasts-mediated bone resorption. BIGH3 reduces Cx43 expression and increases osteocytes apoptosis, aggravating bone osteolysis from RCCBM. HCQ inhibits RCC tumor cell growth and reverses BIGH3-mediated reduction of Cx43 and the increase of apoptosis in osteocytes. Along with the established characteristics of CBZ on activation of osteoblasts and inhibition of RCC tumor cells, the combination of CBZ with HCQ is anticipated to synergistically interrupt osteolytic vicious cycles in RCCBM, which may overcome the limited efficacy of antiresorptives that only target osteoclasts such as denosumab and bisphosphonate.

References

    1. Riquelme MA, Cardenas ER, Jiang JX, Osteocytes and bone metastasis, Front. Endocrinol 11 (2020) 567844. - PMC - PubMed
    1. Wood SL, Brown JE, Skeletal metastasis in renal cell carcinoma: current and future management options, Cancer Treat Rev. 38 (2012) 284–291. - PubMed
    1. McKay RR, Lin X, Perkins JJ, Heng DY, Simantov R, Choueiri TK, Prognostic significance of bone metastases and bisphosphonate therapy in patients with renal cell carcinoma, Eur. Urol 66 (2014) 502–509. - PMC - PubMed
    1. Pan T, Lin SC, Yu KJ, Yu G, Song JH, Lewis VO, Bird JE, Moon B, Lin PP, Tannir NM, Jonasch E, Wood CG, Gallick GE, Yu-Lee LY, Lin SH, Satcher RL, BIGH3 promotes osteolytic lesions in renal cell carcinoma bone metastasis by inhibiting osteoblast differentiation, Neoplasia 20 (2018) 32–43. - PMC - PubMed
    1. Skonier J, Bennett K, Rothwell V, Kosowski S, Plowman G, Wallace P, Edelhoff S, Disteche C, Neubauer M, Marquardt H, et al., Beta ig-h3: a transforming growth factor-beta-responsive gene encoding a secreted protein that inhibits cell attachment in vitro and suppresses the growth of CHO cells in nude mice, DNA Cell Biol. 13 (1994) 571–584. - PubMed

MeSH terms