. 2024 Jun 7;15(1):4872.
doi: 10.1038/s41467-024-48839-4.

Evolution of connectivity architecture in the Drosophila mushroom body

Affiliations

Evolution of connectivity architecture in the Drosophila mushroom body

Kaitlyn Elizabeth Ellis et al. Nat Commun. .

Abstract

Brain evolution has primarily been studied at the macroscopic level by comparing the relative size of homologous brain centers between species. How neuronal circuits change at the cellular level over evolutionary time remains largely unanswered. Here, using a phylogenetically informed framework, we compare the olfactory circuits of three closely related Drosophila species that differ in their chemical ecology: the generalists Drosophila melanogaster and Drosophila simulans and Drosophila sechellia that specializes on ripe noni fruit. We examine a central part of the olfactory circuit that, to our knowledge, has not been investigated in these species-the connections between projection neurons and the Kenyon cells of the mushroom body-and identify species-specific connectivity patterns. We found that neurons encoding food odors connect more frequently with Kenyon cells, giving rise to species-specific biases in connectivity. These species-specific connectivity differences reflect two distinct neuronal phenotypes: in the number of projection neurons or in the number of presynaptic boutons formed by individual projection neurons. Finally, behavioral analyses suggest that such increased connectivity enhances learning performance in an associative task. Our study shows how fine-grained aspects of connectivity architecture in an associative brain center can change during evolution to reflect the chemical ecology of a species.


Conflict of interest statement

The authors declare no competing interests.

Figures
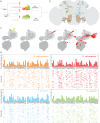
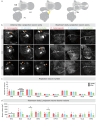
Fig. 1
Fig. 1. Mapping Kenyon cell inputs in Drosophila species living in different ecological niches.
a Schematic depicting the phylogenetic relationships of D. melanogaster (red), D. simulans (blue), and D. sechellia (green) on the left and their ecological relationships on the right. b Schematic depicting the Drosophila olfactory circuit: olfactory sensory neurons that express the same receptor gene(s) (OSNs, green and blue neurons with dotted outline) converge onto the same glomerulus in the antennal lobe (AL); projection neurons (PNs, green and blue neurons with full outline) connect individual glomeruli to the mushroom body (MB) and the lateral horn (LH); Kenyon cells (dark gray) receive input from a small number of projection neurons. c Simplified schematic depicting the technique used to map connections between projection neurons and Kenyon cells: a Kenyon cell is photo-labeled (white) and the projection neurons connected to each of its claw are dye-labeled (red) such that the antennal lobe glomeruli innervated by the labeled projection neurons can be identified; see Supplementary Fig. 3 for a more detailed description of the technique. d Connections between glomeruli and Kenyon cells were mapped in D. melanogaster, D. simulans and D. sechellia, and all connections are reported in four connectivity matrices (D. melanogaster males: top left panel and orange (687 connections); D. melanogaster females: top right panel and red (704 connections); D. simulans females: bottom left panel and blue (717 connections); D. sechellia females: bottom right panel and green (692 connections)). In each matrix, a row corresponds to a Kenyon cell—there are 200 Kenyon cells per matrix—and each column corresponds to the different antennal lobe glomeruli; each colored bar indicates the input connections of a given Kenyon cell, and the intensity of the color denotes the number of connections found between a particular Kenyon cell and a given glomerulus (light: one connection; medium: two connections; dark: three connections). The bar graphs above the matrices represent the frequencies at which a particular glomerulus was connected to Kenyon cells as measured in a given matrix. All source data used in this figure are provided in the Source Data file.
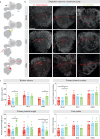
Fig. 2
Fig. 2. Shifts in connectivity biases across Drosophila species.
a, b Principal components were extracted using each connectivity matrix as well as 1000 uniform shuffle (a) or 1000 biased shuffle matrices (b); the fraction of the variance explained by each component was measured (D. melanogaster males: orange; D. melanogaster females: red; D. simulans females: blue; D. sechellia females: green; colors: experimental matrices, gray: shuffle matrices); error bars represent 95% confidence interval. c The Jensen-Shannon distances were measured by comparing the distributions in connectivity frequencies observed experimentally; the color bar denotes the length of the distances measured. See Supplementary Fig. 5 for the complete set of Jensen–Shannon distances. d, e For each glomerulus, the connectivity frequency measured in the D. sechellia matrix was compared to the average connectivity frequency obtained in a set of biased shuffle matrices generated using the generalist matrices, and the probability that a glomerulus being connected to Kenyon cells at a higher (d) or lower (e) frequency in the D. sechellia matrix was measured (p-value); glomeruli were ranked based on p-values and the DL2d, DP1l, DC3 and VM5v projection neurons were further investigated (red). f The p-value measured for each glomerulus was plotted against the log2 fold change measured when comparing the connectivity frequencies measured for that glomerulus in the two matrices indicated on the plot. The statistical significance, or p-value, was measured for each glomerulus using the Fisher’s exact test; to control for false positives, p-values were adjusted with a false discovery rate of 0.10 using a Benjamini-Hochberg procedure. Within these plots, a fold change with a value of 0 indicates that there is no shift in frequencies between matrices, whereas a fold change that is smaller or greater than 0 indicates that a given glomerulus is connected more frequently in one matrix than the other. Data points with p-values smaller than 0.01 are identified with a label (red); all other data points have p-values greater than 0.01 (black). g A clustering dendrogram based on the connectivity frequencies measured for each glomerulus across species. All source data used in this figure are provided in the Source Data file.
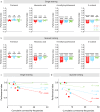
Fig. 3
Fig. 3. Morphological features of the projection neurons innervating a given glomerulus in different Drosophila species.
a Schematic depicting the technique used to photo-label the projection neurons innervating a given glomerulus: a glomerulus is used as a landmark for photo-labeling (blue dashed outline), and the projection neurons connected to the targeted glomerulus are photo-labeled after successive rounds of photo-labeling. b The projection neurons innervating the DL2d (upper panels), DC3 (middle panels) and VM5v (lower panels) glomeruli were photo-labeled in D. melanogaster (left column of each panel), D. simulans (middle column of each panel) and D. sechellia (right column of each panel); the cell bodies of these neurons (left panels) and the axonal termini that these neurons extend in the mushroom body (right panels) were imaged. Scale bar is 50 µm. c, d The number of photo-labeled neurons (c) and the volume of the presynaptic boutons these neurons form in the mushroom body (d) were quantified and compared across species (red: D. melanogaster; blue: D. simulans; green: D. sechellia). The statistical significance, or p-value, was measured using the Mann–Whitney U test (*p-value < 0.5, **p-value < 0.01, ***p-value < 0.001; n = 5, standard deviation from mean is shown). See Table 1 for quantifications. All source data used in this figure are provided in the Source Data file.
Fig. 4
Fig. 4. Morphological features of individual projection neurons in different Drosophila species.
a Schematic depicting the technique used to dye-label a projection neuron innervating a given glomerulus: a glomerulus is used as a landmark for a first round of photo-labeling (blue dashed outline) during which the projection neurons connected to the targeted glomerulus are lightly photo-labeled; dye is electroporated in one of the photo-labeled projection neurons such that a single projection neuron is dye-labeled. b A projection neuron innervating the DL2d (upper row), DC3 (middle row) and VM5v (lower row) glomeruli were dye-labeled in D. melanogaster (left column), D. simulans (middle column) and D. sechellia (right column); the axonal termini these neurons extend in the mushroom body were imaged. Scale bar is 50 µm. c Various morphological features displayed by projection neurons in the mushroom body were quantified and compared across species (red: D. melanogaster; blue: D. simulans; green: D. sechellia). The statistical significance, or p-value, was measured using the Mann–Whitney U test (*p-value < 0.5, **p-value < 0.01, ***p-value < 0.001; n = 5, standard deviation from mean is shown). See Supplementary Table 1 for quantifications. All source data used in this figure are provided in the Source Data file.
Fig. 5
Fig. 5. Learning abilities differ across species.
a, b Flies (D. melanogaster: red; D. simulans: blue; D. sechellia: green) were trained to associate an odor (farnesol: circles, hexanoic acid: triangles, 4-methylcyclohexanol: squares or 3-octanol: stars) or its solvent (mineral oil) with punitive electric shocks using a single regimen of shocks (a) or six regimens of shocks (b) and learning was measured as a Performance Index; the Performance Indices obtained for the odor-pairing and the reciprocal pairing was averaged. See Supplementary Fig. 9 for individual Performance Indices. The statistical significance, or p-value, was measured using the sample t test using 0 as the hypothetical mean (*p-value < 0.5, **p-value < 0.01, ***p-value < 0.001, ****p-value < 0.0001; n ≥ 7, standard deviation from mean is shown). (c, d) The Performance Indices obtained for a given odor in a particular species (farnesol: circles, hexanoic acid: triangles, 4-methylcyclohexanol: squares or 3-octanol: stars) were plotted against the cumulative frequencies of the glomeruli known to be activated by a particular odor (based on a previous study; Supplementary Table 2); the R2 values obtained for each regression line are shown. All source data used in this figure are provided in the Source Data file.

Update of

References

    1. Striedter, G. F. & Northcutt, R. G. Brains Through Time (Oxford University Press, 2019). 10.1093/oso/9780195125689.001.0001https://www.hup.harvard.edu/books/9780674046337.
    1. Striedter, G. F. Principles of Brain Evolution. Principles of brain evolution (Sinauer Associates, Sunderland, 2005).
    1. Strausfeld. Arthropod Brains (2011).
    1. Tosches MA. From cell types to an integrated understanding of brain evolution: the case of the cerebral cortex. Annu.Rev. Cell Dev. Biol. 2021;37:495–517. doi: 10.1146/annurev-cellbio-120319-112654. - DOI - PubMed
    1. Roberts RJV, Pop S, Prieto-Godino LL. Evolution of central neural circuits: state of the art and perspectives. Nat. Rev. Neurosci. 2022;23:725–743. doi: 10.1038/s41583-022-00644-y. - DOI - PubMed

MeSH terms

LinkOut - more resources