. 2024 Jun 7;15(1):4893.
doi: 10.1038/s41467-024-49196-y.

Multiomic ALS signatures highlight subclusters and sex differences suggesting the MAPK pathway as therapeutic target

Affiliations

Multiomic ALS signatures highlight subclusters and sex differences suggesting the MAPK pathway as therapeutic target

Lucas Caldi Gomes et al. Nat Commun. .

Abstract

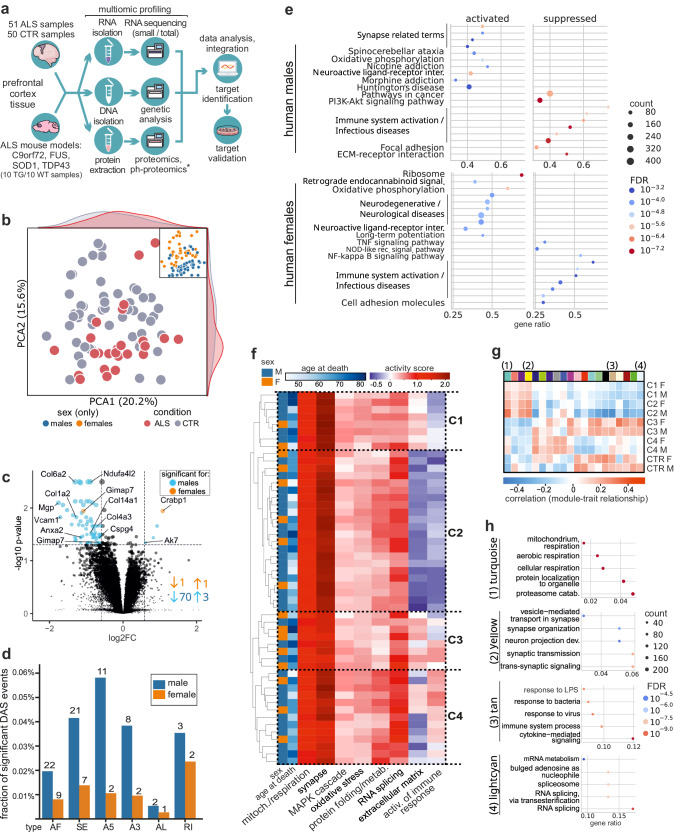
Amyotrophic lateral sclerosis (ALS) is a debilitating motor neuron disease and lacks effective disease-modifying treatments. This study utilizes a comprehensive multiomic approach to investigate the early and sex-specific molecular mechanisms underlying ALS. By analyzing the prefrontal cortex of 51 patients with sporadic ALS and 50 control subjects, alongside four transgenic mouse models (C9orf72-, SOD1-, TDP-43-, and FUS-ALS), we have uncovered significant molecular alterations associated with the disease. Here, we show that males exhibit more pronounced changes in molecular pathways compared to females. Our integrated analysis of transcriptomes, (phospho)proteomes, and miRNAomes also identified distinct ALS subclusters in humans, characterized by variations in immune response, extracellular matrix composition, mitochondrial function, and RNA processing. The molecular signatures of human subclusters were reflected in specific mouse models. Our study highlighted the mitogen-activated protein kinase (MAPK) pathway as an early disease mechanism. We further demonstrate that trametinib, a MAPK inhibitor, has potential therapeutic benefits in vitro and in vivo, particularly in females, suggesting a direction for developing targeted ALS treatments.


Conflict of interest statement

The authors declare no competing interests.

Figures

Fig. 1
Fig. 1. Identification of transcriptomic subclusters and sex-specific differences in human ALS patients.
a Overview of the sample processing workflow. Prefrontal cortex samples were prepared for multiomics experiments from the human cohort (51 ALS/50 CTR samples), as well as from four selected ALS mouse models (C9orf72, FUS, SOD1, and TDP-43; 10 Tg/10 CTR animals per group). Panel a was created with BioRender.com released under a Creative Commons Attribution-NonCommercial-NoDerivs 4.0 International license. b Principal component analysis (PCA) on the 500 most variable genes of the human samples. Blue and orange indicate the sex, and the condition is indicated in pink (ALS) or gray (CTR). c Volcano plot of deregulated proteins in humans. x-axis: log2 fold change; y-axis: -log10 p-value for each protein (DE analysis done with the limma package in R, two-sided test; Benjamini-Hochberg multiple test correction). Blue and orange circles indicate significant differential changes: left side, decrease (low ALS); right side, increase (high ALS). d Differential alternative splicing (DAS) analysis. The plot displays the results for human male and female samples for various splice events, i.e., alternative exon (AE), skipped exon (SE), alternative 5’-splice site (A5), alternative 3’-splice site (A3), alternative last exon (AL), and retained intron (RI) events. Each event is represented by a separate bar, the height of which represents the fraction of significant events in ALS vs. CTR. Blue: male results; orange: female results. e Sex-specific enrichment analysis reveals crucial pathways in neurodegeneration and ALS pathology. f Hierarchical clustering analysis of enriched pathways and literature insights reveals four distinct clusters (C1–C4) in ALS patients. Immune response regulation dichotomizes patients into C1/C2 vs. C3/C4, while ECM, synaptic function, and protein folding further differentiate C1 vs. C2 and C3 vs. C4. g Heatmap showing modules from weighted gene co-expression network analysis (WGCNA) associated with the clusters through similarly regulated RNA networks. h Pathway enrichment per WGCNA cluster (top hits). The turquoise module, upregulated in C1 and C2, especially in males, is enriched for mitochondrial respiration, suggesting increased oxidative activity in PFC neurons. The yellow module, associated with synaptic function, exhibits a similar regulation in C1 and C2, while the tan and lightcyan modules, enriched for immune response and RNA splicing, respectively, are upregulated in C3 and C4.
Fig. 2
Fig. 2. Validation of sex-specific dysregulation in ALS patients in microRNAomic, proteomic and multiomic analyzes.
a, b Volcano plot of microRNA analyzes of human samples, separated by sex for mature (a) and hairpin (b) microRNAs. We used DESEq2 for DE analysis and Benjamini-Hochberg for multiple test correction. The x-axis shows the log2 fold change in ALS vs CTR, whereas the y-axis shows the -log10 p-value. Orange and blue dots represent DEGs in females and males, respectively. miRNA-mediated regulation in ALS reveals a notable sex-dependent pattern. Male ALS patients exhibit a more pronounced downregulation of mature and hairpin miRNAs compared to females. c Heatmap showing mature miRNA expression changes for the identified ALS clusters. miRNA candidates significant in at least one condition were considered (p < 0.05). The scale (left-hand side) shows the range of log2 fold change values. d Volcano plot of differentially expressed proteins (DEP) in human samples (calculated with limma, two-sided test; multiple test correction with Benjamini-Hochberg). The x-axis shows the log2 fold change ALS and CTR, whereas the y-axis shows the -log10 p-values. Orange and blue dots represent DEGs in females and males, respectively. 379 DEPs in males and 251 in females. ANXA2 emerges as the sole protein downregulated in both sexes (p < 0.1). e, f Functional enrichment and unsupervised clustering using REVIGO, a tool used for summarizing Gene Ontology (GO) terms. Important pathway clusters are revealed in both sexes, including synaptic function, immune response, and ECM/cytoskeleton. Females (e) exhibited enrichment in transmembrane transport, lipid metabolism, development, catalytic activity, and ERK1/2 signaling, while males (f) showed enrichment in cell metabolism and tyrosine kinase-related pathways. The size of the circles represents the number of genes in the GO-BP terms, and the color of each node represents the enrichment FDR values. g, h Uniform manifold approximation and projection (UMAP) of MOFA factor analysis for sex (g) and condition (ALS vs. CTR) (h). Sex (g) emerges as a robust differentiating factor when integrating transcriptomic, small RNA, and proteomic data. i MOFA correlation analysis displays which factors are dominated by which omic layer. Components of the representative factors 3 (males) and 12 (females) are displayed in feature-weight plots (bottom part). These factors are the ones that better correlate with disease conditions for each sex.
Fig. 3
Fig. 3. ALS mouse models partially resemble human ALS subclusters.
a Volcano plots of DE genes for male and female mice across ALS models (C9orf72, SOD1, TDP-43, and FUS). The x-axis illustrates the log2 fold change between ALS and control (CTR), while the y-axis displays the -log10 adjusted p-values. Orange and blue dots denote differentially expressed genes in females and males, respectively. DESEq2 was used for DE analysis and Benjamini-Hochberg for multiple test correction. b Analysis of enriched Gene Ontology (GO) terms using topGO in male and female samples. The dot plot displays significantly enriched pathways in males and females, represented by circles colored by their corresponding adjusted p-values (-log10 transformed) on the x-axis and gene count on the y-axis. The size of each circle corresponds to the number of genes annotated in the GO gene set. c Heatmap showing the differences (ALS vs. ctrl) in the estimated cell-type fractions (microglia, inhibitory neurons, excitatory neurons, oligodendrocytes, endothelial cells, oligodendrocyte precursor cells [OPC], astrocytes) for human subclusters and mouse ALS models. Relative differences in cell type abundances are depicted. d Pearson Correlation analysis of deconvolved cell-type fraction changes (as shown in c) between human and mouse ALS models. Correlation between relative differences are shown. Subgroups C1 and C2 demonstrated the strongest correlation with the SOD1 model, while C3 exhibited the best correlation with the C9orf72 model, with additional correlations with the TDP-43 and FUS models. A weak correlation was noted between C4 and the FUS model. e REVIGO-based summary of proteomics gene set enrichment results for the mouse models. The plots summarize the functional similarity for each model by reducing redundant GO-BP (biological process) terms and clustering the remaining non-redundant terms. Each cluster represents a network of similar GO-BP terms. Networks with 5 or more nodes for each model were selected for display. The size of the circles represents the number of genes in the GO-BP terms, and the color of each node represents the enrichment FDR values.
Fig. 4
Fig. 4. Consistent dysregulation of the MAPK pathway in human ALS patients and mouse models.
a The occurrence and importance of MAPK pathways and other related kinase pathways are shown across all mouse models and the human samples, highlighting distinct activities within the co-expression modules identified by WGCNA. For that, we selected gene modules from individual WGCNA analyzes for mice and humans by filtering for terms with MAPK/MAP kinase. The upper panel shows the significance (-log10 p-value; right-tailed fisher’s exact test with Benjamini-Hochberg correction) and the lower panel shows absolute counts. The legend below the bars depicts the origin of the hits. b GO-enrichment results for DAS genes. Bar heights represent the fraction of Gene Ratio of differentially alternatively spliced genes in the pathways. All pathways have an adjusted p-value < 0.1. c Differential expression analyzes for mature miRNAs for humans and ALS mouse models. Mice exhibited pronounced differential expression (DE) of miRNAs, with the C9orf72 model showing the most significant changes. d Targets of miR-451a, such as MAPK1, AKT1, BCL2, Il6R, IKBKB, MIF, MMP2, and MMP9, are involved in cell growth, survival, apoptosis, inflammatory signaling, and ECM remodeling. e Target centrality measurement for miR-451a reveals MAPK1 as the top hit for target centrality measures based on the network shown in panel (d). f Protein-protein interaction (PPI) network of the genes in MOFA factor 12 in females. MAPK1 is an important molecular hub and interacts with PEA15, PRRT2, MEK2, DUSP6, HSPA4 and HSP90AA1. Further proteins of interest are highlighted (bold/dark purple). g Scheme for the mechanism of action of trametinib in the context of the MAPK pathway. MEK/Erk are activated through the Ras/RAF/PI3K cascade, showing important roles for cell proliferation/survival. ERK activation is subject to negative feedback regulation both downstream and upstream of MEK. This involves the expression of DUSPs, as well as the direct phosphorylation and inhibition of proteins such as RAF. Trametinib binds to the activation loop of MEK, disrupting the Raf-dependent phosphorylation of the target. This results in reduced expression of p-MEK and p-Erk. The pharmacological inhibition of MEK by trametinib swiftly eliminates this feedback mechanism, inducing the phosphorylation of MEK. Panel g was created with BioRender.com released under a Creative Commons Attribution-NonCommercial-NoDerivs 4.0 International license.
Fig. 5
Fig. 5. Effects of the MEK2-inhibitor trametinib on the MAPK pathway in vitro.
a, b Effects of different concentrations of trametinib on apoptosis in glutamate (5 mM)- and non-glutamate-treated cells analyzed by immunostaining. Representative photomicrographs for two of the analyzed conditions (control [vehicle] and 200 nM trametinib). Scale bar: 40 µm. c, d Quantification plots showing the effects of treatment with trametinib on cell survival (caspase 3 staining) (c) and neurite outgrowth (d) for glutamate- or vehicle-treated (control) cells, for all analyzed conditions (control [vehicle]; 2 nM trametinib; 20 nM trametinib; 200 nM trametinib). Data represent the mean ±  standard error of the mean (SEM) (n = 5 independent neuronal cultures), and were tested using pairwise Tukey’s test after one-way analysis of variance. In (c), p < 0.0001 for 0 mM glutamate − 0 nM trametinib vs. 5 mM glutamate − 0 nM trametinib conditions; p = 0.0027 for 5 mM glutamate − 0 nM trametinib vs. 5 mM glutamate − 20 nM trametinib conditions; p = 0.0237 for 5 mM glutamate − 0 nM trametinib vs. 5 mM glutamate − 200 nM trametinib conditions. In (d), p = 0.0051 for 0 mM glutamate − 0 nM trametinib vs. 5 mM glutamate − 0 nM trametinib conditions; p < 0.0001 for 5 mM glutamate − 0 nM trametinib vs. 5 mM-glutamate − 20 nM trametinib conditions; p = 0.0003 for 5 mM glutamate − 0 nM trametinib vs. 5 mM glutamate − 200 nM trametinib conditions. Non-significant comparisons not depicted in the panels. e, f Western blot analysis and quantification of trametinib effects on pErk1/2 with and without glutamate treatment. Data represent the mean ± SEM (n = 3 different cultures) and were tested using pairwise Tukey’s test after one-way analysis of variance. In (f), p = 0.0139 for 0 mM glutamate − 0 nM trametinib vs. 5 mM glutamate − 0 nM trametinib conditions; p = 0.0103 for 5 mM glutamate − 0 nM trametinib vs. 5 mM glutamate − 20 nM trametinib conditions; p = 0.0042 for 5 mM glutamate − 0 nM trametinib vs. 5 mM glutamate − 200 nM trametinib conditions. Non-significant comparisons not depicted in the panels.
Fig. 6
Fig. 6. Modulation of the MAPK pathway member MEK2 by trametinib attenuates ALS pathology in vivo.
a Western blot analysis of pMEK2 in lumbar spinal cords of SOD1 transgenic (tg) and non-transgenic (Ntg) mice at 9, 14, and 19 weeks. Data are shown as box plots (Ntg, n = 6; SOD1, n = 4 per group) with median center lines, 0.25-0.75 interquartile range boxes, and 1.5x IQR whiskers. Results are expressed as relative immunoreactivity (RI). *p < 0.05, pairwise Tukey’s test after one-way ANOVA. bf Results of the study in female and male SOD1 mice un/treated with trametinib (9 to 16 weeks). Data are presented as box plots with center line on median, box bounds indicating the 0.25-0.75 IQR and whiskers at 1.5 times the IQR below the first and above third quartile. Dot blot analysis of pERK1/2 (female, n = 4 per group; male, n = 4 vehicle-treated mice; n = 5 trametinib-treated mice) (b), p62 (female, n = 3 vehicle-treated mice; n = 5 trametinib-treated mice; male, n = 5 per group) (c), insoluble SOD1 (female, n = 4 per group; male, n = 5 vehicle-treated mice; n = 4 trametinib-treated mice) (d), and ubiquitin (female, n = 4 per group; male, n = 5 per group) (e) in the spinal cord of SOD1 female and male mice treated with trametinib or vehicle. Data are mean ± SEM and are expressed as relative immunoreactivity (RI). *p < 0.05, Student’s t-test. Plasma neurofilament light chain levels were analyzed in female and male (f) SOD1 mice treated or not with trametinib. Data are mean ± SEM (female, n = 3 vehicle-treated mice and n = 5 trametinib-treated mice; male, n = 4 vehicle-treated mice and n = 5 trametinib-treated mice). *p < 0.05, two-tailed Student’s t-test. g, h Diffuse pMEK2 immunostaining in the lumbar spinal cord of non-transgenic (g) and SOD1 mice (h) at 19 weeks. In the ventral horns, pMEK2 staining was mainly observed in motor neurons. Scale bar: 50 µm. Experiments included three animals per group; three independent slices analyzed per animal. ik In a preclinical study, female SOD1 mice were treated with trametinib from 9 weeks until end of life. Paralysis was assessed by age at loss of reflex, with hind limbs and paws retracted. The mean age differed significantly between trametinib-treated mice (150.2 ± 8 days) and vehicle-treated mice (143.5 ± 6.5 days). Data are mean ± SEM (vehicle n = 8; trametinib n = 10). *p = 0.0376, one-tailed Student’s t-test. j Kaplan–Meier curve for disease onset and survival of SOD1 female mice treated with vehicle (n = 8) or trametinib (n = 10). Log–rank Mantel–Cox test for disease onset, *p = 0.0177 (mean ± SD = vehicle 103.4 ± 3.5 days and trametinib 108.7 ± 5 days). Log–rank Mantel–Cox test for survival, *p = 0.0405 (mean ± SD = vehicle 147 ± 6.5 days and trametinib 153.7 ± 8 days). k Plasma NfL levels were analyzed in SOD1 female mice, with and without trametinib treatment, at 16 and 19 weeks. Data are mean ± SEM (16 weeks: vehicle n = 3, trametinib n = 5; 19 weeks: vehicle n = 5, trametinib n = 6). At 16 weeks: p = 0.0486 for vehicle-treated animals vs. trametinib-treated animals; at 19 weeks: p = 0.003 for vehicle-treated animals vs. trametinib-treated animals (Benjamini-Hochberg corrected p-values after one-way ANOVA).

References

    1. Mehta P, et al. Prevalence of amyotrophic lateral sclerosis in the United States using established and novel methodologies, 2017. Amyotroph. Lateral Scler. Front. Degener. 2023;24:108–116. doi: 10.1080/21678421.2022.2059380. - DOI - PMC - PubMed
    1. Suzuki N, Nishiyama A, Warita H, Aoki M. Genetics of amyotrophic lateral sclerosis: seeking therapeutic targets in the era of gene therapy. J. Hum. Genet. 2023;68:131–152. doi: 10.1038/s10038-022-01055-8. - DOI - PMC - PubMed
    1. Mead RJ, Shan N, Reiser HJ, Marshall F, Shaw PJ. Amyotrophic lateral sclerosis: a neurodegenerative disorder poised for successful therapeutic translation. Nat. Rev. Drug Discov. 2023;22:185–212. doi: 10.1038/s41573-022-00612-2. - DOI - PMC - PubMed
    1. Braak H, Braak E. Neuropathological stageing of Alzheimer-related changes. Acta Neuropathol. (Berl.) 1991;82:239–259. doi: 10.1007/BF00308809. - DOI - PubMed
    1. Braak H, et al. Staging of brain pathology related to sporadic Parkinson’s disease. Neurobiol. Aging. 2003;24:197–211. doi: 10.1016/S0197-4580(02)00065-9. - DOI - PubMed

MeSH terms