. 2024 Jun 7;15(1):4874.
doi: 10.1038/s41467-024-49031-4.

Mapping and annotating genomic loci to prioritize genes and implicate distinct polygenic adaptations for skin color

Affiliations

Mapping and annotating genomic loci to prioritize genes and implicate distinct polygenic adaptations for skin color

Beomsu Kim et al. Nat Commun. .

Abstract

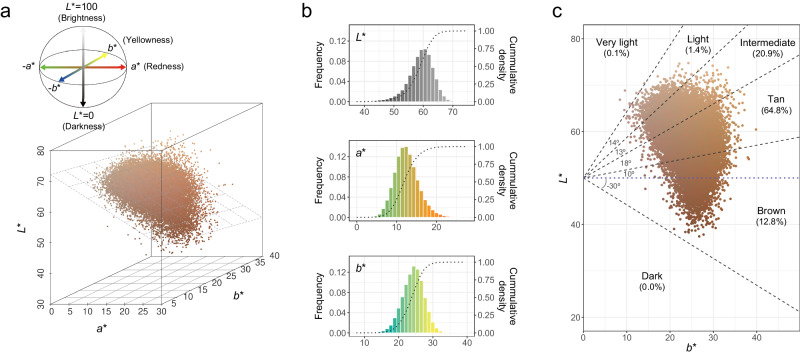
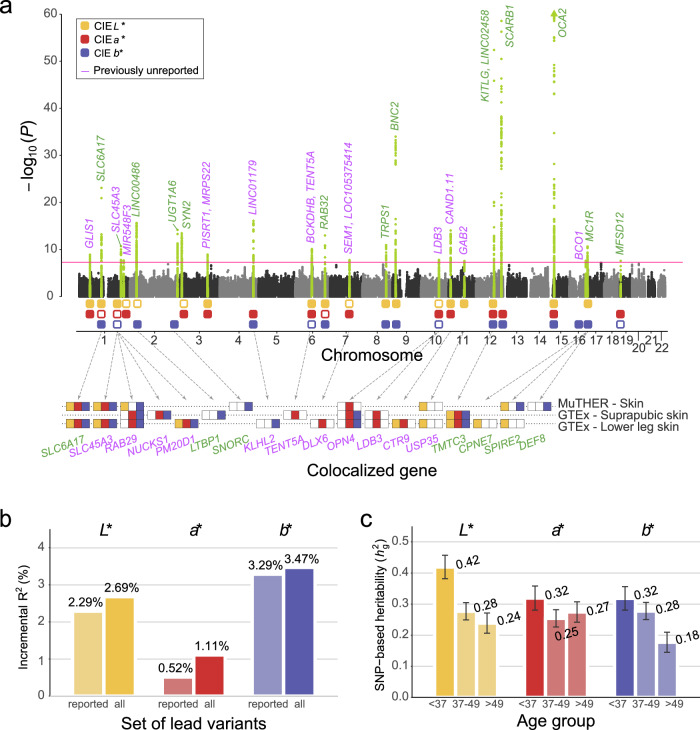
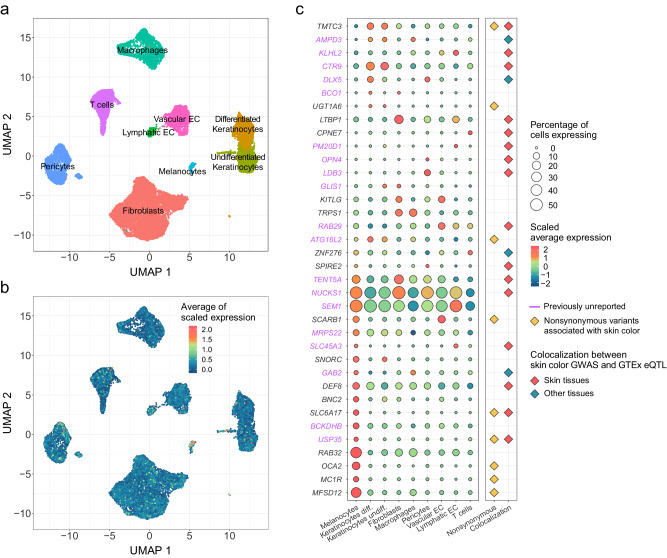
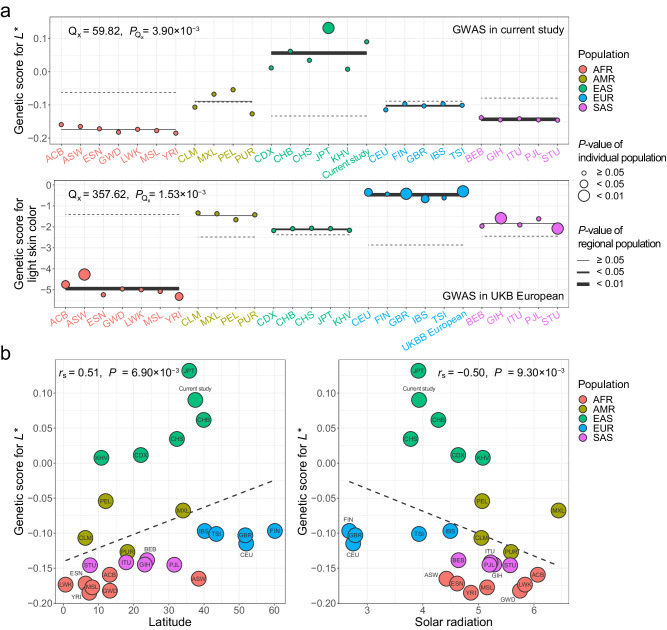
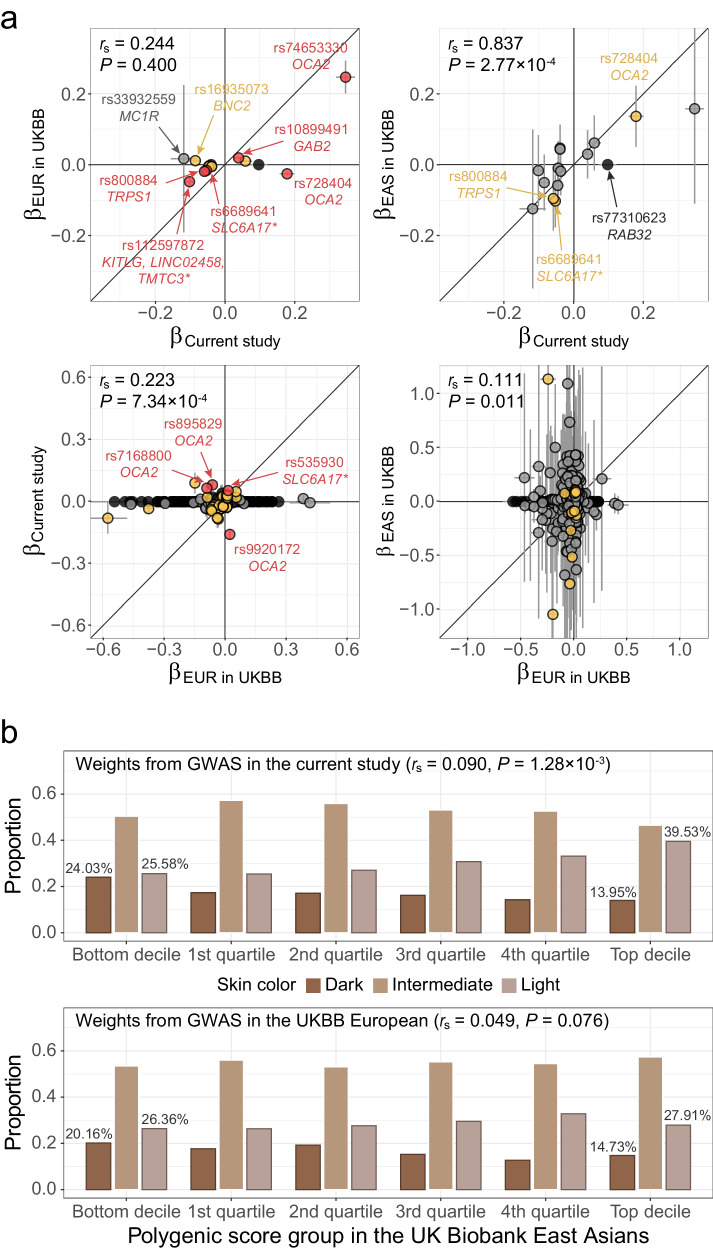
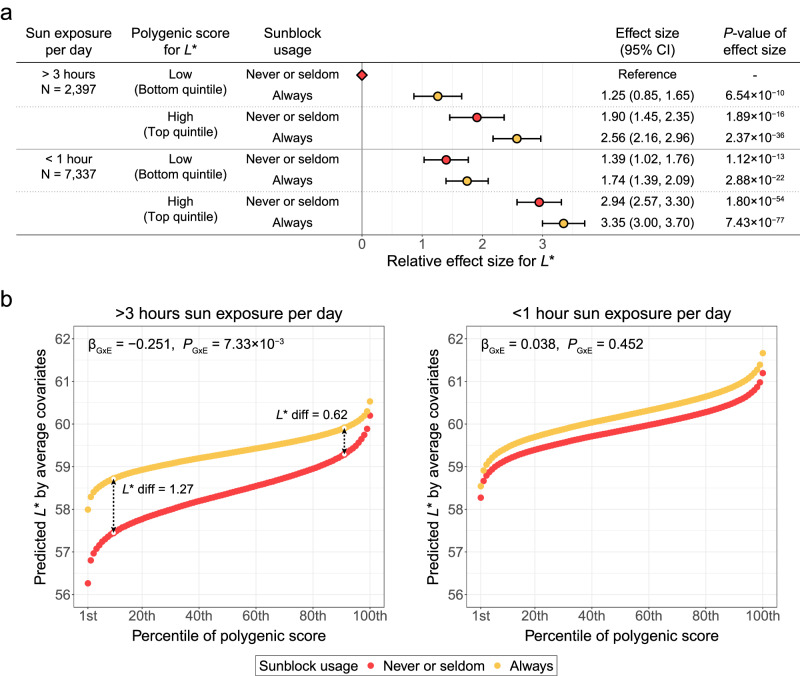
Evidence for adaptation of human skin color to regional ultraviolet radiation suggests shared and distinct genetic variants across populations. However, skin color evolution and genetics in East Asians are understudied. We quantified skin color in 48,433 East Asians using image analysis and identified associated genetic variants and potential causal genes for skin color as well as their polygenic interplay with sun exposure. This genome-wide association study (GWAS) identified 12 known and 11 previously unreported loci and SNP-based heritability was 23-24%. Potential causal genes were determined through the identification of nonsynonymous variants, colocalization with gene expression in skin tissues, and expression levels in melanocytes. Genomic loci associated with pigmentation in East Asians substantially diverged from European populations, and we detected signatures of polygenic adaptation. This large GWAS for objectively quantified skin color in an East Asian population improves understanding of the genetic architecture and polygenic adaptation of skin color and prioritizes potential causal genes.


Conflict of interest statement

Migenstory’s business is exclusively involved in providing Direct-to-Consumer (DTC) genetic testing services and generating data for research at LG H&H, without any engagement in the development of medicine or related technologies. J.G.S., S.L., H.K., K.N.G., S.W.Y., S.G.P., Y.K., and N.G.K. are employees of LG H&H. Other authors declare no other competing interests.

Figures

Fig. 1
Fig. 1. Skin color distribution of participants.
a Three-dimensional distribution of quantitatively assessed skin color indices in the CIE LAB color space. Each dot corresponds to a study participant and its color represents the measured skin color for that person. The diagonal plane represents the regression plane for “L* ~ a* + b*”. b Distribution of L* (top), a* (middle), and b* (bottom). Histogram shows the frequency of each skin color trait, and dotted line represents the cumulative density. c Distribution of categorical skin color classified by individual typology angle (ITA°) value: ITA° = [ArcTan((L* − 50)/b*)] × (180/π). Each dot corresponds to a study participant and its color represents an average value of the measured skin color of both cheek areas for that person. Blue dotted line represents a horizontal line at L* = 50 and black dashed line represents the ITA° cutoff for categorical skin color.
Fig. 2
Fig. 2. GWAS of skin color traits with colocalization results and SNP-based heritability.
a Manhattan plot with −log10 (P) is presented for CIE LAB values of skin color, and genes colocalized in skin tissues are presented below the Manhattan plot. P-values were estimated using a two-sided score test in BOLT-LMM. The red horizontal line corresponds to the genome-wide significance threshold (P = 5 × 10−8). Genes in green and purple represent previously reported and unreported loci, respectively. Green dots indicate significant loci in at least one GWAS. Boxes in yellow, red, and blue represent significant loci of L*, a*, and b*, respectively; solid boxes indicate genome-wide significant loci and boxes with colored borderlines indicate nominally significant loci (P < 2.17 × 10−3, Bonferroni’s correction for 23 significant loci). For the boxes above colocalized genes, solid boxes indicate that a gene was colocalized (PP.H4 > 0.8) with GWAS of the color-corresponding phenotype. b Incremental R2 value, defined as the increase in adjusted R2 from the linear regression model relative to that from the model with covariates only. The incremental R2 of lead SNPs on previously reported loci and on all identified loci are left and right for each trait, respectively. c SNP-based heritability by age group. For each skin color trait, SNP-based heritability of “young age” (<37 years, N = 11,369), “middle age” (37–49 years, N = 17,011), and “old age” (>49 years, N = 14,390) groups are described in order from left to right. Error bars indicate standard errors (SNP-based heritability estimates ± standard error).
Fig. 3
Fig. 3. Single-cell level gene expression patterns of CIE LAB values-associated genes.
a UMAP plot is shown for cell type identification. Cell types are identified with expression patterns of well-known cell type markers. Each color represents a cell type. b UMAP plot shows the overall expression patterns of CIE LAB-associated genes. Each cell is colored according to the average scaled expression of CIE LAB values-associated genes. c Dot plot of gene expression in cell types and additional evidence of each gene from the GWAS. Genes in purple represent those in previously unreported loci. The color of the circular dot represents the scaled average expression of each gene across cell types and size of the circular dot represents the percentage of cells expressing each gene within a particular cell type. Rhombic dots in yellow, red, and blue represent genes containing nonsynonymous variants associated with skin color, genes colocalized in skin tissue, or tissues other than skin, respectively. Abbreviations: Keratinocytes Diff. differentiated keratinocytes, Keratinocytes Undiff. undifferentiated keratinocytes, EC endothelial cells.
Fig. 4
Fig. 4. Signals of polygenic adaptation for L* across the 1000 Genomes Project phase 3 populations.
a Distribution of the estimated genetic score for L* across the 1000 Genomes Project populations and results for polygenic adaptation based on the current GWAS (top) and the UK Biobank European GWAS (bottom). A test statistic for overdispersion of genetic scores (Qx) and P-values are presented at the top of each plot (two-sided). b Estimated genetic scores for L* based on the current GWAS are plotted against environmental factors: the absolute latitude of each population (left) and annual solar radiation (right). The regression lines (dashed lines) show the linearity between the genetic score (y-axis) and environmental factors (x-axis). Spearman’s correlation (rs) and P-values are presented at the top of each plot. The P-value of Spearman’s correlation coefficient was estimated using a two-sided test under the null distribution of all possible permutations. Abbreviations: AFR African, AMR admixed American, EAS East Asian, EUR European, SAS South Asian, ACB African Caribbean in Barbados, ASW African Ancestry in Southwest USA, ESN Esan in Nigeria, GWD Gambian in Western Division, Mandinka, LWK Luhya in Webuye, Kenya, MSL Mende in Sierra Leone, YRI Yoruba in Ibadan, Nigeria, CLM Colombian in Medellín, Colombia, MXL Mexican Ancestry in Los Angeles, CA, USA, PEL Peruvian in Lima, Peru, PUR Puerto Rican in Puerto Rico, CDX Chinese Dai in Xishuangbanna, China, CHB Han Chinese in Beijing, China, CHS Southern Han Chinese, China, JPT Japanese in Tokyo, Japan, KHV Kinh in Ho Chi Minh City, Vietnam, KOR Korean in the current study, CEU Utah residents with ancestry from Northern and Western Europe, FIN Finnish in Finland, GBR, British from England and Scotland, IBS Iberian Populations in Spain, TSI Toscani in Italy, UKBB European in the UK Biobank, BEB Bengali in Bangladesh, GIH Gujarati Indians in Houston, Texas, USA, ITU Indian Telugu in the UK, PJL Punjabi in Lahore, Pakistan, STU Sri Lankan Tamil in the UK.
Fig. 5
Fig. 5. Comparison of lead variants for L* and polygenic score performance with the UK Biobank.
a Comparison of lead variants for L* from the current GWAS with the UK Biobank European GWAS (top left) and East Asian GWAS (top right), and comparison of lead variants for light skin from the UK Biobank European GWAS with the current GWAS (bottom left) and UK Biobank East Asian GWAS (bottom right). Dots in red, yellow, and gray represent genome-wide significant (P < 5 × 10−8), nominally significant (P < 2.17 × 10−3, Bonferroni’s correction for 23 significant loci), and non-significant variants in the compared GWASs, respectively. Dots in black represent variants without results in the compared GWASs and are plotted along the x-axis. Colocalized genes in skin tissues are marked with an asterisk. Spearman’s correlation (rs) between effect sizes (β) of variants without black dots is presented at the top of each plot. b Distribution of polygenic score in the UK Biobank East Asian sample. The polygenic scores were calculated with weights from the current GWAS (top) and the UK Biobank European GWAS (bottom). For each decile or quartile of the polygenic score distribution, the proportion of participants who answered dark, intermediate, and light skin color is presented in order from left to right. Spearman’s correlation (rs) between the residual of polygenic score (adjusted for age, sex, and the first 10 PCs) and skin color and P-values are presented at the top of each plot. The P-value of Spearman’s correlation coefficient was estimated using a two-sided test under the null distribution of all possible permutations.
Fig. 6
Fig. 6. Interplay of polygenic score and sun exposure for L*.
a Relative effect size for L* of each group divided according to sun exposure hours per day, polygenic score, and sunblock usage. A rhombic dot represents a reference group. Each dot represents the relative effect size and is colored according to sunblock usage. A total of 9734 independent individuals were examined in a linear model. Error bars indicate 95% confidence intervals for the relative effect size (relative effect size ± 95% confidence interval). b Predicted L* by average covariates in each percentile of polygenic score distribution for participants with never or seldom sunblock usage (red) and always sunblock usage (yellow) within each group by sun exposure hours per day; more than 3 h (left) and less than 1 h (right). Effect size (βG×E) and P-values (PG×E) of interaction between polygenic score and sunblock usage within each sun exposure group are presented at the top of each plot. Abbreviations: CI confidence interval, L* diff difference in L* between sunblock usage groups at the top and bottom 10th percentiles of the polygenic score distribution.

References

    1. Brenner M, Hearing VJ. The protective role of melanin against UV damage in human skin. Photochem. Photobio. 2008;84:539–549. doi: 10.1111/j.1751-1097.2007.00226.x. - DOI - PMC - PubMed
    1. Quillen EE, et al. Shades of complexity: new perspectives on the evolution and genetic architecture of human skin. Am. J. Phys. Anthropol. 2019;168(Suppl 67):4–26. doi: 10.1002/ajpa.23737. - DOI - PubMed
    1. Pickrell JK, et al. Signals of recent positive selection in a worldwide sample of human populations. Genome Res. 2009;19:826–837. doi: 10.1101/gr.087577.108. - DOI - PMC - PubMed
    1. Deng L, Xu S. Adaptation of human skin color in various populations. Hereditas. 2018;155:1. doi: 10.1186/s41065-017-0036-2. - DOI - PMC - PubMed
    1. Parra, E. J. Human pigmentation variation: evolution, genetic basis, and implications for public health. Am. J. Phys. Anthropol.134(Suppl 45), 85–105 (2007). - PubMed