. 2024 Jun 7;15(1):4864.
doi: 10.1038/s41467-024-49163-7.

The role of promiscuous molecular recognition in the evolution of RNase-based self-incompatibility in plants

Affiliations

The role of promiscuous molecular recognition in the evolution of RNase-based self-incompatibility in plants

Keren Erez et al. Nat Commun. .

Abstract

How do biological networks evolve and expand? We study these questions in the context of the plant collaborative-non-self recognition self-incompatibility system. Self-incompatibility evolved to avoid self-fertilization among hermaphroditic plants. It relies on specific molecular recognition between highly diverse proteins of two families: female and male determinants, such that the combination of genes an individual possesses determines its mating partners. Though highly polymorphic, previous models struggled to pinpoint the evolutionary trajectories by which new specificities evolved. Here, we construct a novel theoretical framework, that crucially affords interaction promiscuity and multiple distinct partners per protein, as is seen in empirical findings disregarded by previous models. We demonstrate spontaneous self-organization of the population into distinct "classes" with full between-class compatibility and a dynamic long-term balance between class emergence and decay. Our work highlights the importance of molecular recognition promiscuity to network evolvability. Promiscuity was found in additional systems suggesting that our framework could be more broadly applicable.


Conflict of interest statement

The authors declare no competing interests.

Figures
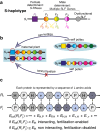
Fig. 1
Fig. 1. Self-incompatibility in the S-RNase-based mechanism – the collaborative non-self recognition (CNSR) mechanism.
a The S-locus includes a single S-RNase gene (expressed in the female organs) and multiple SLF paralogs (expressed in the male organs). An SLF protein can detoxify one or more different S-RNase proteins, but could also detoxify none, in which case it is considered dysfunctional. b A haploid pollen harboring a particular combination of SLF proteins can successfully fertilize a diploid maternal plant only if it is equipped with the specific SLFs that can detoxify the maternal plant’s two S-RNases (top, encircled SLFs). An S-locus usually does not contain SLF genes capable of detoxifying its own S-RNase, hence its pollen cannot fertilize its own ovules. Such a haplotype is called “self-incompatible” (bottom), whereas a haplotype that does contain SLF compatible with its own S-RNase is called “self-compatible”. Due to inbreeding depression, there is a strong selection pressure against self-compatibility. c The protein–protein interaction model: we assume that the total interaction energy between two proteins Ri and Fj is the sum of the pairwise interaction energies between their corresponding amino acids. A pair of RNase and SLF proteins are considered interacting (fertilization is enabled) only if this energy is below a threshold value Eth. Otherwise, if E ≥ Eth they are considered non-interacting, and fertilization is disabled.
Fig. 2
Fig. 2. The population life cycle in our simulation.
We initialize a population of N self-incompatible diploid heterozygous individuals, where each haplotype is composed of a single RNase (square) and multiple SLF genes (circles), each represented by a sequence of L amino acids (Fig. 1). Every generation, each of these genes could be mutated via the substitution of randomly chosen residues. A diploid maternal plant can be fertilized by a haploid pollen, only if the pollen is equipped with suitable SLFs that can detoxify the two maternal S-RNases. To keep track of all compatible pairs, we chart the table of possible crosses between all haploid pollen and diploid maternal plant combinations. We assume that a proportion α of the pollen received by each maternal plant is self-pollen and the remaining 1 − α proportion is foreign pollen. If an individual is self-compatible, only a proportion 1 − δ of the offspring produced by self-fertilization survives. We then draw the next generation of the population by randomly picking maternal plants (with replacement) and then granting each k opportunities to match a randomly chosen pollen. If a matching pollen is found within k attempts, the maternal plant and the first successful pollen produce one offspring. This process is continued until a population of N offspring is formed, which then replaces the parental population. Each cycle represents a single generation. The default parameter values are: population size N = 500, per-residue mutation rate pmut = 10−4 per generation, number of generations 100,000–150,000, α = 0.95, δ = 1.
Fig. 3
Fig. 3. Compatibility classes are genetically homogeneous under one-to-one interactions, but could be genetically heterogeneous under the many-to-many interaction model.
Compatibility classes are defined such that all members of each class are bidirectionally incompatible within the class, but simultaneously bidirectionally compatible with all members of all other classes. Previous models assuming that interactions between RNase and SLF are one-to-one, implied that compatibility classes should be genetically homogeneous, except for useless SLFs (left). Here, in contrast, we incorporate a more intricate interaction model, in which each protein could potentially have multiple different matching partners. Hence, within-class genetic heterogeneity becomes possible (right). Crucially, haplotypes in the same class could differ not only in their SLFs, but also in their RNase alleles. Following this definition, some haplotypes might remain unclassified. We illustrate a few examples of unclassified haplotypes (external to the ellipses): an RNase (red) that does not have a matching SLF in any of the classes, a self-compatible haplotype (green RNase and green SLF), and a haplotype bearing an SLF that matches other class members (purple SLF).
Fig. 4
Fig. 4. Dependence of class birth and death events on the present number of classes suggests a stable equilibrium in the number of classes – simulation results.
a The fraction of time spent under each K-class population state. b The fraction of birth (green) and death (red) events that occurred under each K-class population state. c The event rates: the number of class birth (green) and class death (red) events that occurred under each K-class state divided by the time spent in this state. We observe opposite trends of these rates such that the class birth rate decreases but the class death rate increases with extant class number, suggesting a stable equilibrium at an intermediate value. The proportion of unclassified haplotypes and the proportion of self-compatible ones are shown in Fig. S3. For simulation parameters see Table 1. Results are based on 39 independent runs, with a total of 1,478,050 generations.
Fig. 5
Fig. 5. The main class split and extinction trajectories are intertwined – a schematic diagram showing all the relevant transitions.
a All split trajectories require a sequence of three mutations: one RNase and two SLF mutations. The three split trajectories – here designated by the blue, magenta, and yellow paths – differ in the mutation order (see detailed description in the main text). A light yellow background highlights the surviving haplotypes that form the final classes after the split. If the RNase mutation is neutral, it could only lead to a class split. If, however, the newly emerging RNase mutation is incompatible as dam with one or more existing classes, it could also lead to the extinction of those classes in either of three ways, shown here as optional events (dashed arrows) accompanying the split pathways. Split is not obligatory even if the first and second mutations occurred. For example, following the RNase mutation, it is possible that the new RNase replaces the original one and the class returns to a single RNase state. Similarly, after the second mutation, the advantageous haplotype carrying the SLF mutation could take over before the third mutation occurs. These transitions are shown by black arrows alone. b An “essentially neutral” RNase mutation (top) means that all foreign classes are either fully compatible as sires with the new RNase (red) similar to the original RNase (blue) or partially compatible but can adjust by changing their composition to regain full compatibility. An “essentially non-neutral” RNase mutation (bottom) means that at least one non-self class is (at least partially) sire-incompatible with the mutant RNase to the extent that it fails to adjust and restore full compatibility. For brevity, we omit below the word “essentially” and use the term neutral in this sense. c, d Occurrence histograms showing the fraction of each of the possible split (c) and extinction (d) trajectories, as observed in our simulations. In addition to the three extinction trajectories shown in (a), we also find “spontaneous” extinctions, occurring with no driving mutation, solely due to drift.
Fig. 6
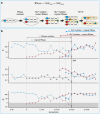
Fig. 6. Dynamics and fitness in the most common split trajectory.
a Schematic description of the sequence of mutations constituting the most common split trajectory (blue trajectory in Fig. 5). It starts with an RNase mutation followed by an SLF mutation on the background of the mutant RNase. Finally, a second SLF mutation compatible with the mutant RNase, which occurs on the background of the original RNase, gives rise to the daughter class separation from the mother class. Light yellow background designates the haplotypes that form the daughter classes. b An example of this trajectory from simulations. The three sub-figures show the copy numbers Xi of the relevant haplotypes (top), their male-fitness fi (middle), and their fitness-adjusted copy number X~i=Xi+(fif¯)N, where f¯ is the population mean male-fitness (bottom). The horizontal gray dashed line in the middle sub-figure represents the population mean fitness. The gray-colored zone in the bottom sub-figure marks negative X~i values. Haplotypes reaching negative values become extinct soon afterward. Different symbols represent different haplotypes with different combinations of mutations, as follows. The blue horizontal bar is the original RNase, red vertical bar is the mutant RNase. Colored circles surrounding the bars represent the SLF mutations, whereas the blue (red) circle represents an SLF mutation matching the original blue (mutant red) RNase. The arrows above mark the lifetime of each of these haplotypes. The vertical lines show the mutation occurrence times (solid lines) and the split time (thick dashed line). For simulation parameters see Table 1.
Fig. 7
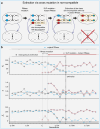
Fig. 7. Dynamics and fitness in the most common extinction trajectory.
a Schematic description of the sequence of mutations constituting the most common extinction trajectory (Extinction via cross-mutation in non-compatible in Fig. 5). Similar to the split trajectory, it starts with an RNase mutation followed by an SLF mutation on the background of the mutant RNase. Here, however, there is one class (dimmed gray) whose members are incompatible as sires with the mutant RNase. Following the expansion of this mutant RNase, that class becomes extinct (red-crossed). b An example of this trajectory from our simulations. We use three sub-figures, similar to Fig. 6, showing the copy numbers Xi of the relevant haplotypes (top), their male-fitness fi (middle) and their fitness-adjusted copy number X~i (bottom). Different symbols represent haplotypes with different mutation combinations. The gray circles represent the doomed class. Other symbols are as in Fig. 6. The gray dashed line marks the population mean fitness. The arrows above mark the lifetime of each of these haplotypes. The gray-colored zone in the bottom sub-figure marks negative X~i values. Haplotypes reaching negative X~ values become extinct soon afterward, as we see in this case for both the doomed class and the original RNase of the driver class, which is replaced by the mutant RNase. For simulation parameters see Table 1.

Similar articles

References

    1. Lande R, Schemske DW. The evolution of self-fertilization and inbreeding depression in plants. I. Genetic models. Evolution. 1985;39:24–40. - PubMed
    1. East EM, Mangelsdorf AJ. A new interpretation of the hereditary behavior of self-sterile plants. Proc. Natl Acad. Sci. USA. 1925;11:166–171. doi: 10.1073/pnas.11.2.166. - DOI - PMC - PubMed
    1. Wright S. The distribution of self-sterility alleles in populations. Genetics. 1939;24:538–552. doi: 10.1093/genetics/24.4.538. - DOI - PMC - PubMed
    1. de Nettancourt, D. (ed.) The genetic basis of self-incompatibility. in Incompatibility in Angiosperms, Monographs on Theoretical and Applied Genetics 28–57 (Springer, 1977). 10.1007/978-3-662-12051-4_2.
    1. Igic B, Lande R, Kohn J. Loss of self-incompatibility and its evolutionary consequences. Int. J. Plant Sci. 2008;169:93–104. doi: 10.1086/523362. - DOI

MeSH terms