. 2024 Jun 7;15(1):4890.
doi: 10.1038/s41467-024-49263-4.

Revealing brain cell-stratified causality through dissecting causal variants according to their cell-type-specific effects on gene expression

Affiliations

Revealing brain cell-stratified causality through dissecting causal variants according to their cell-type-specific effects on gene expression

Ruo-Han Hao et al. Nat Commun. .

Abstract

The human brain has been implicated in the pathogenesis of several complex diseases. Taking advantage of single-cell techniques, genome-wide association studies (GWAS) have taken it a step further and revealed brain cell-type-specific functions for disease loci. However, genetic causal associations inferred by Mendelian randomization (MR) studies usually include all instrumental variables from GWAS, which hampers the understanding of cell-specific causality. Here, we developed an analytical framework, Cell-Stratified MR (csMR), to investigate cell-stratified causality through colocalizing GWAS signals with single-cell eQTL from different brain cells. By applying to obesity-related traits, our results demonstrate the cell-type-specific effects of GWAS variants on gene expression, and indicate the benefits of csMR to identify cell-type-specific causal effect that is often hidden from bulk analyses. We also found csMR valuable to reveal distinct causal pathways between different obesity indicators. These findings suggest the value of our approach to prioritize target cells for extending genetic causation studies.


Conflict of interest statement

The authors declare no competing interests.

Figures
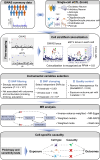
Fig. 1
Fig. 1. Overview of csMR. Briefly, csMR took GWAS summary statistics and eQTL data as inputs.
Colocalization analysis was then implemented to identify colocalized variants with PPH4 > 0.8 in each cell type. Next, a stringent SNP filtering procedure was executed to select qualified instrumental variables in each cell type. MR analysis was conducted with cell-stratified variants using different methods. Finally, after correcting MR results with pleiotropy and sensitivity analyses, the causal relationship between exposure and outcome with respect to each cell type was drawn. Some figure elements were obtained from Servier Medical Art by Servier, which is licensed under a Creative Commons Attribution 4.0 License. Changes were made to the pictures.
Fig. 2
Fig. 2. Characterization of genetic colocalization between BMI-associated variants and gene expression in each brain cell type.
a The number of total and cell-specific colocalized SNPs and genes identified in each cell type. b Estimates of the average eQTL effect sizes in “test” cell types for colocalized SNPs identified in the “reference” cell types. c The proportion of colocalized SNPs identified in different number of cells. Most SNPs colocalized in a single cell type. d Comparison of normalized expression of cell-specific colocalized genes across different cell types. The “reference” cell types where genes colocalized are shown on the left. Each box plot shows the distribution of averaged expression (calculated from normalized read counts derived from a public scRNA-seq dataset) of cell-specific colocalized genes in the “test” cell type. The box plots represent 25th, 50th, and 75th percentiles, and whiskers extend to 1.5 times the interquartile range. The yellow diamond indicates average expression in each test cell. The yellow and blue dashed lines show the mean and median expression levels in reference cell, respectively. The numbers of tested genes (N) are 82, 113, 99, 68, 104, 87, which were identified in reference cell astrocyte, ExN, InN, microglia, ODC and OPC, respectively. The gene expression in reference cell was compared with that in each test cell, and P values were calculated by two-sided paired Wilcoxon tests (*** P < 0.001, ** P < 0.01, * P < 0.05, “N.S.” stands for not significant). The exact P values are listed in Data 3. e LocusZoom plots illustrating the association for variants at the POMC loci with BMI and POMC gene expression in different cells with detectable eQTL signals, including inhibitory neuron, microglia, pericyte and endothelial cell. The cell-specific causal variant is marked with purple diamond and annotated. The strength of their association with each trait is indicated by -log10P.
Fig. 3
Fig. 3. Identifying causal relationships between BMI and 18 disease traits.
Heatmap showing the cell-stratified and tissue-stratified causal effects of BMI on disease outcomes that were categorized into 4 disease classes. Causal associations were indicated by IVW MR analysis (beta coefficients and P values). Cells are colored according to the beta coefficients with red and blue corresponding to positive and negative associations, respectively. Bonferroni correction was used to adjust for multiple testing, and significant associations after adjustment (P < 2.78 × 10⁻⁴) are marked with asterisks. Disease traits that were positively and negatively associated with BMI are colored in red and blue, respectively. Some figure elements were obtained from Servier Medical Art by Servier and Scidraw.io (10.5281/zenodo.5348394), which are both licensed under a Creative Commons Attribution 4.0 License. Changes were made to the pictures.
Fig. 4
Fig. 4. Identifying causal relationships between WHRadjBMI, body fat percentage and 18 disease traits.
Heatmaps showing the cell-stratified effects of (a) WHRadjBMI and (b) body fat percentage on disease outcomes. Cells are colored according to the beta coefficients from IVW MR analysis and are marked with asterisks for significant associations after adjusting for multiple testing with Bonferroni correction (P < 2.78 × 10⁻⁴). Disease traits that were found significantly affected by WHRadjBMI or body fat percentage are colored in green and yellow, respectively, and those not affected by BMI are annotated with asterisks. Some figure elements in panel a were obtained from Servier Medical Art by Servier, which is licensed under a Creative Commons Attribution 4.0 License. Changes were made to the pictures.

References

    1. Scherer T, Sakamoto K, Buettner C. Brain insulin signalling in metabolic homeostasis and disease. Nat. Rev. Endocrinol. 2021;17:468–483. doi: 10.1038/s41574-021-00498-x. - DOI - PubMed
    1. Nampoothiri S, Nogueiras R, Schwaninger M, Prevot V. Glial cells as integrators of peripheral and central signals in the regulation of energy homeostasis. Nat. Metab. 2022;4:813–825. doi: 10.1038/s42255-022-00610-z. - DOI - PMC - PubMed
    1. Gamazon ER, et al. Using an atlas of gene regulation across 44 human tissues to inform complex disease- and trait-associated variation. Nat. Genet. 2018;50:956–967. doi: 10.1038/s41588-018-0154-4. - DOI - PMC - PubMed
    1. Barbeira AN, et al. Exploiting the GTEx resources to decipher the mechanisms at GWAS loci. Genome Biol. 2021;22:49. doi: 10.1186/s13059-020-02252-4. - DOI - PMC - PubMed
    1. Finucane HK, et al. Heritability enrichment of specifically expressed genes identifies disease-relevant tissues and cell types. Nat. Genet. 2018;50:621–629. doi: 10.1038/s41588-018-0081-4. - DOI - PMC - PubMed