. 2024 Jun 7;15(1):4879.
doi: 10.1038/s41467-024-49198-w.

Protein translation rate determines neocortical neuron fate

Affiliations

Protein translation rate determines neocortical neuron fate

Ekaterina Borisova et al. Nat Commun. .

Abstract

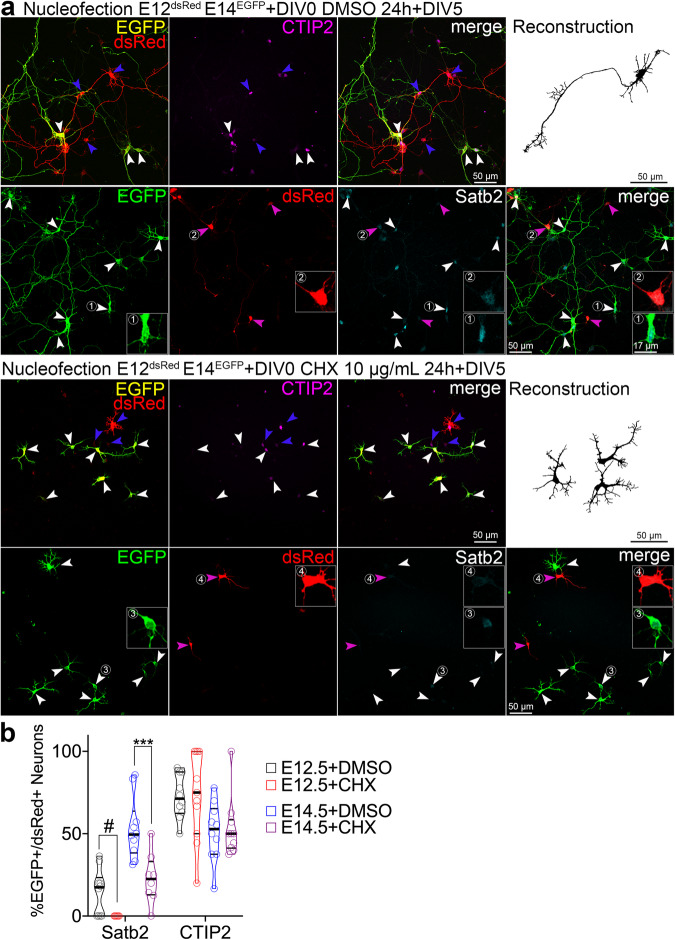
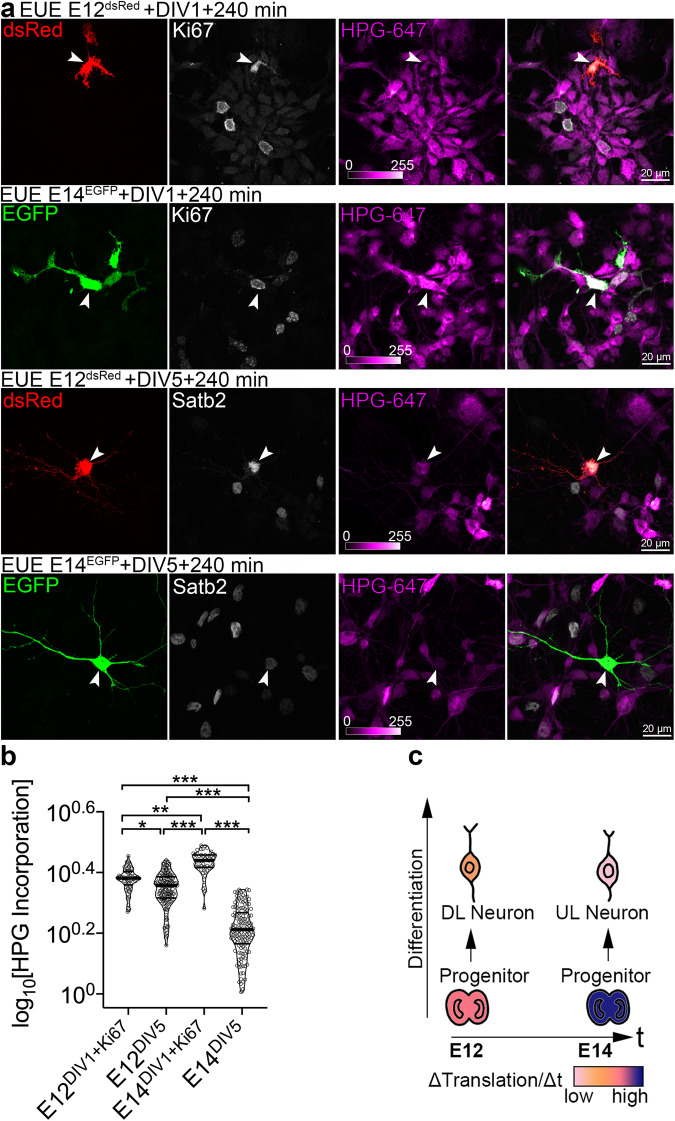
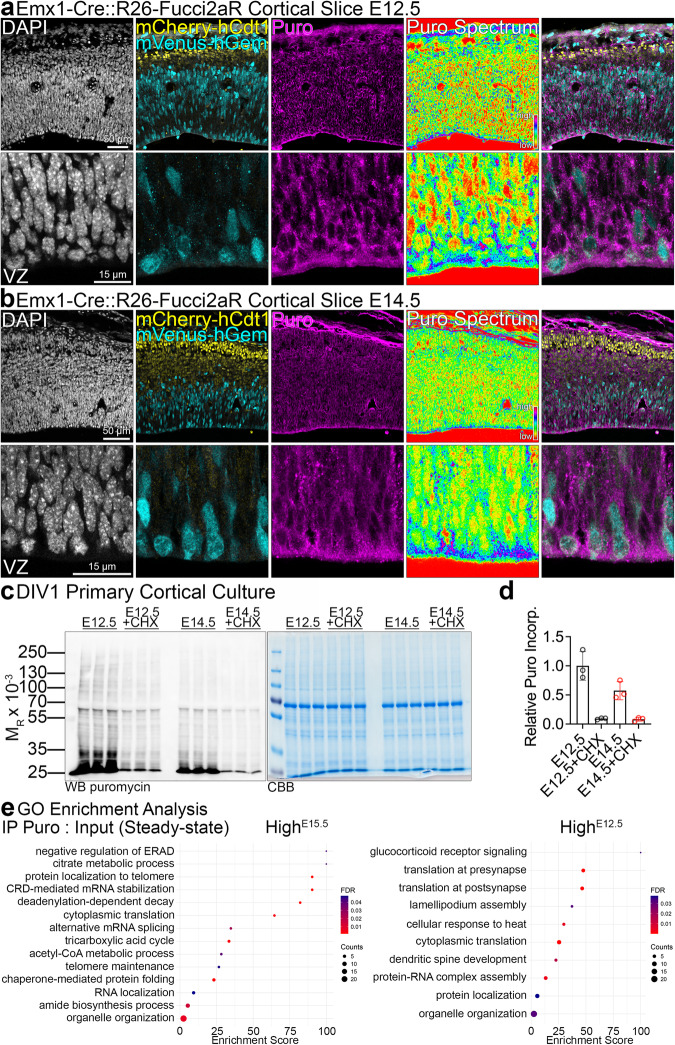
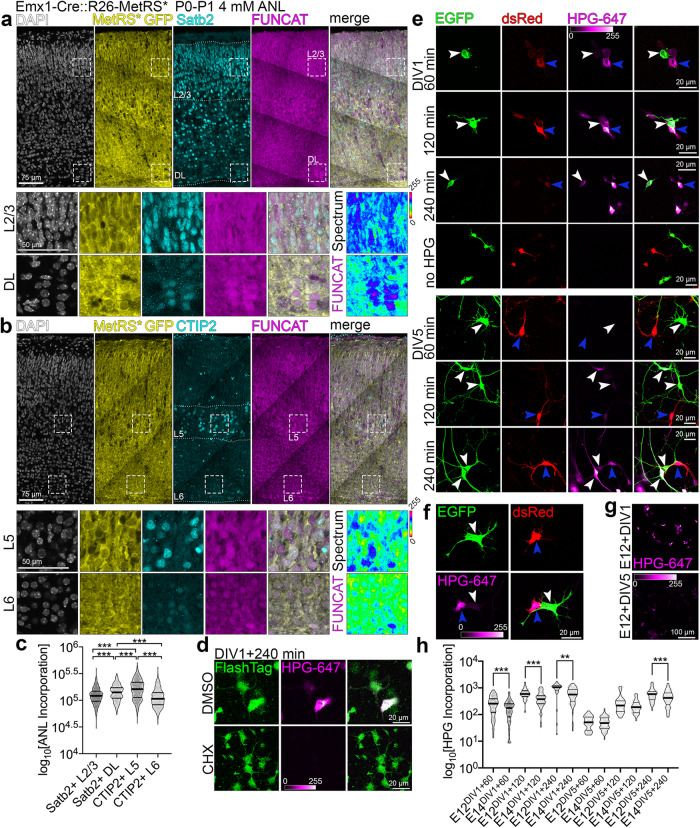
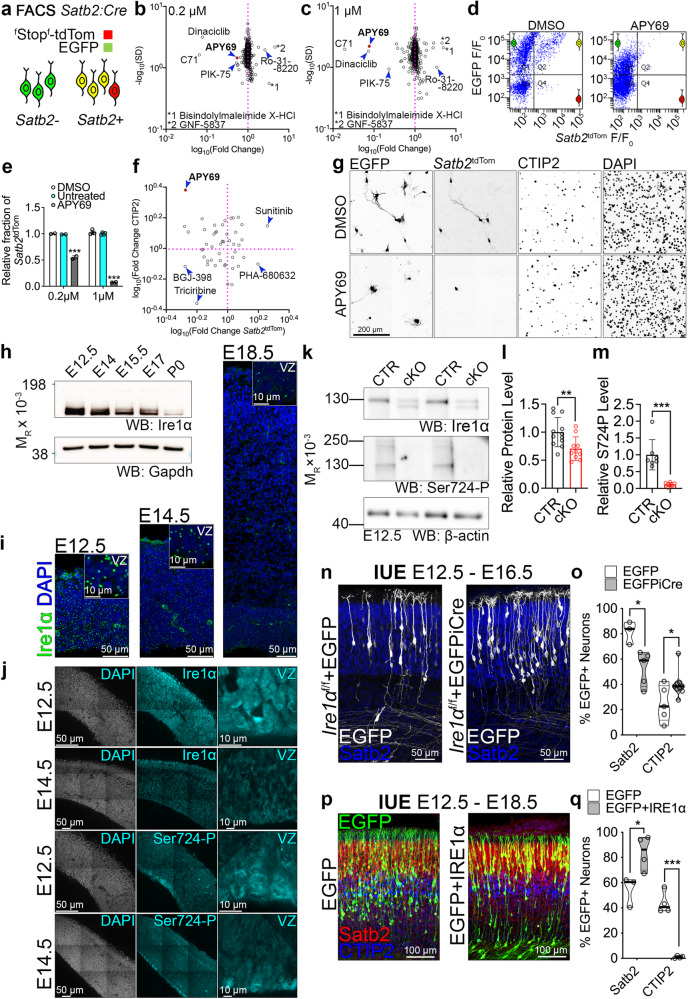
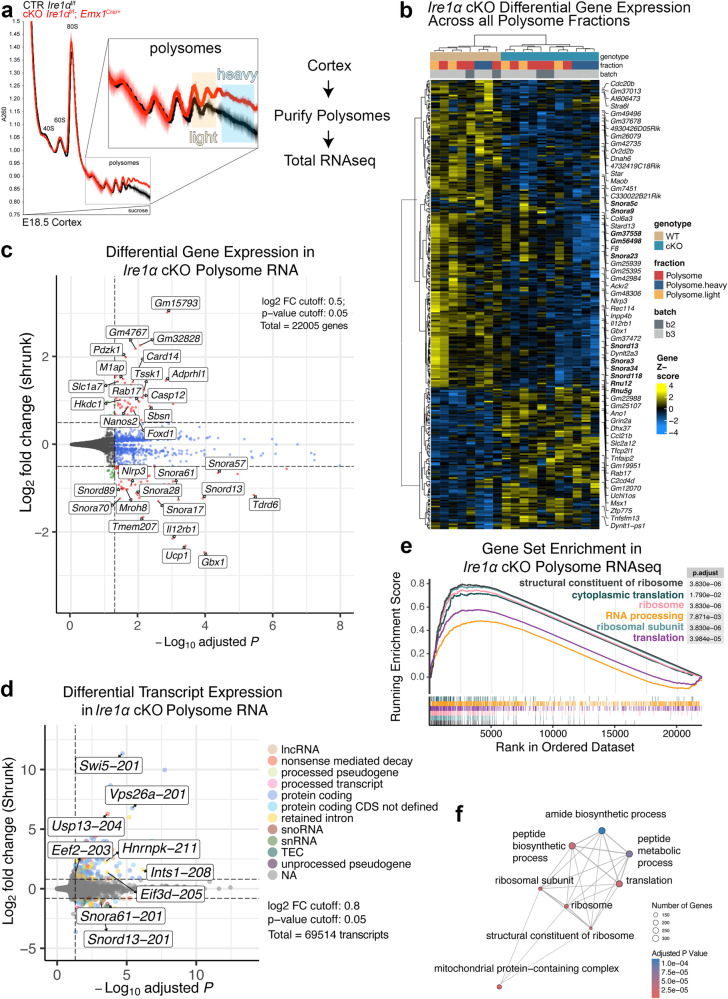
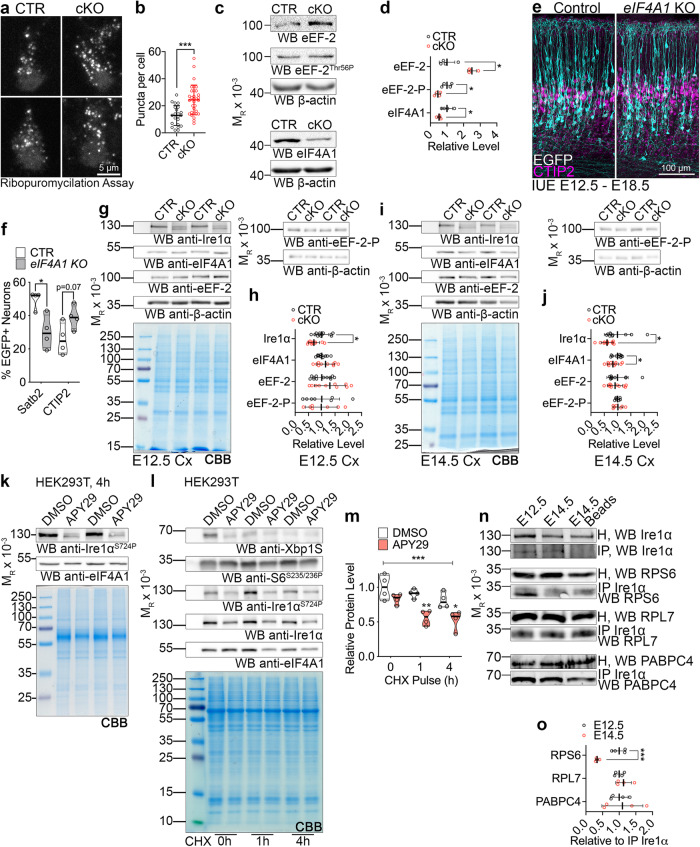
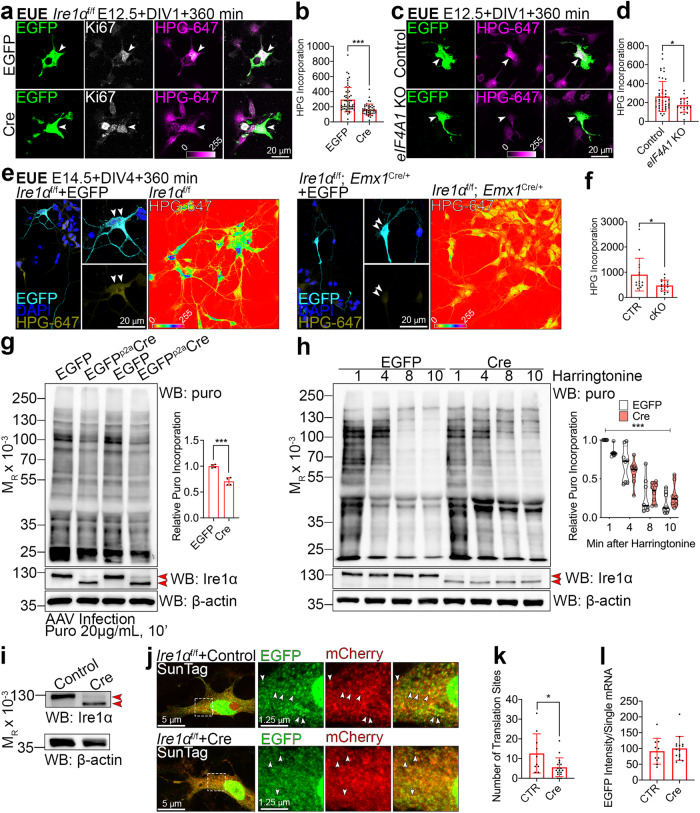
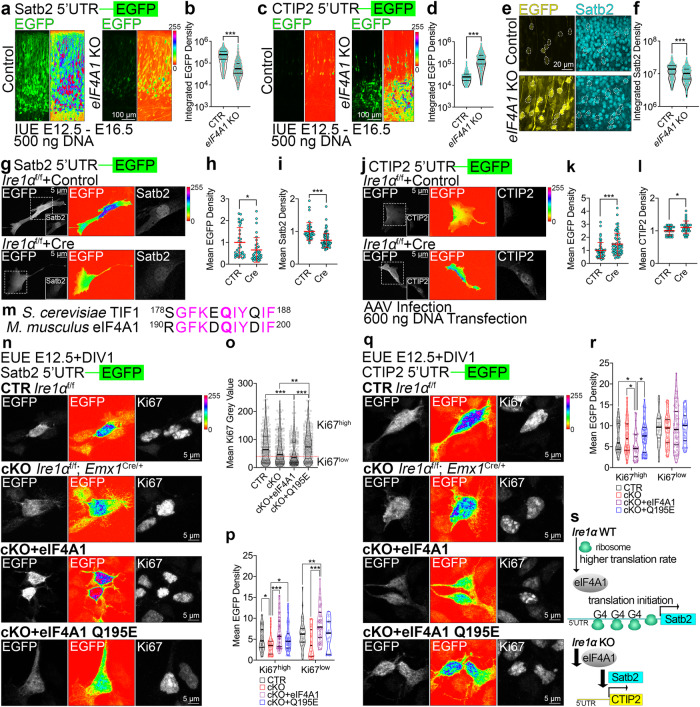
The mammalian neocortex comprises an enormous diversity regarding cell types, morphology, and connectivity. In this work, we discover a post-transcriptional mechanism of gene expression regulation, protein translation, as a determinant of cortical neuron identity. We find specific upregulation of protein synthesis in the progenitors of later-born neurons and show that translation rates and concomitantly protein half-lives are inherent features of cortical neuron subtypes. In a small molecule screening, we identify Ire1α as a regulator of Satb2 expression and neuronal polarity. In the developing brain, Ire1α regulates global translation rates, coordinates ribosome traffic, and the expression of eIF4A1. Furthermore, we demonstrate that the Satb2 mRNA translation requires eIF4A1 helicase activity towards its 5'-untranslated region. Altogether, we show that cortical neuron diversity is generated by mechanisms operating beyond gene transcription, with Ire1α-safeguarded proteostasis serving as an essential regulator of brain development.


Conflict of interest statement

The authors declare no competing interests.

Figures

Fig. 1
Fig. 1. Neuronal Satb2 expression requires a critical window of protein translation in precursor cells.
a Images of immunolabeled primary cells from E12.5 embryos nucleofected to express dsRed, and from E14.5 embryos to express EGFP, mixed and plated on a single glass coverslip. Two hours post-plating, cells were treated with vehicle (DMSO) or cycloheximide (CHX) for 20 hours, followed by medium change, and fixed at day-in-vitro 5 (DIV5). Upper panels show staining using rat anti-CTIP2, goat anti-EGFP, and rabbit anti-RFP, the latter one recognizing both EGFP and dsRed. For this reason, E12.5 cells in this case were recognized as solely expressing dsRed (blue arrowheads), but the E14.5 ones, both EGFP and dsRed (white arrowheads). Lower panels show anti-Satb2, anti-EGFP and anti-dsRed immunostaining with no cross-reacting antibodies; in this case, E12.5-derived cells express dsRed (blue arrowheads) and E14.5 ones EGFP (white arrowheads), as expected. Representative neuronal morphology is demonstrated as a semi-automated, EGFP- or dsRed-based reconstruction. (1-2) Example E14.5 (1,3) or E12.5 (2,4) cortex-derived cells immunolabeled with an antibody anti-Satb2. b Quantification of the cell identity markers in DIV5 neurons derived from E12.5 or E14.5 cortex. Lines on violin plot indicate median and quartiles. For statistics, Satb2, one-way ANOVA with Bonferroni’s multiple comparisons test; E14.5 + DMSO vs. E14.5 + CHX, p = 0.0007; CTIP2, Kruskal-Wallis test with Dunn’s multiple comparisons test. # indicates a comparison between fractions of Satb2-positive E12.5 DMSO- and E12.5 CHX-treated group, the latter represented by no positive cells. Data were collected from three independent cultures. *** p < 0.001. Refer to Supplementary Data S1 for detailed information on numerical values.
Fig. 2
Fig. 2. Progenitors of later-born neurons display translation rate upregulation.
a Images of primary DIV1 and DIV5 cortical cells immunolabeled for EGFP, dsRed, Ki67, and Satb2. To target Ki67-positive neuronal progenitors and their derived progeny, cortices of E12 embryos were ex utero electroporated (EUE) to express dsRed, and cortices of E14 embryos to express EGFP. Cells were triturated, mixed, plated together on a glass coverslip and pulsed with L-homopropargylglycine (HPG) for 240 min prior to fixation at DIV1 and DIV5. White arrowheads indicate representative cells. b Incorporation of HPG was detected using click reaction with Alexa-647 (HPG-647) and quantified as intensity of fluorescence signal normalized to the cell surface area. c Schematic summarizing the translation rates (ΔTranslation/Δt) in different types of cortical cells from E12- and E14-derived lineage. Deeper layers, DL; upper layers, UL. Violin plots on (b) represent per cell quantifications, thick line median and thin lines quartiles. Quantifications comprise data from three independent cultures. For statistics, D’Agostino-Pearson normality test and Kruskal-Wallis test with Dunn’s multiple comparisons test. Statistical tests were two-sided. For exact p values, please refer to Supplementary Data S1. *** p < 0.001; 0.001 <** p < 0.01; 0.01 <* p < 0.05.
Fig. 3
Fig. 3. The translatome of early and late cortical lineages.
a, b Representative images of anti-puromycin (Puro) immunolabeled slice cultures from E12.5 and E14.5 cortices. Panels labeled Puro Spectrum are intensity encoding renderings of Puro incorporation. Ventricular zone, VZ. The slice culture experiment was repeated three times with similar Puro labeling pattern. c, d Anti-puromycin Western blotting in E12.5 or E14.5 primary cortical cultures at DIV1, pulsed with puromycin and treated with CHX, and Puro incorporation quantification. CBB, Coomassie Brilliant Blue stain to visualize proteins in SDS-PAGE gels. e Summary of GO enrichment analysis based on the normalized abundance of identified proteins in the IP fraction in E15.5 and E12.5 cultures. Refer to Supplementary Data S2 for a full dataset and to Data Availability section for the information on data deposition. Bar graphs show individual data points and averages ± S.D. For statistics on (d), D’Agostino-Pearson normality test and Kruskal-Wallis test with Dunn’s multiple comparisons test, n = 3 biological replicates per each condition.
Fig. 4
Fig. 4. Subtypes of cortical neurons display different protein synthesis rates.
a b Representative images of coronal cortical sections immunolabeled for indicated marker proteins and after click chemistry-based conjugation of ANL and Alexa-647. Squares with dotted outlines represent respective magnified regions. Layer 2/3, L2/3; deep layers, DL. FUNCAT Spectrum represents an intensity encoding rendering of the ANL incorporation signal in each cell, quantified in (c). d DIV1 primary cortical cells from E14 cortex, fed with HPG for 240 min in presence of DMSO or 10 µg/mL cycloheximide (CHX). Note strongly reduced HPG labeling in cells cultured with CHX. FlashTag was added to the medium to label all cells. e Images of primary cortical cells immunolabeled for EGFP (white arrowheads) and dsRed (blue arrowheads), pulsed with HPG for indicated amount of time before fixation at DIV1 and DIV5. HPG was detected with far-red fluorophore-coupled azide. f DIV1 primary cortical cells from e fed with HPG for 240 min. Note significantly higher HPG uptake in E12 cortex-derived immature neurons. g HPG labeling in primary neurons at DIV1 and DIV5 prepared from E12 cortex. Note significantly higher HPG uptake in primary cultures at DIV1. h Incorporation of HPG was quantified as intensity of fluorescence signal normalized to the cell surface in primary neurons. Violin plots on c and h represent data points, thick lines median and thin lines quartiles. Statistics for c and h D’Agostino-Pearson normality test; c one-way ANOVA with Tukey multiple comparisons; h two-tailed Mann-Whitney tests; for DIV1 60 min and 120 min, p < 0.0001; DIV1 240 min, p = 0.002; DIV5 60 min, p = 0.4888; DIV5 120 min, p = 0.1441; DIV5 240 min, p = 0.0009. For exact p values on c please refer to Supplementary Data S1.*** p < 0.001; 0.001 <** p < 0.01; 0.01 <* p < 0.05.
Fig. 5
Fig. 5. Small molecule screening reveals Ire1α activity pivotal for Satb2 expression in cortical neurons.
a Screening workflow to identify signaling pathways upstream of Satb2 neuronal identity. b, c The results of the screening using two concentrations of each drug. Each dot represents a tested inhibitor. For full dataset, refer to Supplementary Data S3. Compound 71, C71. d Representative results of flow cytometry of DIV2 neurons treated with DMSO and APY69, a selective inhibitor of Ire1α. e Quantification of the proportion of Satb2-positive neurons. Because of the sheer number of the samples analyzed in the screening, we derived the statistics from two biological replicates per compound per each inhibitor dose. The screening data is further validated on Figs. 5f-5g. fg Immunohistochemical screening validation. f DIV2 neurons were immunostained for tdTom and CTIP2 and their proportions were quantified. g Representative immunostaining results for DMSO- and APY69-treated cortical neurons. h Western blotting in cortical lysates to profile developmental expression of Ire1α. Gapdh, loading control. i Fluorescence in situ hybridization for Ire1α in cortical sections at indicated developmental stages. Insets demonstrate enlarged fragments of the ventricular zone (VZ). j Representative immunostainings in E12.5 and E14.5 wild-type cortices using indicated antibodies. k Representative results of Western blotting in E12.5 cortical lysates from Ire1αf/f (CTR) or Ire1αf/f; Emx1Cre/+ (cKO) embryos. l,m Quantification of the results from k. n Representative images of immunostaining against EGFP and Satb2 in E16.5 coronal cortical sections of Ire1αf/f embryos after in utero electroporation (IUE) at E12.5 with plasmids encoding for EGFP or EGFP and Cre simultaneously. o Quantification of neuronal cell identity after IUE described in n. p Representative images of cortical coronal sections at E18.5 after IUE in wild-type E12.5 embryos to express EGFP, or EGFP and human IRE1α. q Quantification of neuronal cell identity after IUE described in p. For n and p compare Fig. S13. For h and k compare Fig. S14. Bar graphs show individual data points and averages ± S.D. Thick lines on violin plots represent median, thin lines represent quartiles. Statistics for e one-way ANOVA with Bonferroni post-hoc test; l Mann-Whitney test, ncortices for CTR = 12 and for cKO=10, p = 0.0082; m unpaired t-test with Welch’s correction, ncortices for CTR = 7 and for cKO=7, p = 0.0006; o D’Agostino-Pearson normality test and unpaired t-test, for Satb2 counts, nbrains for EGFP = 3 and for EGFPiCre = 4, p = 0.0185, and for CTIP2 counts, nbrains for EGFP = 5 and for EGFPiCre = 9, p = 0.0372; q D’Agostino-Pearson normality test and unpaired t-test, for Satb2 counts, nbrains for EGFP = 3 and for IRE1α = 4, p = 0.0313, and for CTIP2 counts, nbrains for EGFP = 4 and for IRE1α = 4, p < 0.0001. Statistical tests were two-sided. *** p < 0.001; 0.001 <** p < 0.01; 0.01 <* p < 0.05.
Fig. 6
Fig. 6. Polysome-enriched transcripts in Ire1α cKO encode proteins regulating constituents of the ribosome and protein translation machinery.
a Analytic density gradient fractionation of A260-normalized E18.5 neocortex lysates, measuring the relative abundance of ribosomal subunits, 80S ribosomes, and polysomes. A260 curves plotted as mean ± S.D. across replicate fractionations in one experimental batch, baseline (1.0) centered at onset of 40S peak. b Differential Gene Expression across all polysome fractions in Ire1αf/f control (WT) and Ire1αf/f; Emx1Cre/+ (cKO) cortices. In bold are small nucleolar RNAs and components of spliceosome. c Volcano plot summarizing the Differential Gene Expression in control and cKO polysome RNAs. Indicated are hits with altered expression levels between genotypes. d Volcano plot summarizing Differential Transcript Expression in control and cKO polysome RNAs. e Top GSEA plots for cKO polysome RNA fraction versus control polysome RNA fraction. f Enrichment map visualization of cellular processes represented by significantly changed transcripts within the polysome fractions between control and cKO cortices. For statistics, we used DESeq2 which employs the Wald test to test the null hypothesis that gene expression in a generalized linear model fit with a negative binomial distribution is zero, and adjusts p values using the Benjamin Hochberg (BH) procedure. Unique genes with adjusted p values < 0.05 and log2foldchange > 0.5 were determined to be differentially expressed. For detailed datasets, refer to Supplementary Data S4 and to Data Availability section for the information on data deposition.
Fig. 7
Fig. 7. Ire1α-mediated regulation of protein translation in the developing cortex.
a Images of representative primary cortical neurons prepared from Ire1αf/f (CTR) or Ire1αf/f; Emx1Cre/+ (cKO) cortices after ribopuromycilation assay to label stalled ribosomes. b Quantification of ribosome stalling in (a). c Representative Western blotting results using the control and Ire1α cKO E18.5 cortical lysates. d Quantifications of the protein level from c. Representative images of immunostaining against EGFP and CTIP2 in E18.5 coronal cortical sections of wild-type embryos after IUE at E12.5 with gRNAs and Cas9 nickase to achieve indicated genotypes. f Quantification of neuronal cell identity in the experiment in (e). gj Representative Western blotting results using the control and Ire1α cKO cortical lysates at indicated developmental stages and quantification of protein levels. Note that the quantification for Ire1α levels in (h) is identical with Fig. 5l. Coomassie brilliant blue, CBB. k Representative Western blotting results of HEK293T cells after 4 h pulse with indicated compound. l-m Representative Western blotting of CHX pulse experiment in HEK293T treated with indicated compounds and quantification. n Representative Western blotting results of endogenous Ire1α co-immunoprecipitation (IP) from E12.5 and E14.5 cortical homogenates (H). j Interaction between Ire1α and indicated proteins was quantified relative to the amount of immunoprecipitated Ire1α. Graphs represent data points and averages ± S.D. Thick lines on violin plots represent median, thin lines represent quartiles. CBB, Coomassie Brilliant Blue stain to visualize proteins in SDS-PAGE gels. Statistics for b, d, f, h, j and o D’Agostino-Pearson normality test; for b unpaired t-test, ncells for CTR = 22 and for cKO=32 from three independent cultures, p < 0.0001; d Mann–Whitney test, ncortices for CTR = 4 and for cKO=4, for eEF-2, p = 0.0286; for eEF-2-P, p = 0.0286; for eIF4A1, p = 0.0286; f unpaired t-test, for Satb2 counts, nbrains for CTR = 4 and for KO = 4, p = 0.0140, and for CTIP2 counts, nbrains for CTR = 4 and for KO = 4, p = 0.0691; h Mann–Whitney test, for Ire1α, ncortices for CTR = 12 and for cKO=10, p = 0.0169; for eIF4A1, ncortices for CTR = 12 and for cKO=10, p = 0.3463; for eEF-2, ncortices for CTR = 12 and for cKO = 10, p = 0.2276; for eEF-2-P, ncortices for CTR = 7 and for cKO = 7, p > 0.9999; j unpaired t-test, for Ire1α, ncortices for CTR = 10 and for cKO = 11, p = 0.0284; for eIF4A1, ncortices for CTR = 10 and for cKO = 11, p = 0.0494; for eEF-2, ncortices for CTR = 10 and for cKO = 11, p = 0.5561; for eEF-2-P, ncortices for CTR = 7 and for cKO=7, p = 0.8440; m two-way ANOVA with Šidák multiple comparisons test, n = 4 biological replicates, p < 0.0001; o unpaired t-test, ncortices for E12.5 = 4 and for cKO=4; for RPS6, p = 0.0.0007, for RPL7, p = 0.3751, for PABPC4, p = 0.7826. Statistical tests were two-sided. 0.01 <* p < 0.05; 0.001 <** p < 0.01; *** p < 0.001.
Fig. 8
Fig. 8. Loss of Ire1α leads to diminished translation rates as an effect of slower elongating ribosomes and fewer translation sites.
a, c, e Images of representative primary cortical neurons prepared from Ire1αf/f a wild-type c or control and Ire1α cKO e embryos after ex utero electroporation (EUE) at E12.5 (a and c) or E14.5 e with indicated plasmids. Neurons were fed L-homopropargylglycine (HPG) for 360 min prior to fixation at DIV1 or DIV4. HPG was detected with Sulfo-Cyanine5 azide. e Right panels: images of HPG incorporation in control and cKO primary DIV4 neurons prepared from E14.5 cortex. White arrowheads point to Ki67-positive progenitors (a and c) or to somata of neurons derived from E14.5 progenitors (e). b, d, f Quantification of HPG incorporation. g Representative Western blotting using DIV5 lysates from Ire1αf/f mouse embryonic fibroblasts (MEFs) after metabolic labeling of protein synthesis using puromycin (puro) and its quantification. MEFs were infected at DIV0 with control or Cre-expressing AAVs. Red arrowheads point to wild-type and KO form of Ire1α. h Representative Western blotting results of ribosome run-off assay using puromycin in control and KO MEFs at indicated timepoints after harringtonine treatment and quantification. i Western blotting validation of Ire1α KO in AAV-infected MEFs for the SunTag reporter experiment. j Representative images of empty and Cre-encoding virus infected MEFs expressing the SunTag24x-BFP-PP7 reporter. k Active translation sites were quantified in fixed MEFs. l Quantification of the intensity of scFv-GFP at translation sites. Bar graphs represent data points and averages ± S.D. Violin plot on h represents individual data points, thick line median and thin lines quartiles. Statistics for b, d, f, k, l D’Agostino-Pearson normality test; for b Mann-Whitney test, ncells for EGFP = 58 and for Cre = 42 from three independent cultures, p < 0.0001; d Mann–Whitney test, ncells for Control=54 and for Cre=21 from three independent cultures, p = 0.0291; f Mann-Whitney test, ncells for EGFP = 15 and for Cre=19 from three independent cultures, p = 0.0169; g Shapiro-Wilk and unpaired t-test, four independent cultures, p = 0.0003; h two-way ANOVA with Bonferroni multiple comparisons test, eight independent experiments, p < 0.0001; k Mann–Whitney test, ncells for CTR = 10 and for Cre=17 from three independent cultures, p = 0.0438; l unpaired t-test, ncells for CTR = 10 and for Cre=15 from three independent cultures, p = 0.58. Statistical tests were two-sided. 0.01 <* p < 0.05; *** p < 0.001.
Fig. 9
Fig. 9. Helicase activity of eIF4A1 and Ire1α are indispensable for translation of Satb2 in cortical lineages.
a, c Representative images of EGFP fluorescence signals in the E16.5 brain sections after IUE at E12.5 with CRISPR-Cas9 vectors to achieve indicated genotypes and Satb2 5’UTR a or CTIP2 5’UTR c translation reporter construct. Shown are the native signals (left panels) and intensity encoding (right panels). b, d Quantification of EGFP fluorescence signals in single cells expressing translation reporters of Satb2 5’UTR b or CTIP2 d. e, f Representative images and quantification of CTIP2 5’UTR translation reporter construct and anti-Satb2 immunolabeling (compare c, d). gl Representative images of EGFP fluorescence signals (left panels: gray scale, middle panels: intensity encoding) and immunostaining for Satb2 g or CTIP2 j in Ire1αf/f MEFs infected with Control or Cre-encoding AAVs at DIV0. At DIV5, infected MEFs were transfected with indicated reporter constructs, fixed and immunostained at DIV6. h, k Quantification of EGFP mean fluorescence signals of 5’UTR Satb2 reporter h or CTIP2 (k). i, l Quantification of mean nuclear fluorescence signals after immunostaining for Satb2 i or CTIP2 (l). m Sequence alignment of yeast TIF1 and murine eIF4A1. In bold the Q residue crucial for helicase activity. nr Early cortical progenitors of indicated genotypes were transfected with EUE with Satb2 n or CTIP2 q translational reporter, as well as indicated constructs. At DIV1, cells were fixed and immunolabeled against EGFP and Ki67. o Quantification of overall Ki67 fluorescence intensity in analyzed cells. p, r Quantification of translational reporter fluorescence in Ki67 expression level-dependent manner. s Current model of Ire1α and eIF4A1 interplay in regulation of neuronal cell diversity in the cortex. Violin plots depict median, interquartile range (box) and minimum and maximum value (whiskers). Red line and error bars on h, i, k, l indicate mean ± S.D. For statistical analyses, b, d, f, h,i, k, l D’Agostino and Pearson normality test and Mann-Whitney test; o, p, r D’Agostino and Pearson normality test and Kruskal-Wallis test with Dunn’s correction. For b, d, f p < 0.0001; for exact p values in o, p, r refer to Supplementary Fig. 1. For h ncells for CTR = 33 and for Cre = 35, p = 0.0105; i ncells for CTR = 39 and for Cre = 85, p < 0.0001; k ncells for CTR = 53 and for Cre = 58, p = 0.0003; l ncells for CTR = 30 and for Cre = 30, p = 0.0388. Results on h-i and k-l represent quantifications from three independent cultures. Statistical tests were two-sided. 0.01 <* p < 0.05; 0.001 <** p < 0.01; *** p < 0.001.

References

    1. Arimura N, Kaibuchi K. Key regulators in neuronal polarity. Neuron. 2005;48:881–884. doi: 10.1016/j.neuron.2005.11.007. - DOI - PubMed
    1. Barnes AP, et al. LKB1 and SAD kinases define a pathway required for the polarization of cortical neurons. Cell. 2007;129:549–563. doi: 10.1016/j.cell.2007.03.025. - DOI - PubMed
    1. Götz M, Stoykova A, Gruss P. Pax6 controls radial glia differentiation in the cerebral cortex. Neuron. 1998;21:1031–1044. doi: 10.1016/S0896-6273(00)80621-2. - DOI - PubMed
    1. Malatesta P, Hartfuss E, Götz M. Isolation of radial glial cells by fluorescent-activated cell sorting reveals a neuronal lineage. Development. 2000;127:5253–5263. doi: 10.1242/dev.127.24.5253. - DOI - PubMed
    1. Rakic P. Mode of cell migration to the superficial layers of fetal monkey neocortex. J. Comp. Neurol. 1972;145:61–83. doi: 10.1002/cne.901450105. - DOI - PubMed

MeSH terms