. 2024 Jun 7;15(1):4857.
doi: 10.1038/s41467-024-48721-3.

Development of an improved blood-stage malaria vaccine targeting the essential RH5-CyRPA-RIPR invasion complex

Affiliations

Development of an improved blood-stage malaria vaccine targeting the essential RH5-CyRPA-RIPR invasion complex

Barnabas G Williams et al. Nat Commun. .

Abstract

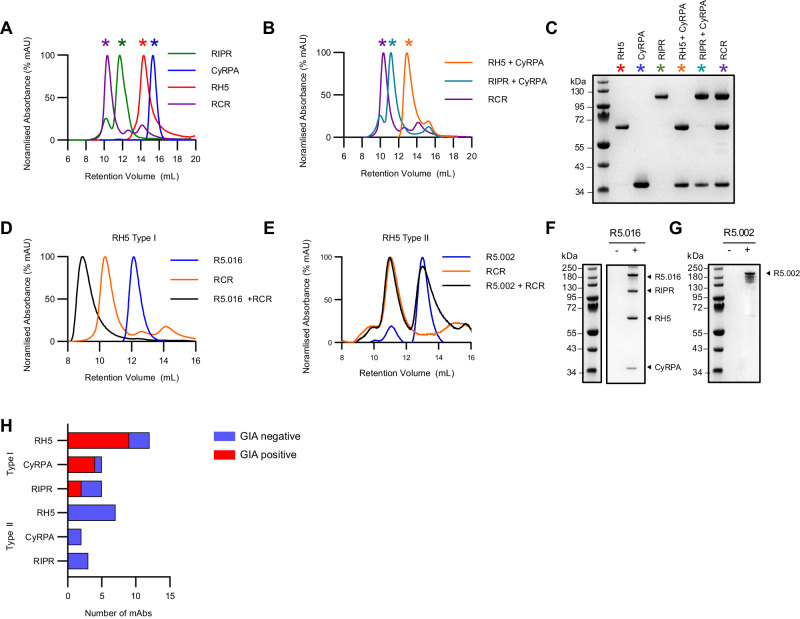
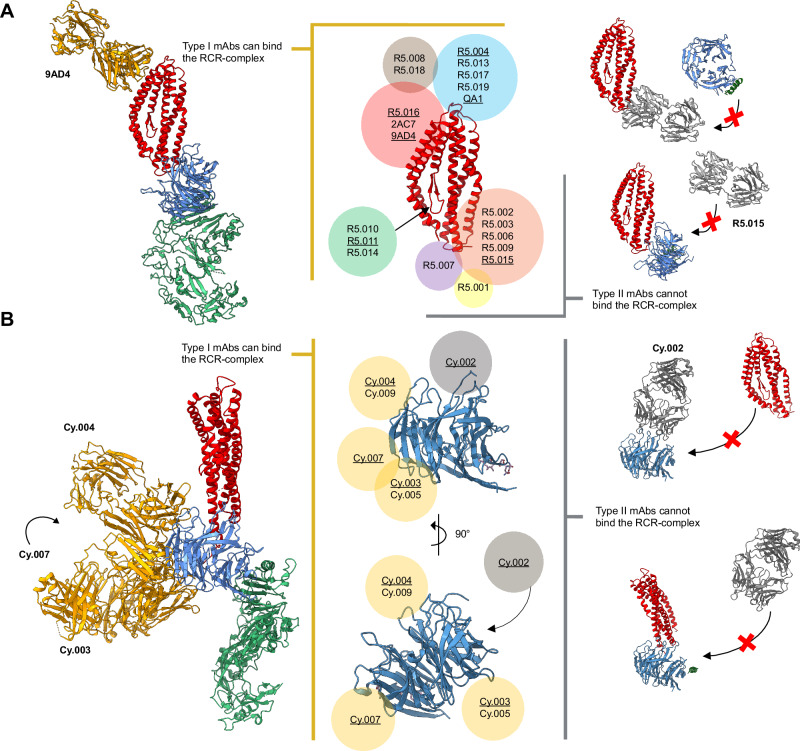
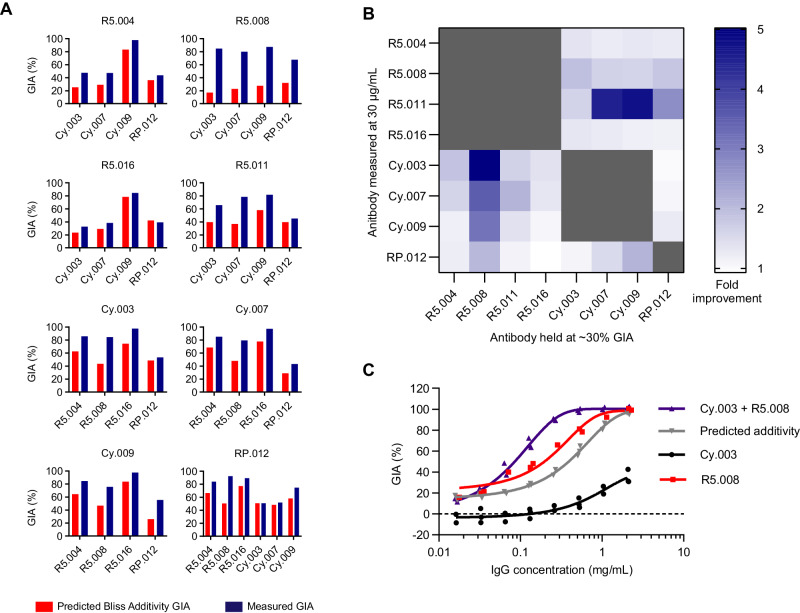
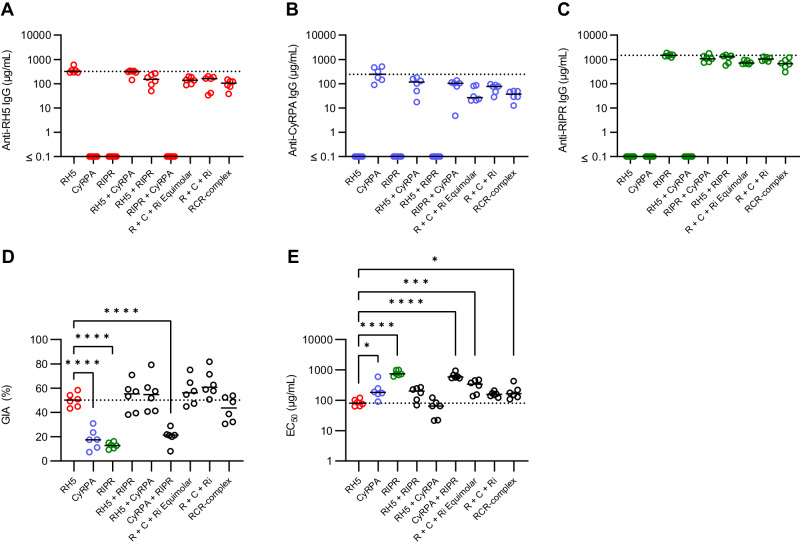
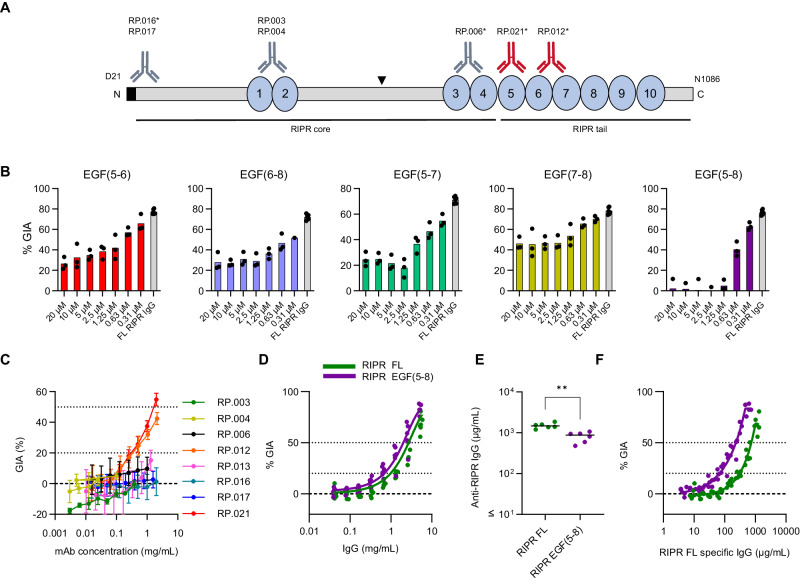
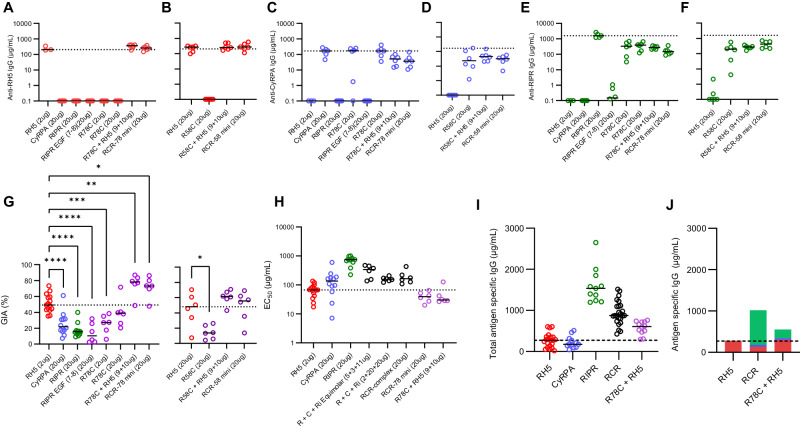
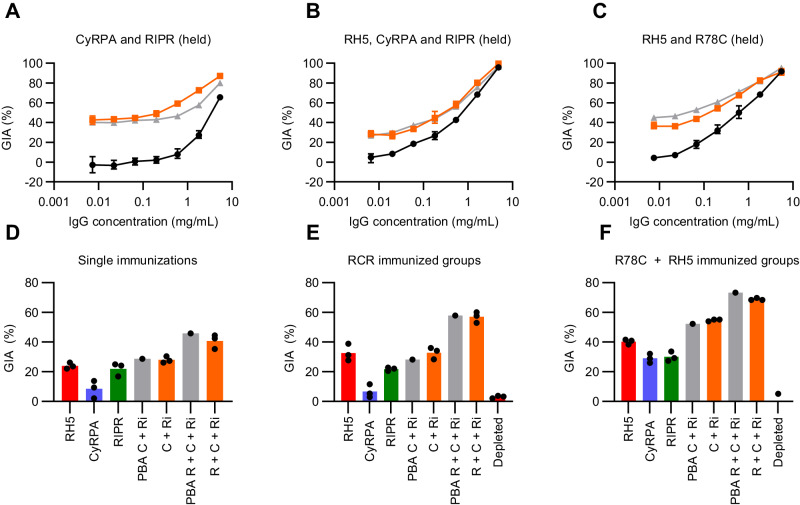
Reticulocyte-binding protein homologue 5 (RH5), a leading blood-stage Plasmodium falciparum malaria vaccine target, interacts with cysteine-rich protective antigen (CyRPA) and RH5-interacting protein (RIPR) to form an essential heterotrimeric "RCR-complex". We investigate whether RCR-complex vaccination can improve upon RH5 alone. Using monoclonal antibodies (mAbs) we show that parasite growth-inhibitory epitopes on each antigen are surface-exposed on the RCR-complex and that mAb pairs targeting different antigens can function additively or synergistically. However, immunisation of female rats with the RCR-complex fails to outperform RH5 alone due to immuno-dominance of RIPR coupled with inferior potency of anti-RIPR polyclonal IgG. We identify that all growth-inhibitory antibody epitopes of RIPR cluster within the C-terminal EGF-like domains and that a fusion of these domains to CyRPA, called "R78C", combined with RH5, improves the level of in vitro parasite growth inhibition compared to RH5 alone. These preclinical data justify the advancement of the RH5.1 + R78C/Matrix-M™ vaccine candidate to Phase 1 clinical trial.


Conflict of interest statement

S.J.D. is an inventor on patent applications relating to RH5 or RCR-complex malaria vaccines and antibodies and is a co-founder of and shareholder in SpyBiotech. B.G.W., L.D.W.K., D.P., D.Q., A.M.L., S.E.S., J.R.B., K.M.H., D.G.W.A., A.D.D., J.J.I., and M.K.H. are inventors on patent applications relating to RH5 and/or RCR-complex malaria vaccines and/or antibodies. J.J. is an inventor of patent applications relating to vaccines made using spontaneous amide bond formation and is a co-founder of and shareholder in SpyBiotech. R.A.D. is an inventor of patent applications relating to vaccines made using spontaneous amide bond formation and a shareholder in SpyBiotech. All other authors have declared that no competing interests.

Figures

Fig. 1
Fig. 1. Characterisation of mAb binding to the RCR-complex.
A Size exclusion chromatograms demonstrating RCR-complex formation between RH5, CyRPA and RIPR, and (B) demonstrating binary complex formation between RH5+CyRPA, and RIPR+CyRPA. C Non-reducing SDS-PAGE gel assessing binary and ternary complex formation. Coloured asterisks on chromatograms indicate which gel lanes correspond to the peaks in panels (A) and (B). Representative example of three independent experiments shown. D Size exclusion chromatogram showing a representative example of complex formation analysis between the RCR-complex and anti-RH5 mAb R5.016 [Type I, GIA-positive], and (E) anti-RH5 mAb R5.002 [Type II, GIA-negative]. F Non-reducing SDS-PAGE gel of co-immunoprecipitation of the pre-formed recombinant RCR-complex without (-) or with (+) mAb R5.016 [Type I, GIA-positive] or (G) mAb R5.002 [Type II, GIA-negative] bound to protein G agarose beads. Representative examples are shown. A representative example of two independent experiments is shown. H Bar chart summarising the number of Type I and Type II mAbs for each antigen and whether these mAbs show GIA. Source data are provided as a Source Data file.
Fig. 2
Fig. 2. Available structural data concur with classification of mAbs as Type I or Type II.
A Crystal structure of RH5 (centre, red) with mAb epitope bins overlaid (coloured circles). Antibody clusters were identified as Type I (left, yellow box) and Type II (right, grey box) depending on their ability to bind to the RCR complex. Anti-RH5 mAbs with available crystal structures of their Fab bound to RH5 are underlined. The RH5 (red), CyRPA (blue), RIPR (green) and 9AD4 or R5.015 Fab complex structures (left and right of centre, respectively) are a composite of published structures (PDB: 4U0Q, 7PHU, 6MPV and 8CDD) that concur with Type I (gold) or Type II (grey) mAb classification. B Crystal structure of CyRPA (centre, blue) with mAb epitope bins overlaid (coloured circles). Antibody clusters were identified as Type I (left, gold circles) and Type II (right, grey circles) depending on their ability to bind to the RCR complex. Anti-CyRPA mAbs with available crystal structures of their Fab bound to CyRPA are underlined. The RH5 (red), CyRPA (blue), RIPR (green) and anti-CyRPA Fab (Cy.002, Cy.003, Cy.004, Cy.007) complex structures (left and right of centre, respectively) are a composite of published structures (PDB: 7PI3, 7P17 and 6MPV) that concur with Type I (gold) or Type II (grey) mAb classifications. The full RIPR structure has been excluded from the Type II mAb illustrations for clarity.
Fig. 3
Fig. 3. Demonstration of synergistic inter-antigen GIA of mAbs targeting the RCR-complex.
A Predicted growth inhibitory activity (GIA) based on Bliss additivity (red) compared to measured GIA (dark blue) for a mAb combination where one was held at 30 % GIA (X-axis) and the other measured at ~300 μg/mL (Title); R5.011 was held at 2 mg/mL (not 30 % GIA) due to R5.011 alone having no GIA activity. Complete dilution curves are shown in Figure S2. The bar indicates the mean across triplicate measurements. B Heat map summary of the fold improvement over Bliss additivity across the mAb panel. C Synergy GIA analysis of anti-RH5 mAb R5.008 combined with anti-CyRPA mAb Cy.003 in a 1:1 mixture (i.e., 1 mg/mL = 1 mg/mL Cy.003 or 0.5 mg/mL Cy.003 + 0.5 mg/mL R5.008). Grey: Cy.003 alone titration curve. Black: R5.008 alone titration curve. Red: predicted Bliss additivity GIA for a 1:1 mixture of Cy.003 and R5.008. Blue: measured data. Each data set fitted with a Richard’s five-parameter dose-response curve with no constraints. Individual data points are the mean of triplicate wells in each experiment; N = 2 independent experiments for R5.008 and N = 3 for Cy.003 alone and Cy.003 + R5.008 (1:1 mixture). Source data are provided as a Source Data file.
Fig. 4
Fig. 4. Immunisation with combinations of RH5, CyRPA and/or RIPR does not improve over immunisation with RH5 alone.
Wistar rats were immunised on days 0, 28 and 56. Terminal bleed was taken on day 70 (post-third dose). Doses of 2 µg RH5, and 20 µg CyRPA and RIPR antigen were used. For the “R + C+Ri” group, antigen doses were matched to the single antigen vaccination groups (2 µg RH5 + 20 µg CyRPA + 20 µg RIPR). For the “R + C+Ri Equimolar” group antigens were dose-matched to the RCR-complex (5.3 µg RH5 + 3.5 µg CyRPA + 11.1 µg). Day 70 serum IgG ELISA data (reported in µg/mL) shown against full-length (A) RH5 (red), (B) CyRPA (blue), and (C) RIPR (green). The dotted line corresponds to the median antigen-specific IgG response from the relevant group of single antigen-immunised animals. A summary of statistical analysis related to these panels can be found in Table S2. D Single-cycle GIA assays were performed using P. falciparum clone 3D7. Total IgG, purified from day 70 serum samples, was titrated in the GIA assay (see Supplementary Fig. 3B). GIA at 1 mg/mL total purified IgG was interpolated for each animal. The dotted line indicates the median RH5 GIA. Significance determined by one-way ANOVA with Dunnett’s multiple comparisons test versus RH5 group only, **** p < 0.0001. E Data from (D) were replotted against total antigen-specific IgG concentration in µg/mL as measured by ELISA in each purified total IgG sample (see Supplementary Fig. 3C). Each dataset was fitted with a Richard’s five-parameter dose-response curve with no constraints to ascertain the GIA assay EC50. The dotted line shows the median result for the RH5 only group for comparison. Individual and median group responses (N = 6 per group) are shown in all panels. Significance was determined by one-way ANOVA of log-transformed data with Dunnett’s multiple comparisons test versus the RH5 group only. * p < 0.05, ** p < 0.001, *** p < 0.0001, **** p < 0.0001. Source data are provided as a Source Data file.
Fig. 5
Fig. 5. EGF-like domains 5-8 of RIPR contain growth-inhibitory antibody epitopes.
A Schematic of the RIPR protein. Blue circles: EGF-like domains shown. Black triangle: PMX site. Black bars: core and tail regions. Anti-RIPR mAb binding sites; grey: GIA-negative mAbs; red: GIA-positive mAbs, asterisk indicates Type I mAbs. Type I mAb RP.013 could not be mapped. B Antigen reversal single-cycle GIA assay using P. falciparum clone 3D7 and pooled anti-RIPR IgG from rabbits (see Supplementary Fig. 5C). Anti-RIPR full-length (FL) total purified IgG was held at 3 mg/mL (grey bar) and the RIPR EGF proteins were titrated in the assay from 20 µM to 0.31 µM. Mean and data points (n = 3) are shown. C Eight anti-RIPR mAbs were titrated in a single-cycle GIA assay. GIA below the dotted line at 20 % is regarded as negative, the dotted line at 50 % GIA is included for clarity. Points are the mean of N = 3 replicates, error bars are the standard deviation (SD). D Wistar rats (N = 6/group) were immunised with RIPR FL (green) or RIPR EGF(5-8) (purple) protein formulated in Matrix-M™ adjuvant. GIA assay was performed using total IgG purified from day 70 serum samples. Data from each rat were pooled and fitted with a Richard’s five-parameter dose-response curve with no constraints. The dashed line shows 0 % GIA. The dotted lines show 20 % GIA and 50 % GIA for comparison. E Day 70 serum IgG ELISA data (reported in µg/mL) against full-length RIPR for rats immunised in (D). Dots represent individual animals and bars are median; ** p = 0.0022 by the two-tailed Mann-Whitney test. F Data from (D) replotted against RIPR FL-specific IgG concentration in µg/mL. Dashed line: 0 % GIA. Dotted lines: 20 % and 50 % GIA. Each data set was fitted with a Richard’s five-parameter dose-response curve with no constraints and the EC50 was calculated. Source data are provided as a Source Data file.
Fig. 6
Fig. 6. Immunisation with combinations of RH5 and R78C improves on immunisation with RH5 alone.
Wistar rats were immunised on days 0, 28 and 56. A terminal bleed was taken on day 70 (post-third dose). Combination (e.g., “R78C + RH5”) groups were given at equimolar ratios of 9 µg + 10 µg antigen respectively, whereas “mini” groups (e.g., “RCR-78 mini”) were given as 20 µg of the pre-formed complex. Day 70 serum IgG ELISA data (reported in µg/mL) showed against full-length (A, B) RH5 (red), (C, D) CyRPA (blue), and (E, F) RIPR (green). Dotted line: median antigen-specific IgG response from a reference group of single antigen immunised animals. A summary of statistical analysis can be found in Table S3. N = 6 animals per group (G) Single-cycle GIA assays. Total IgG, purified from day 70 serum samples, was titrated in the GIA assay (see Supplementary Fig. 8B). GIA at 1 mg/mL total purified IgG was interpolated. The dotted line indicates the median GIA for the RH5 alone group. Individual and median group responses are shown. Data include all animals from previous studies vaccinated identically with RH5, CyRPA or RIPR at the indicated dose. Significance determined by one-way ANOVA with Dunnett’s multiple comparisons test versus RH5 only group, * p < 0.0104, ** p < 0.0017, *** p < 0.0005, **** p < 0.0001. RH5: n = 15, CyRPA: n = 12, RIPR: n = 11, all other groups n = 6 biologically independent experiments. H GIA EC50 data from the indicated groups (from data in Supplementary Fig. 8C). The Dotted line indicates the median result for RH5-only immunised animals (2 µg dose) for comparison. RH5: n = 21, CyRPA: n = 12, RIPR: n = 11, RCR: n = 24, and R78C + RH5 n = 12 biologically independent experiments. I Combined day 70 serum IgG ELISA data (summed in µg/mL) for all three antigens across select vaccination groups receiving the same immunogens; 2 µg dose RH5 data is shown. The dashed line indicates the median result for RH5-only immunised animals for comparison. RH5: n = 15, CyRPA: n = 12, RIPR: n = 11, all other groups n = 6 biologically independent experiments. J Summary of data shown in (I) with the median contribution of each different antigen-specific IgG (in µg/mL) displayed for each immunisation group. RH5 (2 µg): red; CyRPA: blue; RIPR: green. The dashed line shows the median result for the RH5-only group for comparison. Source data are provided as a Source Data file.
Fig. 7
Fig. 7. Anti-RH5, -CyRPA, and -RIPR polyclonal vaccine-induced IgG show additive GIA.
Selected total IgG samples from rats vaccinated in Figs. 4 and 6 were titrated in a GIA assay using P. falciparum clone 3D7. A Anti-RIPR total IgG was held at 2.5 mg/mL (not shown, ~40 % GIA) with anti-CyRPA IgG titrated using a 5-fold dilution. Black: anti-CyRPA IgG alone; grey: Predicted Bliss Additivity (PBA) of the titrated anti-CyRPA IgG with the held anti-RIPR IgG; orange: measured result. Mean of N = 3 replicates, and SD shown. B Anti-RIPR and anti-CyRPA total IgG each held at 0.5 mg/mL (not shown, ~30 % GIA) with anti-RH5 IgG titrated using a 5-fold dilution series. Black: anti-RH5 alone; grey: PBA of the titrated anti-RH5 IgG with anti-CyRPA and anti-RIPR IgG held; orange: measured result. Mean of N = 3 replicates, and SD shown. C Anti-R78C total IgG was held at 1 mg/mL (not shown, ~30 % GIA) with anti-RH5 IgG titrated using a 5-fold dilution series. Black: anti-RH5 alone; grey: PBA of titrated anti-RH5 IgG with the held anti-R78C IgG; orange: measured result. Mean of N = 3 replicates, and SD shown. DF Single point GIA assay of purified antigen-specific IgG. Anti-RH5 (red), anti-CyRPA (blue), and anti-RIPR (green) each tested at a concentration aimed to give ~20 % GIA. “C + Ri”: anti-CyRPA IgG + anti-RIPR IgG mix; “R + C + Ri”: anti-RH5 + anti-CyRPA + anti-RIPR IgG mix. Antigen-specific IgG concentrations in each mix as per single antigen GIA experiments. PBA in grey; measured result in orange; depleted: post-purification IgG at 0.5 mg/mL. Mean of N = 3 technical replicates shown. Antigen-specific IgG purified from pooled sera from (D) single antigen immunised animals; (E) animals immunised with the RCR-complex; and (F) animals immunised with R78C + RH5. Source data are provided as a Source Data file.

References

    1. WHO. World Malaria Report 2023. 1-283 (2023).
    1. Draper SJ, et al. Malaria vaccines: recent advances and new horizons. Cell Host Microbe. 2018;24:43–56. doi: 10.1016/j.chom.2018.06.008. - DOI - PMC - PubMed
    1. Moorthy, V., Hamel, M. J. & Smith, P. G. Malaria vaccines for children: and now there are two. Lancet10.1016/S0140-6736(23)02743-5 (2024). - PubMed
    1. Takala SL, et al. Extreme polymorphism in a vaccine antigen and risk of clinical malaria: implications for vaccine development. Sci. Transl. Med. 2009;1:2ra5–2ra5. doi: 10.1126/scitranslmed.3000257. - DOI - PMC - PubMed
    1. Cowman AF, Tonkin CJ, Tham W-HH, Duraisingh MT. The molecular basis of erythrocyte invasion by malaria parasites. Cell Host Microbe. 2017;22:232–245. doi: 10.1016/j.chom.2017.07.003. - DOI - PubMed

MeSH terms