. 2024 Jun 7;15(1):4866.
doi: 10.1038/s41467-024-49230-z.

A YAP-centered mechanotransduction loop drives collective breast cancer cell invasion

Affiliations

A YAP-centered mechanotransduction loop drives collective breast cancer cell invasion

Antoine A Khalil et al. Nat Commun. .

Abstract

Dense and aligned Collagen I fibers are associated with collective cancer invasion led by protrusive tumor cells, leader cells. In some breast tumors, a population of cancer cells (basal-like cells) maintain several epithelial characteristics and express the myoepithelial/basal cell marker Keratin 14 (K14). Emergence of leader cells and K14 expression are regarded as interconnected events triggered by Collagen I, however the underlying mechanisms remain unknown. Using breast carcinoma organoids, we show that Collagen I drives a force-dependent loop, specifically in basal-like cancer cells. The feed-forward loop is centered around the mechanotransducer Yap and independent of K14 expression. Yap promotes a transcriptional program that enhances Collagen I alignment and tension, which further activates Yap. Active Yap is detected in invading breast cancer cells in patients and required for collective invasion in 3D Collagen I and in the mammary fat pad of mice. Our work uncovers an essential function for Yap in leader cell selection during collective cancer invasion.


Conflict of interest statement

The authors declare no competing interests.

Figures

Fig. 1
Fig. 1. Basal-like cells form the invasive front in a subset of IDC patients and in MMTV-PyMT model in vitro and in vivo.
a In vitro and in vivo model based on MMTV-PyMT organoids cultured in 3D basement membrane extract (BME). After isolation from BME cultures, organoids were either embedded in 3D Collagen I or injected as cell suspension into the mammary fat pad of mice. b, c Confocal imaging of K8 and K14 in MMTV-PyMT organoids (b) grown in 3D Collagen I for 5 days or (c) in mammary fat pad for 13 weeks. b, c Representative images from three independent experiments. b, c White arrowheads: K14 positive cells located at the tumor-ECM interface and leading edges of the tumors; red arrowheads K14 positive cells lining mammary ducts. d Mean gray values of K14 and K8 in the K14 positive cells lining the mammary ducts (myoepithelial cells) and at the invasive tumor margins (basal-like cells). Red line median from 10 cells per cell type from one confocal slice from 1 experiment. e Summary of K14 expression in IDC. fh Representative K8/K18 and K14 immunohistochemistry in serial tissue (whole) sections from IDC samples with zoom in on the cancer cell groups collectively invading the surrounding breast tissue. The invasive cancer cell groups showed (f) absence of K14 expression (12/19 IDC patients) (g) K14 expression throughout the invasive patterns (3/7 IDC patients) and (h) exclusive K14 expression in the cells located at the ECM-interface (4/7 IDC patients). Insets, K8/18 positive cells. Black arrowheads: K14 positive cells in the multicellular invasive cancer cell groups. Asterisk: K14 negative cells at the tumor-ECM interface. Scale bars: 250 (fh), 100 μm (c), 50 μm (b; fh, Zoom in), 10 μm (fh, inset). Source data are provided as a Source Data file.
Fig. 2
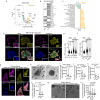
Fig. 2. Basal-like cells become invasive in Collagen I and drive collective invasion.
a, b Confocal imaging of Keratin 8 (K8), Keratin 14 (K14) in MMTV-PyMT (a) parental and b monoclonal cultures growing in 3D BME. a) Zoom in show the two subtypes of organoids (i) luminal and (ii) mixed. a, b Arrowheads indicate K14 positive (basal-like) cells located at the organoid-ECM interface. c, d Confocal imaging of MMTV-PYMT parental organoids embedded in 3D Collagen I (reflection). Protrusive K14-positive cells guide multicellular invasive strands. White arrowheads: leader cells, white arrows: Collagen I fiber alignment. Magenta arrowheads: non-protrusive K14-negative cells that are in contact with Collagen I. ac Representative images from 3 independent experiments. e Percentage of monoclonal organoids showing at least 1 protrusive strand after 3 days in 3D Collagen I (related to d). Average values from n = 97 (mixed) and n = 82 (luminal) organoids per condition from 7 (mixed) and 6 (luminal) independent experiments. Error bars, SD. P values, two-sided unpaired Mann–Whitney test. f UMAP plots based on transcriptional profile from mRNA sequencing of single cells isolated from MMTV-PyMT organoids cultured in 3D BME (799 cells from 3× 386-well plates) or Collagen I (627 cells from 3× 386 plates). Percentage of basal cells of the total amount of cells is indicated in the upper corner of the UMAP plots. g Plots of the same individual cells as (f) with the red/blue color-coded log2 cumulative read counts of basal marker K14. Scale bars: 50 μm (ad), 25 μm (ai, aii), 10 μm (ad, inset). Source data are provided as a Source Data file.
Fig. 3
Fig. 3. Collagen I enhances a Yap-associated program in basal-like cells that is required to drive collective invasion.
a Differentially expressed genes in basal-like cells (Collagen I vs BME). P values, two-sided Wilcoxon rank sum test. b Enriched transcription factors (P≤0.01) based on motif analysis of the differentially expressed genes. P values, cumulative hypergeometric distribution without multiple comparisons adjustments (HOMER). c The significantly altered pathways from the gene set enrichment analysis, filtered for absolute values of NES >0.5 and enrichment P value (<0.01) produced by the GSEA. d Confocal imaging of Yap, K14 and K8 in MMTV-PyMT organoids embedded in BME/Collagen I (1 day). Arrowheads: K14-positive cells: rim (green); leader cells (white). e Yap nuclear/cytoplasmic ratio in cells located at the rim. K14-high (Hi) or -low (Lo), based on mean intensity. Red line: median from n = 407 (BME, K14 Hi), n = 92 (BME, K14 Lo), n = 627 (Collagen I, K14 Hi), n = 197 (Collagen I, K14 Lo) cells from three independent experiments. f Yap nuclear/cytoplasmic ratio in K14-high cells: rim (BME, n = 407; Collagen I n = 468) or leader cells (n = 33) from three independent experiments. g Yap, K14 and K8 in patient-derived organoids Collagen I, day 3) from 2 independent experiments. h Yap shRNA (−/+ Dox) in MMTV-PyMT organoids (Collagen I). Arrowheads: invasive strands. il Cumulative strand length after (i, j) Yap knockdown or (k, l) YTIP expression in MMTV-PyMT organoids (Day 3) and 4T1 spheroids (Day 2) in Collagen I. il Medians (black line), 25/75 percentiles (boxes) and maximum/minimum values (whiskers) from n = 30 organoids from three independent experiments (i, k), n = 15 (-Dox) n=17 (+Dox) organoids from two independent experiments (j), n = 81 (-Dox) and n = 88 (+Dox) spheroids from three independent experiments (l). m, n Patient-derived organoids invading in Collagen I, DMSO, 5 μM or 10 μM of K975 (n) resultant collective invasion after 2–3 days in Collagen I, n = 112 organoids analyzed per condition from three independent experiments. n Representation similar to (il). P values, (il) two-sided unpaired Mann–Whitney test; e, f, n two-sided Kruskal–Wallis test (Dunn’s multiple comparison). Scale bars: 50 μm (d, e, h, m), 10 μm (d, g, insets). Source data are provided as a Source Data file.
Fig. 4
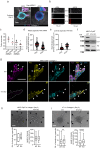
Fig. 4. Yap drives basal-cell guided ECM remodeling and collective invasion independent of K14.
a Confocal imaging of K14, K8, and Collagen I in control and Yap knockdown MMTV-PyMT organoids. Insets: K14-positive cells at the organoid-ECM interface. Representative image from three independent experiments. b Collagen I imaging using CNA35 GFP Collagen I dye in control and Yap knockdown organoids. c Collagen fiber order parameter near organoid rim (50 µm) with Yap shRNA1 or shRNA2 after 4 days of culture. Dotted line: average collagen order parameter within 50 µm from organoid rim on day 0 (mean = 0.16, SD = 0.08). Median (red line) n = 10 and n = 6 (shRNA1 -Dox and +Dox, respectively), n = 15 and n = 12 6 (shRNA2 -Dox and +Dox, respectively). b, c Data from 1 experiment. d, e Bead displacement towards MMTV-PyMT organoids with dox-inducible (d) Yap shRNA1 mixed organoid after 6 h in Collagen I and e YAP 5SA luminal organoids after 39h in Collagen I (−/+ Dox). Median (red line) from n = 63 (-dox) n = 60 (+Dox) (d) and n = 48 per condition (e) beads from one experiment. f Western blot analysis from two independent experiments showing K14, K17, K5 and actin expression from whole cell lysates of wild-type (WT) and K14 knockout (KO) MMTV-PyMT organoid cultures. g Confocal imaging of K14, p63 and K8 in WT and K14-KO organoids invading in Collagen I for 3 days. Arrowheads: WT and K14-KO leader cells with high nuclear Yap and low K8 signals. g Representative images from n = 8 organoids from 1 experiment. h, i WT and K14-KO (h) MMTV-PyMT organoids and i 4T1 spheroids invading Collagen I. Arrowheads: invasive strands. h, i Number and length of strand in WT and K14-KO organoids, medians (black line), 25/75 percentiles (boxes) and maximum/minimum values (whiskers) from (h) 72 (WT) and 84 (KO) invasive strands from five organoids per condition from one experiment and i 87 spheroids per condition from three independent experiments. P values, two-sided unpaired Mann–Whitney test. Scale bars: 50 μm (a, g), 100 μm (h, i), 10 μm (inset: a). Source data are provided as a Source Data file.
Fig. 5
Fig. 5. Collagen I induced forces control Yap-mediated transcription and invasion.
a Representative bright-field images of MMTV-PyMT organoids embedded in attached (Att.) and floating (Flo.) Collagen I gels. Arrowheads: invasive strands. b Percentage of organoids that have 1 or more invasive strands (invasive organoids). Data show average values with SD from n = 110 (Att.) and n = 165 (Flo.) organoids from five independent experiments. P values, two-sided unpaired Mann–Whitney test. c qPCR data showing relative mRNA expression of the classical Yap targets and other genes (identified from single cell sequencing) in MMTV-PyMT organoids embedded in floating relative to attached Collagen I gels. The bar graph represents the average values with SD from 3 independent experiments. P values, two-sided Student’s t test. d Yap distribution in rim and leader cells after detaching the Collagen gels for 2 h 30 min. e Yap nuclear/cytoplasmic ratio in the K14 positive cells that are either located at the rim or at leader positions in attached and floating gels. Data are derived from 29 to 40 cells per condition from three independent experiments. P values, two-sided Kruskal–Wallis test with Dunn’s multiple comparison. Scale bars: 50 μm (a, d), 10 μm (d, inset). Source data are provided as a Source Data file.
Fig. 6
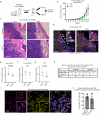
Fig. 6. Yap promotes breast cancer invasion in vivo.
a Experimental strategy for injecting MMTV-PyMT organoids harboring dox-inducible Yap shRNA1 or shRNA2 in the 4th mammary fat pad. b Tumor volumes were monitored weekly using digital caliper in the context of doxycycline (dox)-containing or control food with the starting time of dox treatment (week 7 or 9) depending on tumor size. Values represent the average tumor volume with SD. 13 mice (2–13 weeks) per condition. c Representative hematoxylin and eosin (H&E) stainings of primary tumors from control and dox-treated mice. Dashed lines indicate the invasive front contours. eg quantification of tumor invasion assessed by protrusive index (related to Supplementary Fig. S3a) in response to Yap knockdown (shRNA1 or shRNA2) and expression of YTIP. d, e Each value represents the average of (e, f) at least 2–4 regions of tumor borders (10× objective) per tumor from n = 12 (-Dox) and n = 10 (+Dox) for shRNA1 and n = 8 mice per condition for shRNA2 and g 1–3 regions (20x objective) per tumor from n = 10 mice per condition. P values, two-sided unpaired Mann–Whitney test. h Summary of K14 and nuclear Yap protein expression in IDC samples. i, j K14, and Yap immunostaining of (whole) section from a K14 positive IDC sample (Representative image n = 7 tissue sections). Zoom ins depict multicellular invasive cells with nuclear YAP distribution, particularly in the basal-like cells located at the interface with the breast tissue. j Percentage of cells with SD that have nuclear Yap that are located at the interface with the ECM and that are K14 positive. Data represent average percentage from 7 K14 positive IDC patients. Scale bars: 100 μm (c), 50 μm (d, i). Source data are provided as a Source Data file.
Fig. 7
Fig. 7. Bidirectional Yap-mediated cell-ECM interactions drive the emergence of leader cells and collective invasion.
Proposed sequential steps (1–5) underlying the induction of basal cell driven collective invasion by Collagen I. Biomechanical cues within Collagen I fibers are mechanotransduced by basal-like cells through Yap, which activates a transcriptional leader cell program. The leader cell program induces basal-like cells to protrude into and remodel the Collagen I-rich ECM. The remodeled ECM is mechanotransduced by basal-like cells through further Yap activation creating a feed-forward loop that initiates and maintains protrusive collective invasion.

References

    1. Cheung KJ, Gabrielson E, Werb Z, Ewald AJ. Collective invasion in breast cancer requires a conserved basal epithelial program. Cell. 2013;155:1639–1651. doi: 10.1016/j.cell.2013.11.029. - DOI - PMC - PubMed
    1. Yang C, et al. Inducible formation of leader cells driven by CD44 switching gives rise to collective invasion and metastases in luminal breast carcinomas. Oncogene. 2019;38:7113–7132. doi: 10.1038/s41388-019-0899-y. - DOI - PubMed
    1. Kim YH, et al. Senescent tumor cells lead the collective invasion in thyroid cancer. Nat. Commun. 2017;8:15208. doi: 10.1038/ncomms15208. - DOI - PMC - PubMed
    1. Nguyen-Ngoc K-V, et al. ECM microenvironment regulates collective migration and local dissemination in normal and malignant mammary epithelium. Proc. Natl. Acad. Sci. USA. 2012;109:E2595–E2604. doi: 10.1073/pnas.1212834109. - DOI - PMC - PubMed
    1. Bronsert P, et al. Cancer cell invasion and EMT marker expression: a three-dimensional study of the human cancer-host interface. J. Pathol. 2014;234:410–422. doi: 10.1002/path.4416. - DOI - PubMed

MeSH terms