. 2024 Jun 7;15(1):4883.
doi: 10.1038/s41467-024-49391-x.

ASXLs binding to the PHD2/3 fingers of MLL4 provides a mechanism for the recruitment of BAP1 to active enhancers

Affiliations

ASXLs binding to the PHD2/3 fingers of MLL4 provides a mechanism for the recruitment of BAP1 to active enhancers

Yi Zhang et al. Nat Commun. .

Abstract

The human methyltransferase and transcriptional coactivator MLL4 and its paralog MLL3 are frequently mutated in cancer. MLL4 and MLL3 monomethylate histone H3K4 and contain a set of uncharacterized PHD fingers. Here, we report a novel function of the PHD2 and PHD3 (PHD2/3) fingers of MLL4 and MLL3 that bind to ASXL2, a component of the Polycomb repressive H2AK119 deubiquitinase (PR-DUB) complex. The structure of MLL4 PHD2/3 in complex with the MLL-binding helix (MBH) of ASXL2 and mutational analyses reveal the molecular mechanism which is conserved in homologous ASXL1 and ASXL3. The native interaction of the Trithorax MLL3/4 complexes with the PR-DUB complex in vivo depends solely on MBH of ASXL1/2, coupling the two histone modifying activities. ChIP-seq analysis in embryonic stem cells demonstrates that MBH of ASXL1/2 is required for the deubiquitinase BAP1 recruitment to MLL4-bound active enhancers. Our findings suggest an ASXL1/2-dependent functional link between the MLL3/4 and PR-DUB complexes.


Conflict of interest statement

The authors declare no competing interests.

Figures
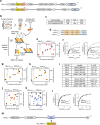
Fig. 1
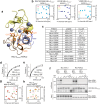
Fig. 1. MLL3PHD2/3 and MLL4PHD2/3 interact with ASXLs.
a MLL3 and MLL4 (KMT2C and KMT2D) lysine methyltransferases domain architecture. Sequence alignment of all PHD fingers of MLL3 and MLL4 is reported in ref. . Schematic of the human proteome peptide-phage display library (b) used to identify the ASXL sequences with high confidence scores of 62% and 6.5% (c) as a binding partner of MLL3PHD2/3. d Alignment of amino acid sequences of ASXL1/2/3. e Superimposed 1H,15N HSQC spectra of MLL3PHD2/3 collected upon titration with ASXL2 (aa 650-670 of ASXL2) peptide. Spectra are color coded according to the protein:peptide molar ratio. f Binding curves used to determine Kd values by fluorescence spectroscopy. g, h Superimposed 1H,15N HSQC spectra of MLL3PHD2/3 collected upon titration with ASXL2 (aa 650-664) and ASXL2 (aa 656-670) peptides. Spectra are color coded according to the protein:peptide molar ratio. i Binding affinities of MLL3PHD2/3 and MLL4PHD2/3 for the indicated ASXL2 and ASXL3 peptides measured by fluorescence spectroscopy. The Kd values represent average of three independent measurements, and errors represent standard deviation. n = 3 (j, k) Superimposed 1H,15N HSQC spectra of MLL4PHD2/3 collected upon titration with ASXL2 (aa 650-670) and ASXL3 (aa 1047-1067) peptides. Spectra are color coded according to the protein:peptide molar ratio. l Binding curves used to determine binding affinities of MLL4PHD2/3 for ASXL2 (aa 650-670) and ASXL3 (aa 1047-1067) peptides by fluorescence spectroscopy. m MLL3/4PHD2/3 binds to MBH (MLL-binding helix) of ASXL2. Domain architecture of ASXL2 with MBH colored blue. MLL3/4PHD2/3 is depicted as in (a).
Fig. 2
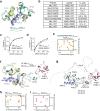
Fig. 2. Structure of MLL4PHD2/3 in complex with ASXL2.
A ribbon diagram (a) and a surface representation (b) of the solution NMR structure of the PHD2 (yellow) and PHD3 (wheat) fingers of MLL4 in complex with ASXL2 (blue). Zinc ions (gray spheres) coordinating cysteine and histidine residues are shown as stick and labeled. c Electrostatic surface potential of the MLL4PHD2/3:ASXL2 complex colored blue and red for positive and negative charges, respectively. d The MLL4PHD2/3 and ASXL2 residues involved in the complex formation are shown in sticks and labeled.
Fig. 3
Fig. 3. Mutational analysis of the ASXL2-binding site.
a A ribbon diagram of the structure of the MLL4PHD2/3:ASXL2 complex with the mutated residues shown as sticks. MLL4PHD2/3 residues are labeled in orange and ASXL2 residues are labeled in blue. b Superimposed 1H,15N HSQC spectra of mutated MLL4PHD2/3 collected upon titration with the ASXL2 peptide. Spectra are color coded according to the protein:peptide molar ratio. c Binding affinities of WT and mutated MLL4PHD2/3 for the indicated WT or mutated ASXL2 peptides measured by fluorescence spectroscopy or (a) NMR. The Kd values represent average of three independent measurements, and errors represent standard deviation. n = 3 (d, e) Binding curves used to determine binding affinities of indicated mutated MLL4PHD2/3 for the ASXL2 peptide by fluorescence spectroscopy. f Western blot analysis of ASXL1 and ASXL2, pulled down by recombinant wild-type or mutated GST-MLL3PHD2/3 and GST-MLL4PHD2/3. GST-MLL proteins were purified from bacteria and bound to GSH resin. Human Myc-ASXL1 and Myc-ASXL2 were expressed in HEK293FT cells. n = 3 (g, h) Superimposed 1H,15N HSQC spectra of WT MLL4PHD2/3 collected upon titration with the indicated mutated ASXL2 peptides. Spectra are color coded according to the protein:peptide molar ratio.
Fig. 4
Fig. 4. Conservation of the ASXL2-binding mechanism in MLL3PHD2/3.
a Overlay of the structures of the MLL4PHD2/3:ASXL2 complex (colored as in Fig. 2) and the apo-state of MLL3PHD2/3 (PDB ID: 2YSM) (teal). b Binding affinities of WT and mutated MLL3PHD2/3 for the indicated WT and mutated ASXL2 peptides measured by fluorescence spectroscopy or (a) NMR. The Kd values represent average of three independent measurements, and errors represent standard deviation. n = 3 (c, d) Binding curves used to determine binding affinities of WT MLL3PHD2/3 for the indicated mutated ASXL2 peptides by fluorescence spectroscopy. e Superimposed 1H,15N HSQC spectra of the indicated mutated MLL3PHD2/3 collected upon titration with the ASXL2 peptide. Spectra are color coded according to the protein:peptide molar ratio. f Overlay of the structures of the MLL4PHD2/3:ASXL2 complex (colored as in Fig. 2) and the AlphaFold (AF)-generated model of the apo-state of MLL3PHD2/3/4. The zinc-knuckle, following the PHD3 finger of MLL3, is colored cyan, and the fourth PHD finger (PHD4) of MLL3 is colored pink. g Overlay of the structures of the MLL4PHD2/3:ASXL2 complex (only ASXL2 is shown and colored blue) and two AF-models. One model is the apo-state of MLL3PHD2/3/4, with the zinc-knuckle following the PHD3 finger of MLL3 colored cyan, and PHD4 of MLL3 colored pink as in (f). The second model is the apo-state of MLL4 of the same length as MLL3PHD2/3/4 (colored gray). The sequence of MLL4, corresponding to the sequence of the PHD4 finger in MLL3, is predicted to be unstructured by AF and labeled MLL4. h, i Superimposed 1H,15N HSQC spectra of MLL3PHD4 collected upon titration with the indicated ligands. Spectra are color coded according to the protein:ligand molar ratio.
Fig. 5
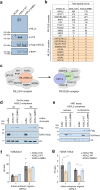
Fig. 5. MBH of ASXL2 directly links the native MLL3/4 and PR-DUB complexes in vivo.
a Western blot analysis of fractions obtained from the tandem affinity purification of WT ASXL2 and ASXL2 ΔMBH from K562 nuclear extracts using the indicated antibodies. Mock is the fraction from tag-only K562 cell line, subjected to the same purification protocol. (n = 1) (b) Proteins identified by mass spectrometry proteomic analysis of purified fractions from K562 cells expressing WT ASXL2 or ASXL2 ΔMBH. Subunits of the MLL3/4 complex are highlighted in wheat. c A model showing that the ASXL2-MLL3/4 interaction bridges the MLL3/4 complex with the ASXL2-containing PR-DUB complex. d H2AK119 de-ubiquitination assay on a native chromatin substrate using WT ASXL2 and ASXL2 ΔMBH purified complexes shown in (a, b). (n = 1) Flag signals indicate similar amounts of WT and mutant complexes used, and H3 is the loading control. e H3K4 methylation assay using WT ASXL2 and ASXL2 ΔMBH purified complexes on recombinant human histone octamers or mono-nucleosomes. Flag signals show the amounts of complexes used in the reactions, and H4 is the loading control. (n = 2) (f, g) ChIP-qPCR analysis of H3K4me1 (f) and H2AK119ub (g) in K562 ASXL2 KD cells complemented or not with WT or ΔMBH ASXL2 stably expressed from the AAVS1 locus. Two regions bordering an active enhancer upstream of the GRHL2 gene were analyzed. Histone PTM levels were corrected for nucleosome occupancy (total H3 signal), presented as a ratio of IP/input (H3K4me1 or H2AK119ub/total H3). Data represent mean ± SEM from three biological replicates. Statistical analyses were performed by two-way ANOVA test followed by Tukey’s test, *p < 0.05, **p < 0.01, ***p < 0.001. Source data are provided in a Source Data file.
Fig. 6
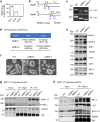
Fig. 6. MBH of ASXL1/2 is required for the association of MLL4 and BAP1 in ESCs.
a Asxl1/2/3 mRNA levels in mouse ESCs. Data from RNA-seq (GSE154475) are presented as dot plots (n = 2). Horizontal lines represent mean values. b Schematic representation of CRISPR/Cas9 gene editing-mediated deletion of ASXL1/2 MBH. Two cut sites flanking DNA sequences of MBH were induced by gRNAs inside exon 13 (E13) and exon 12 (E12) of Asxl1 and Asxl2, respectively. Locations of PCR genotyping primers 1F, 1R, 2F, and 2R are indicated by arrows. c PCR genotyping using primer pairs indicated in (b). Sizes of PCR products are indicated on the left. d Summary of genotyping by sequencing results of two ASXL1/2 MBH deleted ESC clones, ΔMBH-1 and ΔMBH-2. e Whole cell lysates from wild type (WT), ΔMBH-1 and ΔMBH-2 ESCs were analyzed with immunoblotting using indicated antibodies. BRG1 is shown as a loading control. Asterisks indicate non-specific bands. f Representative phase contrast microscopic images of WT, ΔMBH-1, and ΔMBH-2 ESCs. Scale bar, 50 μm. g WT, ΔMBH-1, and ΔMBH-2 ESCs were infected with Doxycycline (Dox)-inducible lentiviral vector expressing BAP1-T7. Cells were treated with 1 μg/ml Dox to induce BAP1-T7 expression. Whole-cell lysates were immunoprecipitated with IgG or anti-T7 antibody. Immunoprecipitates were analyzed by immunoblotting with antibodies indicated on the right. h The association of MLL4 and BAP1 is dependent on ASXL1/2 MBH. Whole-cell lysates from WT, ΔMBH-1, and ΔMBH-2 ESCs expressing BAP1-T7 were subjected to immunoprecipitation with anti-MLL4 antibody. Immunoprecipitates were analyzed by immunoblotting with antibodies indicated on the right. The experiments in (c, eh) were performed independently at least twice. Source data are provided in a Source Data file.
Fig. 7
Fig. 7. MBH ASXL1/2 links BAP1 to MLL4 on active enhancers in ESCs.
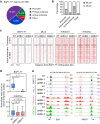
a Genomic distribution of BAP1-T7 binding regions in WT ESCs expressing BAP1-T7. Promoters were defined as transcription start sites ± 1 kb. Primed enhancers were defined as H3K4me1+ H3K27ac promoter-distal regions. Active enhancers were defined as H3K4me1+ H3K27ac+ promoter-distal regions. The number of binding regions in each group is indicated. b Percentage of MLL4+ and MLL4- regions among BAP1-T7 binding regions as grouped in (a). Numbers of BAP1+ MLL4+ promoters and active enhancers are indicated. c Heat maps of BAP1-T7 and MLL4 genomic bindings as well as H3K4me1 and H3K27ac enrichments on BAP1+ MLL4+ promoters and active enhancers identified in (b). d BAP1-T7 and H3K27ac intensities on BAP1+ MLL4+ active enhancers (n = 4,063) in WT, ΔMBH-1, and ΔMBH-2 ESCs are presented in box plots. Center lines represent median values; crosses represent mean values; the bottom and top of the boxes represent lower and upper quartiles; whiskers were calculated using the Tukey method. Statistical significance was determined by the two-tailed Mann-Whitney U test. e ChIP-seq profiles of BAP1-T7, MLL4, H3K4me1 and H3K27ac in WT, ΔMBH-1, and ΔMBH-2 ESCs expressing BAP1-T7 are displayed on representative loci. BAP1-T7+ MLL4+ promoters and active enhancers are highlighted in light green and pink, respectively.

References

    1. Xie G, et al. MLL3/MLL4 methyltransferase activities control early embryonic development and embryonic stem cell differentiation in a lineage-selective manner. Nat. Genet. 2023;55:693–705. doi: 10.1038/s41588-023-01356-4. - DOI - PubMed
    1. Froimchuk E, Jang Y, Ge K. Histone H3 lysine 4 methyltransferase KMT2D. Gene. 2017;627:337–342. doi: 10.1016/j.gene.2017.06.056. - DOI - PMC - PubMed
    1. Kandoth C, et al. Mutational landscape and significance across 12 major cancer types. Nature. 2013;502:333–339. doi: 10.1038/nature12634. - DOI - PMC - PubMed
    1. Rao RC, Dou Y. Hijacked in cancer: the KMT2 (MLL) family of methyltransferases. Nat. Rev. Cancer. 2015;15:334–346,. doi: 10.1038/nrc3929. - DOI - PMC - PubMed
    1. Lee JE, et al. H3K4 mono- and di-methyltransferase MLL4 is required for enhancer activation during cell differentiation. eLife. 2013;2:e01503. doi: 10.7554/eLife.01503. - DOI - PMC - PubMed

MeSH terms