Cell-specific models of hiPSC-CMs developed by the gradient-based parameter optimization method fitting two different action potential waveforms
- PMID: 38849433
- PMCID: PMC11161598
- DOI: 10.1038/s41598-024-63413-0
Cell-specific models of hiPSC-CMs developed by the gradient-based parameter optimization method fitting two different action potential waveforms
Abstract
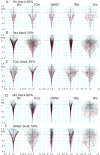
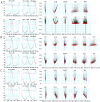
Parameter optimization (PO) methods to determine the ionic current composition of experimental cardiac action potential (AP) waveform have been developed using a computer model of cardiac membrane excitation. However, it was suggested that fitting a single AP record in the PO method was not always successful in providing a unique answer because of a shortage of information. We found that the PO method worked perfectly if the PO method was applied to a pair of a control AP and a model output AP in which a single ionic current out of six current species, such as IKr, ICaL, INa, IKs, IKur or IbNSC was partially blocked in silico. When the target was replaced by a pair of experimental control and IKr-blocked records of APs generated spontaneously in human induced pluripotent stem cell-derived cardiomyocytes (hiPSC-CMs), the simultaneous fitting of the two waveforms by the PO method was hampered to some extent by the irregular slow fluctuations in the Vm recording and/or sporadic alteration in AP configurations in the hiPSC-CMs. This technical problem was largely removed by selecting stable segments of the records for the PO method. Moreover, the PO method was made fail-proof by running iteratively in identifying the optimized parameter set to reconstruct both the control and the IKr-blocked AP waveforms. In the lead potential analysis, the quantitative ionic mechanisms deduced from the optimized parameter set were totally consistent with the qualitative view of ionic mechanisms of AP so far described in physiological literature.
© 2024. The Author(s).
Conflict of interest statement
The authors declare no competing interests.
Figures


Similar articles
-
Large-Scale Simulation of the Phenotypical Variability Induced by Loss-of-Function Long QT Mutations in Human Induced Pluripotent Stem Cell Cardiomyocytes.Int J Mol Sci. 2018 Nov 13;19(11):3583. doi: 10.3390/ijms19113583. Int J Mol Sci. 2018. PMID: 30428582 Free PMC article.
-
Electrophysiological mechanisms of vandetanib-induced cardiotoxicity: Comparison of action potentials in rabbit Purkinje fibers and pluripotent stem cell-derived cardiomyocytes.PLoS One. 2018 Apr 9;13(4):e0195577. doi: 10.1371/journal.pone.0195577. eCollection 2018. PLoS One. 2018. PMID: 29630634 Free PMC article.
-
Gradient-based parameter optimization method to determine membrane ionic current composition in human induced pluripotent stem cell-derived cardiomyocytes.Sci Rep. 2022 Nov 9;12(1):19110. doi: 10.1038/s41598-022-23398-0. Sci Rep. 2022. PMID: 36351955 Free PMC article. Clinical Trial.
-
Computational models of ventricular- and atrial-like human induced pluripotent stem cell derived cardiomyocytes.Ann Biomed Eng. 2013 Nov;41(11):2334-48. doi: 10.1007/s10439-013-0833-3. Epub 2013 May 31. Ann Biomed Eng. 2013. PMID: 23722932
-
Biophysical comparison of sodium currents in native cardiac myocytes and human induced pluripotent stem cell-derived cardiomyocytes.J Pharmacol Toxicol Methods. 2018 Mar-Apr;90:19-30. doi: 10.1016/j.vascn.2017.11.001. Epub 2017 Nov 8. J Pharmacol Toxicol Methods. 2018. PMID: 29128504
Cited by
-
A large population of cell-specific action potential models replicating fluorescence recordings of voltage in rabbit ventricular myocytes.R Soc Open Sci. 2025 Mar 26;12(3):241539. doi: 10.1098/rsos.241539. eCollection 2025 Mar. R Soc Open Sci. 2025. PMID: 40144290 Free PMC article.
References
-
- Noble D, Rudy Y. Models of cardiac ventricular action potentials: Iterative interaction between experiment and simulation. Philos. Trans. Math. Phys. Eng. Sci. 2001;359(1783):1127–1142. doi: 10.1098/rsta.2001.0820. - DOI
MeSH terms
Grants and funding
LinkOut - more resources
Full Text Sources
Miscellaneous

