. 2024 Aug;34(8):556-571.
doi: 10.1038/s41422-024-00980-x. Epub 2024 Jun 7.

A GABAergic system in atrioventricular node pacemaker cells controls electrical conduction between the atria and ventricles

Affiliations

A GABAergic system in atrioventricular node pacemaker cells controls electrical conduction between the atria and ventricles

Dandan Liang et al. Cell Res. 2024 Aug.

Abstract

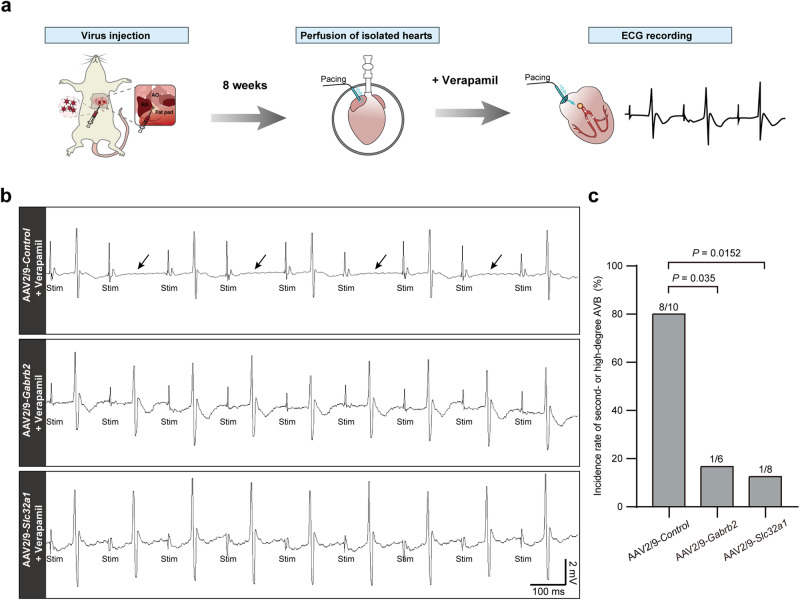
Physiologically, the atria contract first, followed by the ventricles, which is the prerequisite for normal blood circulation. The above phenomenon of atrioventricular sequential contraction results from the characteristically slow conduction of electrical excitation of the atrioventricular node (AVN) between the atria and the ventricles. However, it is not clear what controls the conduction of electrical excitation within AVNs. Here, we find that AVN pacemaker cells (AVNPCs) possess an intact intrinsic GABAergic system, which plays a key role in electrical conduction from the atria to the ventricles. First, along with the discovery of abundant GABA-containing vesicles under the surface membranes of AVNPCs, key elements of the GABAergic system, including GABA metabolic enzymes, GABA receptors, and GABA transporters, were identified in AVNPCs. Second, GABA synchronously elicited GABA-gated currents in AVNPCs, which significantly weakened the excitability of AVNPCs. Third, the key molecular elements of the GABAergic system markedly modulated the conductivity of electrical excitation in the AVN. Fourth, GABAA receptor deficiency in AVNPCs accelerated atrioventricular conduction, which impaired the AVN's protective potential against rapid ventricular frequency responses, increased susceptibility to lethal ventricular arrhythmias, and decreased the cardiac contractile function. Finally, interventions targeting the GABAergic system effectively prevented the occurrence and development of atrioventricular block. In summary, the endogenous GABAergic system in AVNPCs determines the slow conduction of electrical excitation within AVNs, thereby ensuring sequential atrioventricular contraction. The endogenous GABAergic system shows promise as a novel intervention target for cardiac arrhythmias.


Conflict of interest statement

The authors declare no competing interests.

Figures

Fig. 1
Fig. 1. Observation of GABA-containing vesicles and GABA-induced currents in rat AVNPCs.
a Representative TEM image showing abundant transmitter vesicle-like ultrastructures beneath the surface membranes of rat AVNPCs. Right, a magnified version of the white box in the left image. White arrows indicate the vesicles. Scale bar, 500 nm. b Immunofluorescence images showing the colocalization of GABA with the vesicle marker CAST in single rat AVNPCs. Scale bar, 10 μm. c Representative patch clamp recordings of whole-cell currents in rat AVNPCs elicited by various concentrations of GABA (0.01 μM, 0.1 μM, 1 μM, 10 μM, 100 μM). The holding potential was set at –60 mV. Horizontal bar, 500 ms; vertical bar, 10 pA. d Quantification of the GABA-elicited currents amplitude with different concentrations of GABA. n = 8 cells for each column. Data are shown as the means ± SD. P values were calculated by one-way ANOVA with Dunnett’s multiple comparison test.
Fig. 2
Fig. 2. Identification of the endogenous GABAergic system in AVNPCs.
a Illustrator and workflow for the single-cell gene expression analysis of AVNPCs from Hcn4CreERT2(+); Rosa26TomRed+mice. b Heatmap showing GABAergic system gene expression in single AVNPCs from Hcn4CreERT2(+); Rosa26TomRed+ mice. Rows indicate the AVNPC samples, and columns indicate the cycle threshold (Ct) values of GABAergic system genes. Ct values were scaled and the relative gene expression was demonstrated using color scales. A score of –1 (red) indicates a high expression level, and a score of 1 (blue) indicates a low level of expression. The data were obtained from 52 AVNPCs from 5 Hcn4CreERT2(+); Rosa26TomRed+ mice. c Immunofluorescence staining showing the expression and localization of GABA metabolic enzymes (GAD2, GABA-T, and SSADH), GABAA receptors (GABRA3, GABRB2, and GABRG2), GABA transporters (vGAT and GAT-1) in single mouse AVNPCs. Scale bar, 10 μm.
Fig. 3
Fig. 3. GABA and GABAAR activation decreases the excitability of AVNPCs.
a, b Representative traces and pooled data showing the currents evoked by GABAAR agonist (Afloqualone, 100 μM) in rat AVNPCs (top). Afloqualone-elicited currents were blocked by of GABAAR antagonist (Gabazine, 30 μM) (bottom). Data are shown as the means ± SD. n = 13 cells for Afloqualone-treated group, n = 8 cells for Afloqualone + Gabazine-treated group. P values were calculated using two-tailed unpaired Student’s t-test. c Representative spontaneous APs recorded using current patch clamp in rat AVNPCs. The cells were treated with GABAAR agonist (GABA, 100 μM; Afloqualone, 100 μM), or the Afloqualone + GABAAR antagonists (Gabazine, 30 μM). The horizontal line marks 0 mV. Scale bars are 250 ms (horizontal) and 10 mV (vertical). dj Pooled data of MDP, spontaneous AP firing rate, AP cycle length, max upstroke velocity (Vmax), AP duration measured at 50% (APD50) and 90% (APD90) repolarization, and AP amplitude from AP recording using current patch clamp in rat AVNPCs. n = 7 cells per group. Data are shown as means ± SD. P values were calculated by one-way ANOVA with Dunnett’s multiple comparison test.
Fig. 4
Fig. 4. The GABAergic system controls electrical conduction within the AVN.
a Photograph of isolated rat AVN tissue and optical mapping of the field of view. The pacing electrode is marked with a blue oval. The black box shows the electrical signal mapping field. The yellow triangle shows the position of the Koch triangle. Anatomical landmarks are annotated. FO fossa ovalis, TV tricuspid valve, TT tendon of Todaro, CS coronary sinus, RA right atrium, IVC inferior vena cava, AO aorta. Scale bar, 2 mm. b Representative activation map showing the electrical activation and conduction in isolated rat AVN preparations after perfusion with the solvent control DMSO, the GABAAR-specific agonist Afloqualone (320 μM), the GABA reuptake inhibitor Tiagabine (64 μM) or the GAT-1 inhibitor SKF89976A (128 μM). The activation map of zoomed-in images shows the electrical activation and conduction in the compact node of the AVN. Electrical activity in rat AVN preparations was recorded by optical mapping using the fluorescent dye Di-4-ANBDQBS. The activation time, conduction velocity, and vector maps were obtained during continuous electrode pacing located at the crista terminalis (5 Hz, 2 V). c Quantification of electrical conduction time within the AVN in distinct groups (n = 6 samples for control group, n = 7 samples for Afloqualone-treated group, n = 9 samples for Tiagabine-treated group, n = 8 samples for SKF89976A-treated group). Data are shown as means ± SD. P values were calculated by one-way ANOVA with Dunnett’s multiple comparison test. d, g, j Representative ECG recordings of perfused rat hearts treated with different concentrations of Afloqualone (0–640 μM) (d), Tiagabine (0–64 μM) (g) or SKF89976A (0–128 μM) (j) under the right atrial pacing (6 Hz). The arrows point to the typical ECG of second-degree type I AV block (d, g) and second-degree AV block (2:1) (j). Scale bars are 100 ms (horizontal) and 2 mV (vertical). Stim stimulation. e, h, k The dose-response of Afloqualone (e), Tiagabine (h) and SKF89976A (k) on PR intervals in perfused rat hearts. n = 5 hearts for Afloqualone and SKF89976A treatment group, n = 6 hearts for Tiagabine-treated group. Data are shown as means ± SD. P values were calculated using one-way ANOVA with Dunnett’s multiple comparison test. f, i, l Concentration-response curves of PR interval alterations induced by Afloqualone (EC50, 165.70 μM) (f), Tiagabine (IC50, 20.22 μM) (i), and SKF89976A (IC50, 37.57 μM) (l). Concentration-response curves were fitted to the Hill equation using nonlinear regression and normalized to the maximal changed PR intervals. Data are shown as means ± SD. n = 5 hearts for Afloqualone- and SKF89976A-treated group, n = 6 hearts for Tiagabine-treated group.
Fig. 5
Fig. 5. Gabrb2 knockout accelerates the electrical conduction between the atria and the ventricles in vivo.
a Representative ECG traces obtained from conscious Cre+/− and Gabrb2-CKO mice using telemetric recording system. Scale bars are 100 ms (horizontal) and 0.5 mV (vertical). bf Quantification of the average PR intervals (b), P wave durations (c), QRS durations (d), QT intervals (e) and heart rates (f) of mice in the indicated groups. BPM beats per minute. Data are shown as means ± SD. P values were calculated using two-tailed unpaired student’s t-test. n = 10 mice for Cre+/− group and n = 11 mice for Gabrb2-CKO group. gk Intracardiac programmed electrical stimulation (PES) was used to examine the electrical physiological function parameters of AVN including WBP (g, h), maximum atrioventricular synchronization frequency (i) and 2:1 AV conduction (j, k) from Cre+/− and Gabrb2-CKO mice. g, j Representative ECG traces for evaluation of the above parameters by PES. The drop of ventricular QRS complex pointed by the arrows is highlighted in the black box. The 2:1 AV conduction indicates the Wenckebach point that only one QRS complex was generated by two S1 stimulations. Data are shown as means ± SD. P values were calculated using two-tailed unpaired student’s t-test. n = 11 mice for Cre+ group and n = 9 mice for Gabrb2-CKO group. Stim stimulation.
Fig. 6
Fig. 6. Gabrb2 knockout increases the susceptibility to fatal ventricular arrhythmia in mice.
af Representative images and quantification of AVNERP. The AVNERP was evaluated by PES under different PCLs in Cre+/− mice and Gabrb2-CKO mice. The short trains of eight atrial stimuli (S1) followed by 1 extrastimulus (S2) were applied. Arrows indicate loss of S2-induced ventricular signal. Data are shown as means ± SD. P values were calculated using two-tailed unpaired student’s t-test. n = 10 mice for Cre+/− group and n = 9 mice for Gabrb2-CKO group. g, h Representative intracardiac ECG traces and quantification of the occurrence of fatal ventricular arrhythmias from Cre+/− and Gabrb2-CKO mice after the challenge of isoproterenol and high frequency atrial burst stimulation. Atrial ECG represents the ECG signals from right atrium; Lead II ECG represents the surface ECG recordings. n = 10 mice per group. P values were calculated by Fisher’s exact test. VT ventricular tachycardia, VF ventricular fibrillation, Stim stimulation.
Fig. 7
Fig. 7. Knockdown of key genes in GABAergic system alters electrical conduction between the atria and ventricles in vivo.
a Top, a cartoon illustration of experimental design. Bottom, schematic diagram of local injection of virus into rat AVN. AO aorta, RA right atrium. b Fluorescence microscopy confirmed that RFP was highly expressed in Koch’s triangle injected with AAV2/9 virus. Bright-field (left), RFP (middle) and merged images (right) of hearts injected with AAV2/9 virus. The yellow triangle indicates the triangle of Koch area. The asterisk denotes AVN location. Scale bar, 2 mm. FO fossa ovalis, TV tricuspid valve, TT tendon of Todaro, CS coronary sinus, IVC inferior vena cava. c Representative ECGs obtained from conscious rats through a telemetric recording system after administration of AAV2/9-Control, AAV2/9-Gabrb2, AAV2/9-Slc32a1 or AAV2/9-Abat virus. Scale bars are 100 ms (horizontal) and 0.5 mV (vertical). dh Quantification of the average PR intervals (d), P wave durations (e), QRS durations (f), QT intervals (g) and heart rates (BPM, beats per minute) (h) of rats in the indicated groups. For AAV2/9-Control group, n = 7; for AAV2/9-Gabrb2 group, n = 6; for AAV2/9-Slc32a1 group, n = 6; for AAV2/9-Abat group, n = 6. Data are shown as means ± SD. P values were calculated by one-way ANOVA with Dunnett’s multiple comparison test.
Fig. 8
Fig. 8. Intervention targeting the GABAergic system prevents the occurrence and development of AV block.
a Experimental design. AO aorta, RA right atrium. b Representative ECG recordings showing successful construction of severe AV block by perfusion with verapamil (250 nM) in isolated hearts of AAV2/9-Control virus-injected rats. Arrows indicate the representative second-degree AV block (2:1). AAV2/9-Gabrb2 or AAV2/9-Slc32a1 virus-injected hearts did not develop second- or high-degree AV block. Stim stimulation. Scale bars are 100 ms (horizontal) and 2 mV (vertical). c Proportion of second- or high-degree AV block in AAV2/9-Control, AAV2/9-Gabrb2 or AAV2/9-Slc32a1 virus-injected hearts. n = 10 rats for AAV2/9-Control group, n = 6 rats for AAV2/9-Gabrb2 group, and n = 8 rats for AAV2/9-Slc32a1 group. P values were calculated by Fisher’s exact test.

Similar articles

Cited by

References

    1. Mayourian, J. et al. Physiologic, pathologic, and therapeutic paracrine modulation of cardiac excitation-contraction coupling. Circ. Res.122, 167–183 (2018). - PMC - PubMed
    1. Bers, D. M. Cardiac excitation-contraction coupling. Nature415, 198–205 (2002). - PubMed
    1. Litviňuková, M. et al. Cells of the adult human heart. Nature588, 466–472 (2020). - PMC - PubMed
    1. Hulsmans, M. et al. Macrophages facilitate electrical conduction in the heart. Cell169, 510–522 (2017). - PMC - PubMed
    1. Chandler, N. J. et al. Molecular architecture of the human sinus node: insights into the function of the cardiac pacemaker. Circulation119, 1562–1575 (2009). - PubMed

LinkOut - more resources