

The pros and cons of nucleic acid-amplified immunoassays-a comparative study on the quantitation of prostate-specific antigen with and without rolling circle amplification
- PMID: 38849527
- PMCID: PMC11584466
- DOI: 10.1007/s00216-024-05357-y
The pros and cons of nucleic acid-amplified immunoassays-a comparative study on the quantitation of prostate-specific antigen with and without rolling circle amplification
Abstract
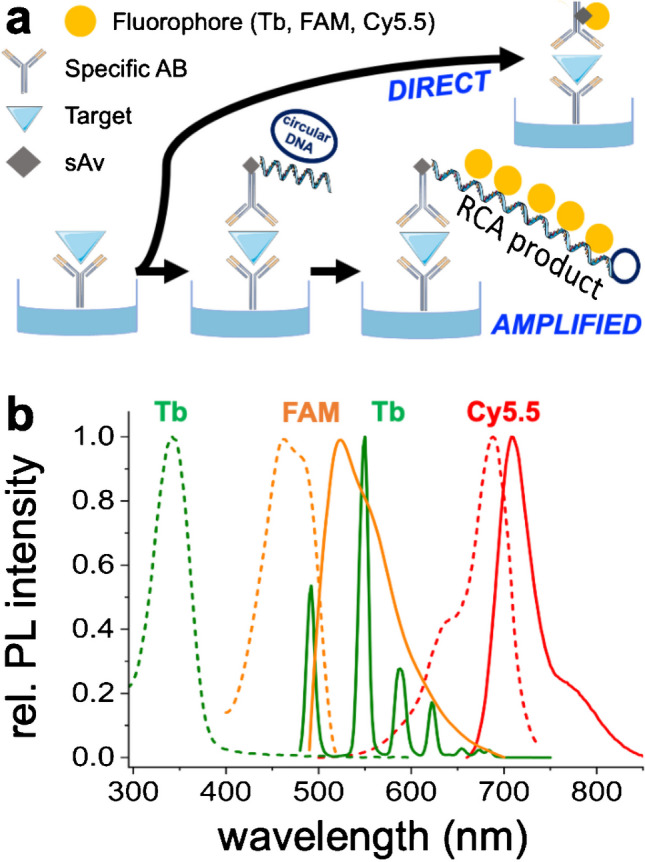
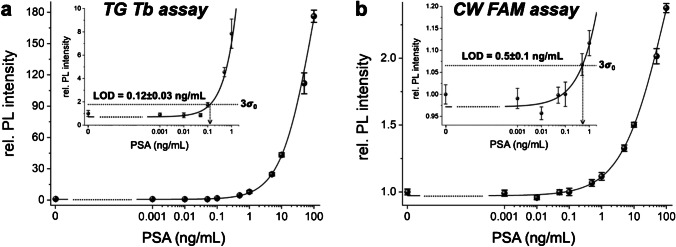
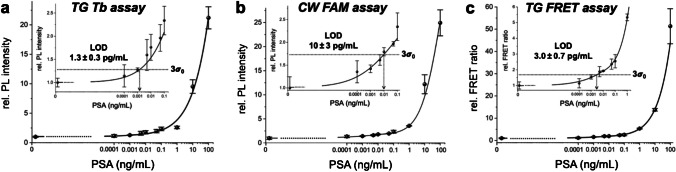
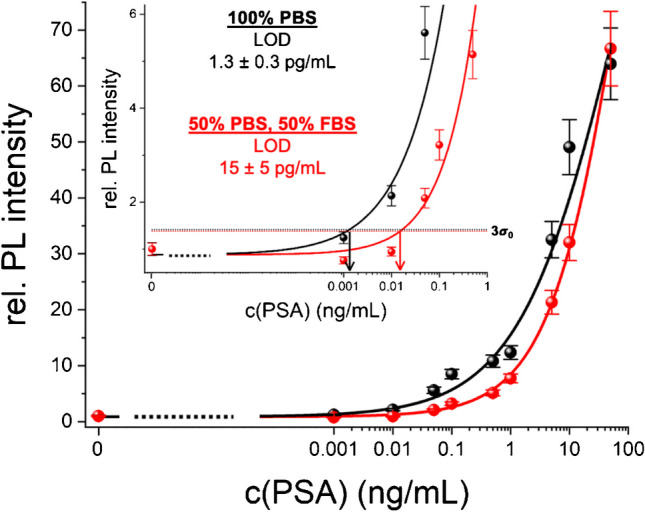
Integrating isothermal nucleic acid amplification strategies into immunoassays can significantly decrease analytical limits of detection (LODs). On the other hand, an amplification step adds time, complication, reagents, and costs to the assay format. To evaluate the pros and cons in the context of heterogeneous multistep immunoassays, we quantified prostate-specific antigen (PSA) with and without rolling circle amplification (RCA). In addition, we compared time-gated (TG) with continuous-wave (CW) photoluminescence (PL) detection using a terbium complex and a fluorescein dye, respectively. For both direct (non-amplified) and amplified assays, TG PL detection provided circa four- to eightfold lower LODs, illustrating the importance of autofluorescence background suppression even for multi-wash assay formats. Amplified assays required an approximately 2.4 h longer assay time but led to almost 100-fold lower LODs down to 1.3 pg/mL of PSA. Implementation of TG-FRET (using a Tb-Cy5.5 donor-acceptor pair) into the RCA immunoassay resulted in a slightly higher LOD (3.0 pg/mL), but the ratiometric detection format provided important benefits, such as higher reproducibility, lower standard deviations, and multiplexing capability. Overall, our direct comparison demonstrated the importance of biological background suppression even in heterogeneous assays and the potential of using isothermal RCA for strongly decreasing analytical LODs, making such assays viable alternatives to conventional enzyme-linked immunosorbent assays (ELISAs).
Keywords: Diagnostics; ELISA; Fluorescence; PSA; TR-FRET; Terbium.
© 2024. The Author(s).
Conflict of interest statement
Declarations. Conflict of interest: The authors declare no competing interests.
Figures
Similar articles
-
Three-Dimensional FRET Multiplexing for DNA Quantification with Attomolar Detection Limits.J Phys Chem Lett. 2018 Aug 2;9(15):4379-4384. doi: 10.1021/acs.jpclett.8b01944. Epub 2018 Jul 23. J Phys Chem Lett. 2018. PMID: 30016106
-
Triplexed CEA-NSE-PSA Immunoassay Using Time-Gated Terbium-to-Quantum Dot FRET.Molecules. 2020 Aug 12;25(16):3679. doi: 10.3390/molecules25163679. Molecules. 2020. PMID: 32806745 Free PMC article.
-
Bio-bar-code-based photoelectrochemical immunoassay for sensitive detection of prostate-specific antigen using rolling circle amplification and enzymatic biocatalytic precipitation.Biosens Bioelectron. 2018 Mar 15;101:159-166. doi: 10.1016/j.bios.2017.10.031. Epub 2017 Oct 16. Biosens Bioelectron. 2018. PMID: 29065341
-
Rolling Circle Amplification in Integrated Microsystems: An Uncut Gem toward Massively Multiplexed Pathogen Diagnostics and Genotyping.Acc Chem Res. 2021 Nov 2;54(21):3979-3990. doi: 10.1021/acs.accounts.1c00438. Epub 2021 Oct 12. Acc Chem Res. 2021. PMID: 34637281 Free PMC article. Review.
-
Immuno-Rolling Circle Amplification (Immuno-RCA): Biosensing Strategies, Practical Applications, and Future Perspectives.Adv Healthc Mater. 2024 Dec;13(32):e2402337. doi: 10.1002/adhm.202402337. Epub 2024 Sep 10. Adv Healthc Mater. 2024. PMID: 39252654 Review.
References
-
- Wild D. The Immunoassay Handbook. 4th ed. Elsevier Science; 2013.
-
- Norman M, Gilboa T, Ogata AF, Maley AM, Cohen L, Busch EL, Lazarovits R, Mao CP, Cai Y, Zhang J, Feldman JE, Hauser BM, Caradonna TM, Chen B, Schmidt AG, Alter G, Charles RC, Ryan ET, Walt DR. Ultrasensitive high-resolution profiling of early seroconversion in patients with COVID-19. Nat Biomed Eng. 2020;4:1180–7. 10.1038/s41551-020-00611-x. - PMC - PubMed
-
- Butler JE. Enzyme-linked immunosorbent assay. J Immunoassay. 2000;21:165–209. 10.1080/01971520009349533. - PubMed
Publication types
MeSH terms
Substances
Grants and funding
LinkOut - more resources
Full Text Sources
Medical
Research Materials
Miscellaneous
