. 2024 Aug;4(8):1102-1120.
doi: 10.1038/s43587-024-00635-x. Epub 2024 Jun 7.

A mild increase in nutrient signaling to mTORC1 in mice leads to parenchymal damage, myeloid inflammation and shortened lifespan

Affiliations

A mild increase in nutrient signaling to mTORC1 in mice leads to parenchymal damage, myeloid inflammation and shortened lifespan

Ana Ortega-Molina et al. Nat Aging. 2024 Aug.

Abstract

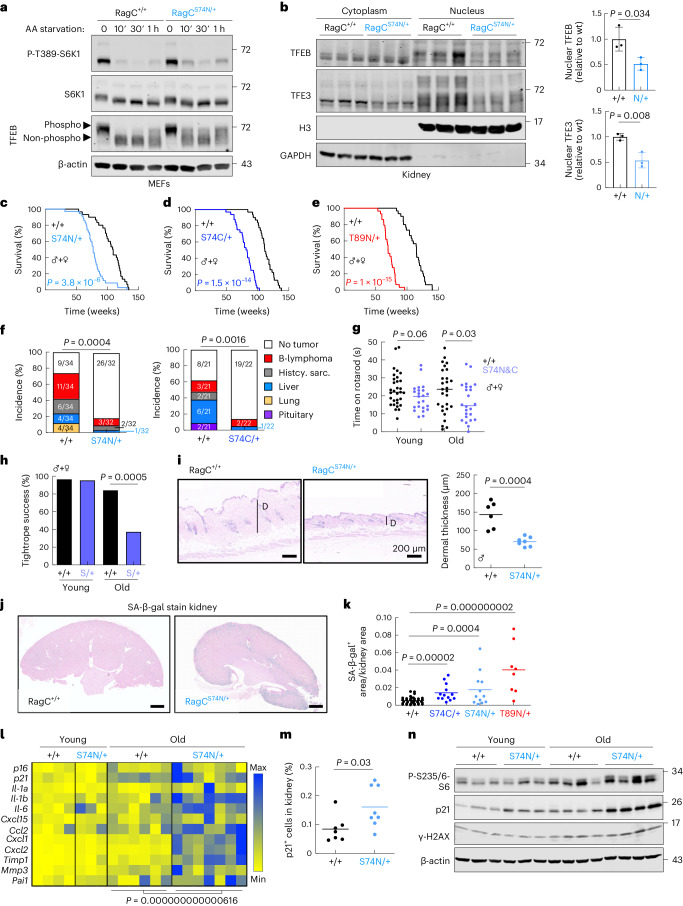
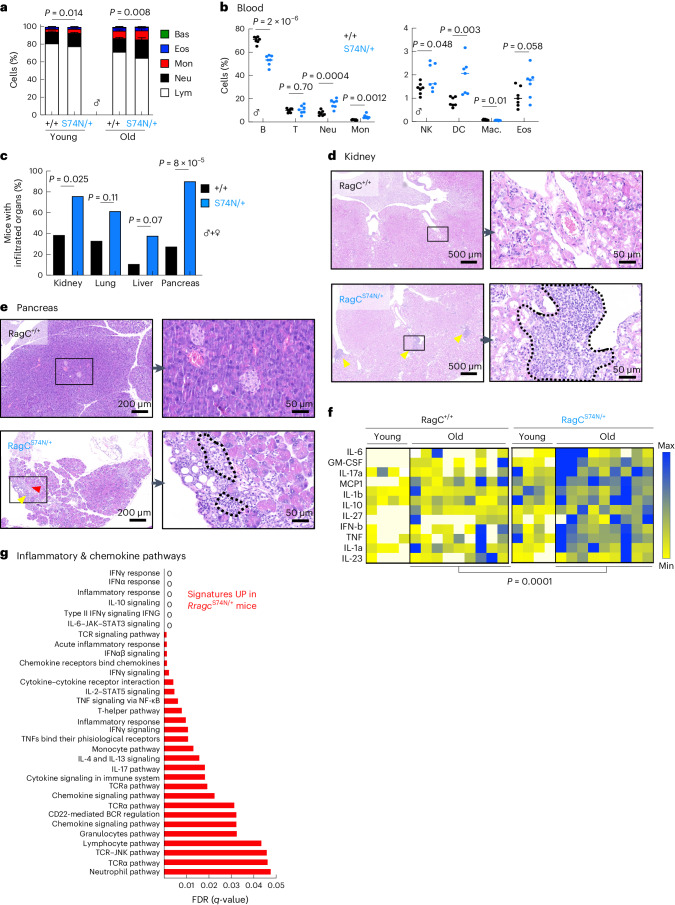
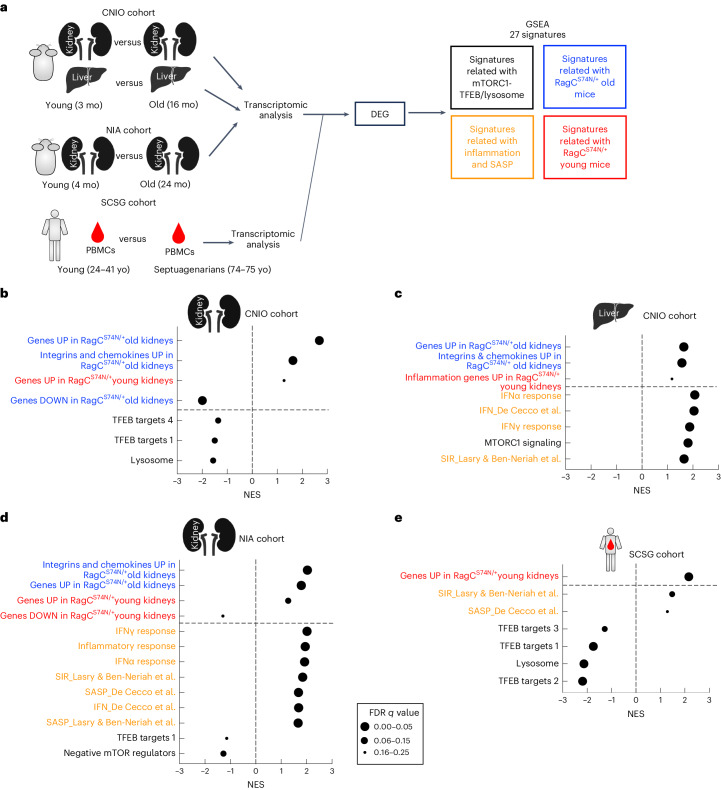
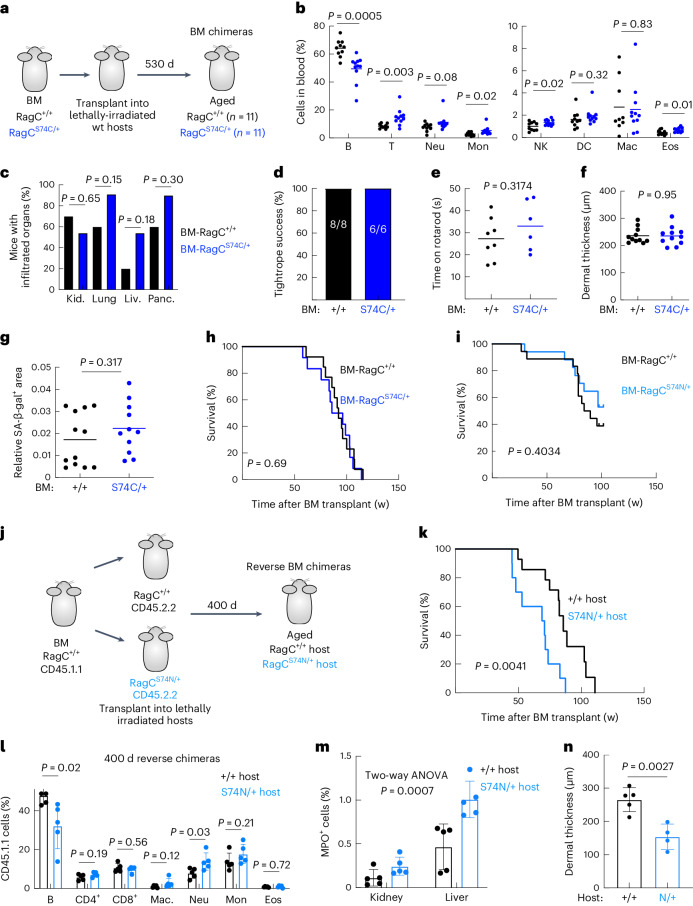
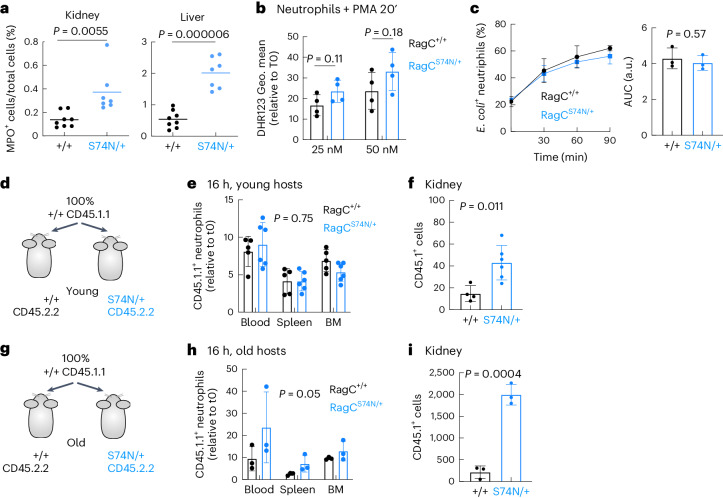
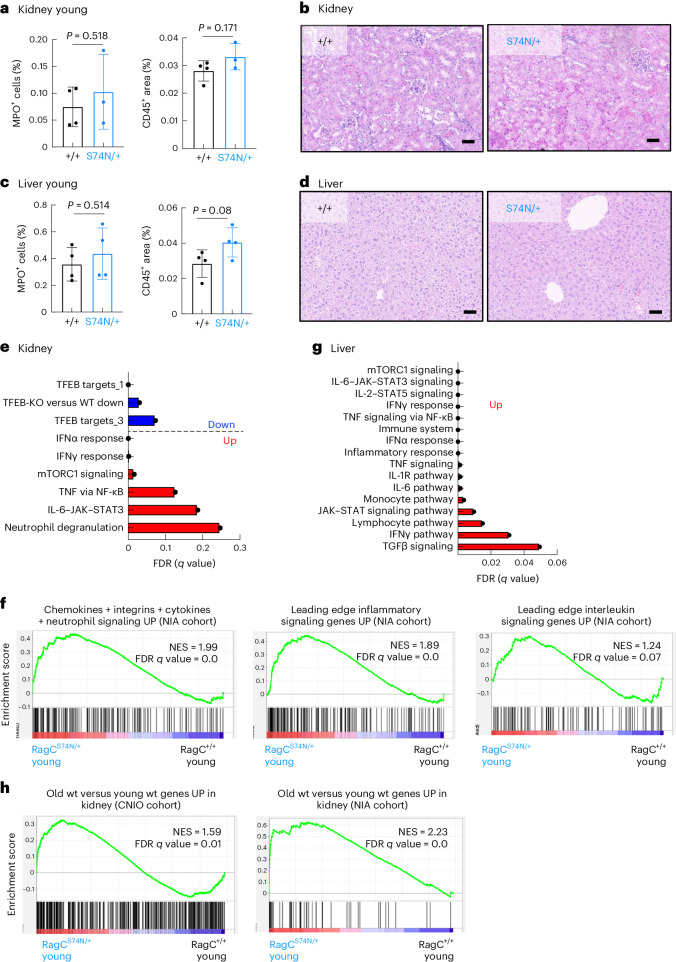
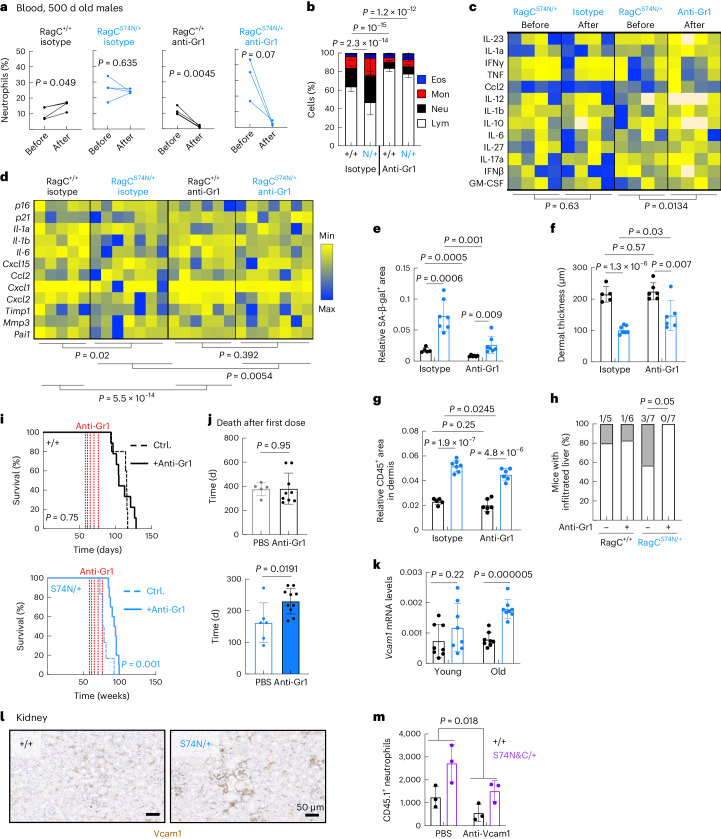
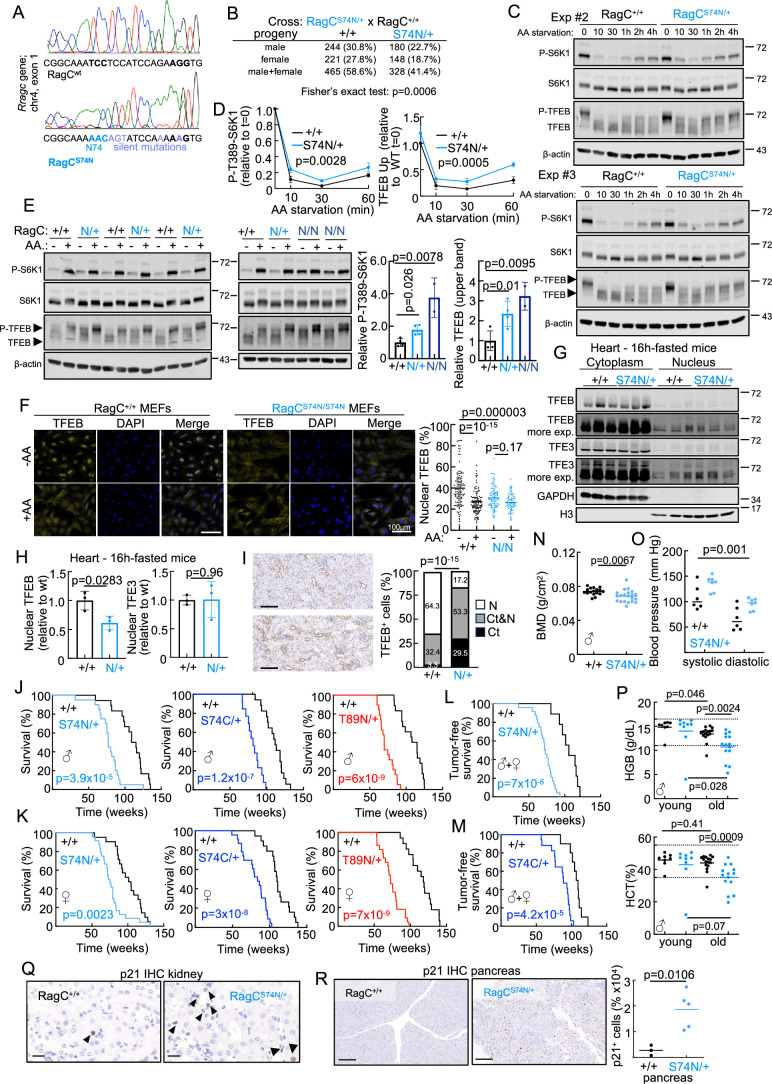
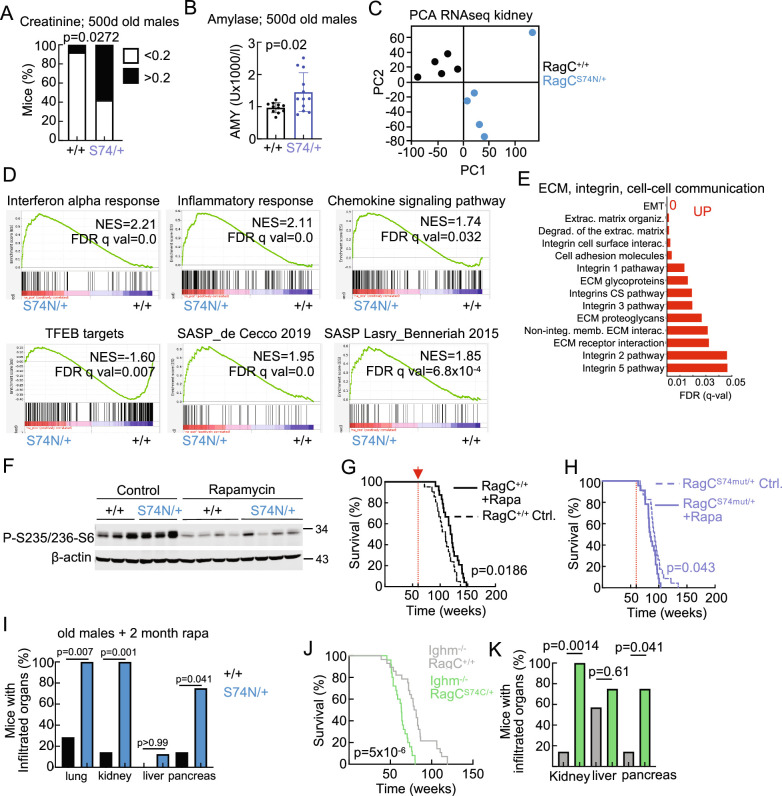
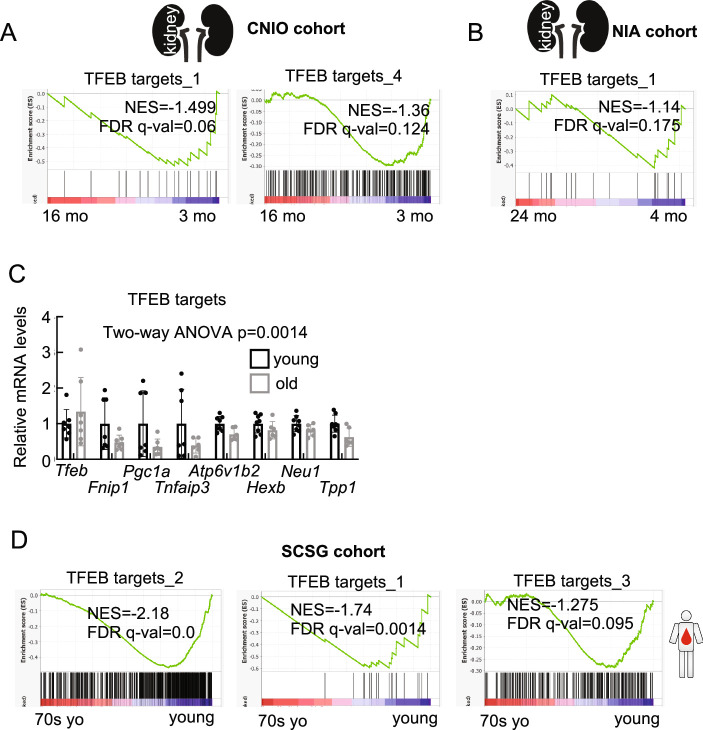
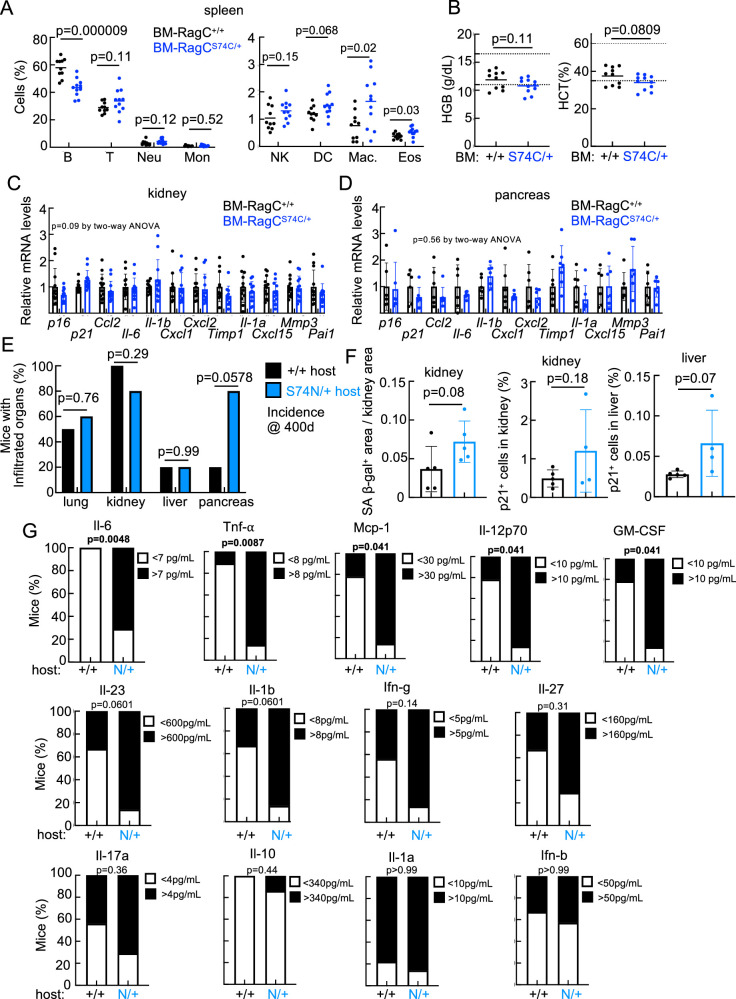
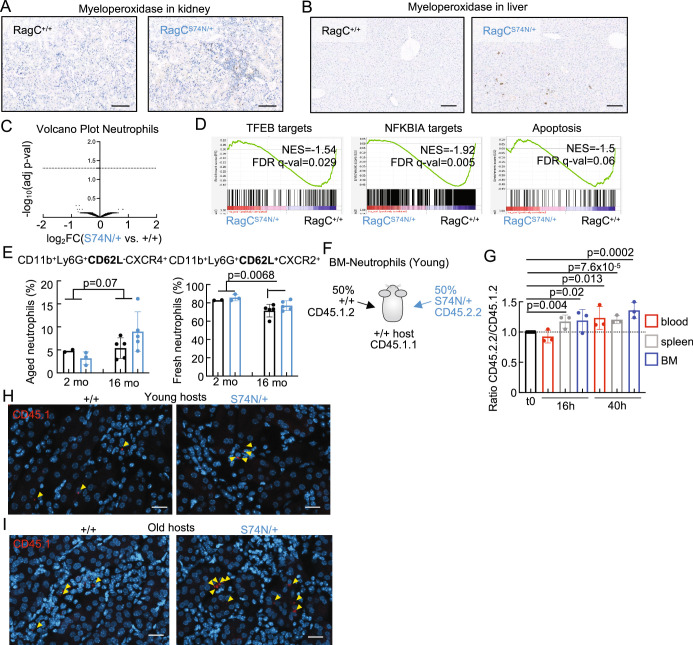
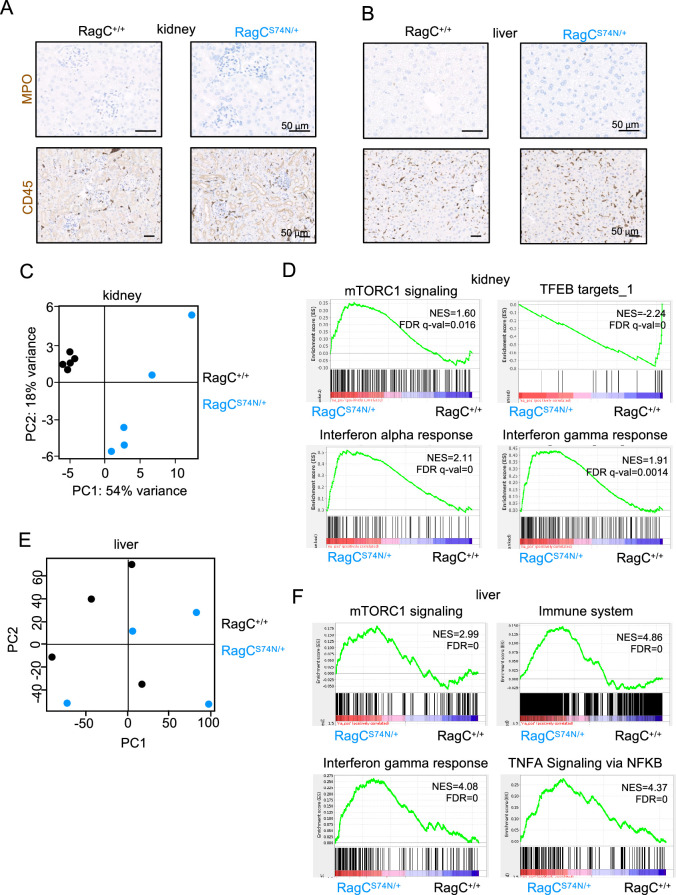
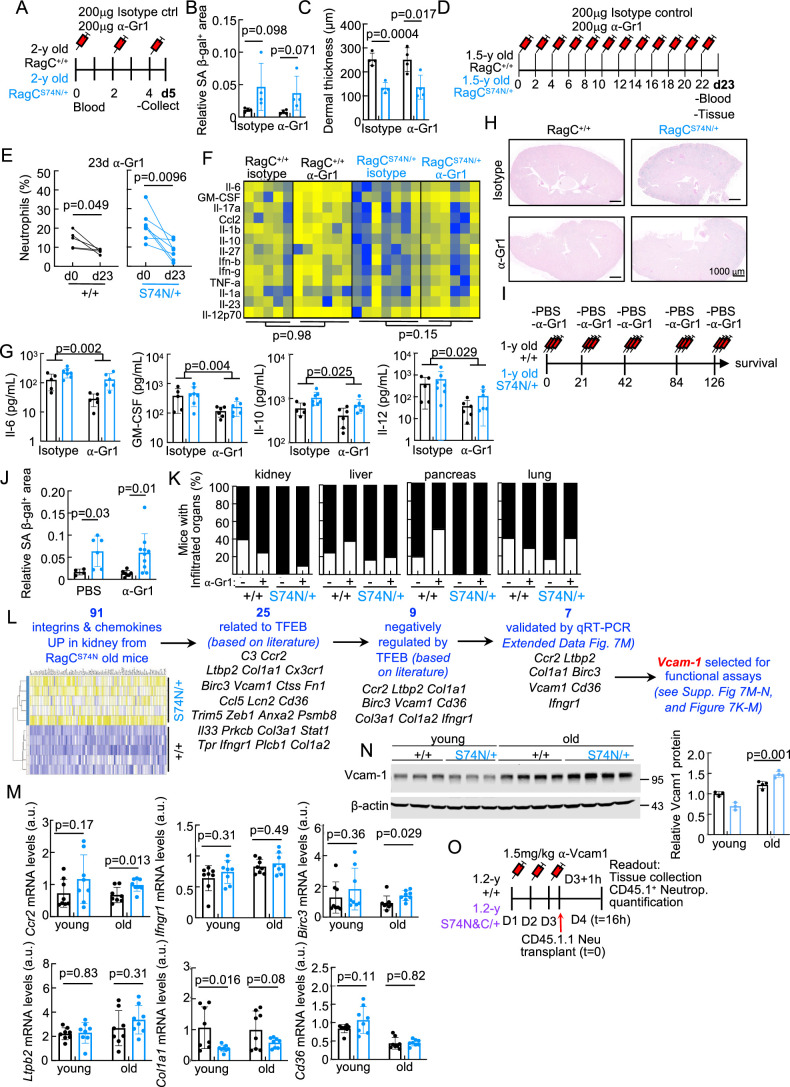
The mechanistic target of rapamycin complex 1 controls cellular anabolism in response to growth factor signaling and to nutrient sufficiency signaled through the Rag GTPases. Inhibition of mTOR reproducibly extends longevity across eukaryotes. Here we report that mice that endogenously express active mutant variants of RagC exhibit multiple features of parenchymal damage that include senescence, expression of inflammatory molecules, increased myeloid inflammation with extensive features of inflammaging and a ~30% reduction in lifespan. Through bone marrow transplantation experiments, we show that myeloid cells are abnormally activated by signals emanating from dysfunctional RagC-mutant parenchyma, causing neutrophil extravasation that inflicts additional inflammatory damage. Therapeutic suppression of myeloid inflammation in aged RagC-mutant mice attenuates parenchymal damage and extends survival. Together, our findings link mildly increased nutrient signaling to limited lifespan in mammals, and support a two-component process of parenchymal damage and myeloid inflammation that together precipitate a time-dependent organ deterioration that limits longevity.


Conflict of interest statement

The authors declare no competing interests.

Figures

Fig. 1
Fig. 1. Rragc-mutant mice have a shortened lifespan.
a, Rragc+/+ and RragcS74N/+ MEFs were deprived of all amino acids in RPMI with dialyzed serum for 10 min, 30 min and 1 h. Whole-cell protein lysates were immunoblotted for the indicated proteins. b, Tfe3 and Tfeb protein levels in subcellular fractions from kidneys from young Rragc+/+ (n = 3) and RragcS74N/+ (n = 3) mice fasted 16 h. Quantification of Tfe3 and Tfeb levels in the nucleus is relative to histone 3 levels. Data are presented as mean ± s.d. ce, Kaplan–Meier survival curves of Rragc+/+ (n = 30) and RragcS74N/+ (n = 35) (c); Rragc+/+ (n = 31) and RragcS74C/+ (n = 32) (d); Rragc+/+ (n = 30) and RragcT89N/+ (n = 29) (e) mice. f, Tumor incidence in cohorts from Rragc+/+ (n = 34) and RragcS74N/+ (n = 32) (left) and from Rragc+/+ (n = 21) and RragcS74C/+ (n = 22) (right). Percentage of mice with no tumors, B cell lymphomas, histiocytic sarcomas, hepatocellular carcinomas, lung carcinomas and pituitary tumors. g, Time on rotarod measured in young (4–7.5-mo-old) and old (14.5–20-mo-old) Rragc+/+ (young, n = 31; old, n = 32) and RragcS74N/+ and RragcS74C/+ (young, n = 23; old, n = 24) mice. h, Tightrope assay performed in the same groups of mice as in g. Scale bars represent the percentage of mice that passed the assay. i, Dermal thickness measured in back skin of 18-mo-old Rragc+/+ (n = 6) and RragcS74N/+ (n = 7) males. Scale bars, 200 μm. j, Representative pictures of SA-β-gal+ in kidney. Scale bars, 1,000 μm. k, Quantification of SA-β-gal+ within the kidney of 18-mo-old Rragc+/+ (n = 38), RragcS74C/+ (n = 13), RragcS74N/+ (n = 12) and RragcT89N/+ (n = 8) mice. l, qRT–PCR analysis of genes of the SASP in kidneys of young (4-mo-old) and old (18-mo-old) Rragc+/+ (young, n = 4; old, n = 6) and RragcS74N/+ (young, n = 3; old, n = 7) male mice. m, Quantification of IHC staining of anti-p21 in kidneys collected from 18-mo-old Rragc+/+ (n = 7) and RragcS74N/+ (n = 8) male mice. n, Immunoblot for the indicated proteins from 4-mo-old and 18-mo-old Rragc+/+ and RragcS74N/+ male mice. Statistical significance was assessed by log-rank test (ce); two-sided chi-squared test (f); two-sided Fisher’s exact test (h); two-tailed Student’s t-test (b,g,i,k,m); and two-way analysis of variance (ANOVA) (l). mo, month. Source data
Fig. 2
Fig. 2. Old Rragc-mutant mice show an inflammaging phenotype.
a, White blood cell (WBC) count performed in young (3–5-mo-old) and old (18-mo-old) Rragc+/+ (young, n = 8; old, n = 9) and RragcS74N/+ (young, n = 12; old, n = 12) males. Each colored stack represents cell-type percentage (Lym, lymphocyte; Neu, neutrophil; Mon, monocyte; Eos, eosinophil; Bas, basophil). Data are presented as mean ± s.d. b, Percentage of the indicated cell populations in the blood of 18-mo-old Rragc+/+ (n = 9) and RragcS74N/+ (n = 9) male mice. B, B cell; T, T cell; NK, natural killer; DC, dendritic cell; Mac, macrophage. c, Incidence of infiltrated inflammatory cells in the indicated tissues from 18-mo-old Rragc+/+ (n = 18) and RragcS74N/+ (n = 21) mice. d, Representative H&E pictures in the same mice as in c, showing inflammatory foci in kidney (dashed lines). e, Representative H&E pictures in the same mice as in c, showing inflammatory foci in pancreas (dashed lines). f, Quantification of inflammatory cytokines in sera from young (4-mo-old) and old (18-mo-old) Rragc+/+ (young, n = 4; old, n = 9) and RragcS74N/+ (young, n = 4; old, n = 9) male mice measured by Legendplex assay using flow cytometry. g, Graphical representation of the false discovery rates (FDRs) from the indicated KEGG, Hallmark, REACTOME and WikiPathways gene sets enriched in kidneys from 18-mo-old RragcS74N/+ (n = 5) versus Rragc+/+ (n = 5) mice. Statistical significance was calculated by two-way ANOVA (a,f); two-tailed Student’s t-test (b); and two-sided Fisher’s exact test (c). Source data
Fig. 3
Fig. 3. Similarities between changes in Rragcmut/+ mice and physiological aging in mice and humans.
a, Experimental setup for the preranked GSEA performed in old and young wt mice from CNIO (kidney and liver) and NIA (kidney) cohorts, and the SCSG cohort (PBMCs from septuagenarians and young individuals) using 27 curated signatures related to mTORC1–TFEB and lysosomes (in black), signatures related to RragcS74N/+ old mice (blue), signatures related to inflammation and SASP (orange) and signatures related to RragcS74N/+ young mice (red). See Supplementary Table 2 for a detailed description of the signatures. b, Normalized enrichment score (NES) of indicated gene sets when comparing gene expression in old wt versus young wt kidneys from CNIO cohort. c, NES of indicated signatures when comparing gene expression in old wt versus young wt livers from CNIO cohort. d, NES of indicated signatures when comparing gene expression in old wt versus young wt kidney from NIA cohort. e, NES of indicated signatures when comparing gene expression in septuagenarians versus young PBMCs from the SCSG cohort. For be, a positive NES reflects enrichment of the gene set at the top of the ranked list and gene sets with a negative NES are overrepresented at the bottom of the gene list. The size of the bubble represents the FDR q value. Pictures of the liver and kidney were created with BioRender. Source data
Fig. 4
Fig. 4. Rragc-mutant ‘reverse’ BM chimeras exhibit shortened longevity.
a, Experimental setup for the generation of Rragc+/+ and RragcS74C/+ BM chimeras. Aging features and inflammation were measured 18 months after transplantation. b, Percentage of cell populations in the blood of 18-mo-old BM-Rragc+/+ (n = 9) and BM-RragcS74C/+ (n = 10) male mice. B, B cell; T, T cell; Mon, monocyte; NK, natural killer; Mac, macrophage; Eos, eosinophil. c, Incidence of inflammatory cells in tissues from 18-mo-old BM-Rragc+/+ (n = 10) and BM-RragcS74C/+ (n = 11) mice. d, Tightrope assay in 18-mo-old BM-Rragc+/+ (n = 8) and BM-RragcS74C/+ (n = 6) male mice. Bars represent the percentage of mice that passed the test. e, Time on rotarod test measured in the same mice as in c. f, Dermal thickness of back skin of 18-mo-old BM-Rragc+/+ (n = 11) and BM-RragcS74C/+ (n = 11) male mice. g, Quantification of SA-β-gal+ area within the kidney area of 18-mo-old BM-Rragc+/+ (n = 12) and BM-RragcS74C/+ (n = 11) mice. h, Kaplan–Meier survival curves of BM-Rragc+/+ (n = 13) and BM-RragcS74C/+ (n = 12) mice. i, Kaplan–Meier survival curves of BM-Rragc+/+ (n = 9) and BM-RragcS74N/+ (n = 20) mice. j, Experimental setup for the generation of reverse chimeric Rragc+/+ and RragcS74C/+ mice. Readout 14 months after transplant of wt BM into Rragc+/+ and RragcS74N/+ hosts. k, Kaplan–Meier survival curves of reverse BM-Rragc+/+ (n = 14) and BM-RragcS74N/+ (n = 10) mice. l, Percentage of cell populations in the blood of 14-mo-old reverse BM-Rragc+/+ (n = 5) and BM-RragcS74N/+ (n = 5) male mice. m, Quantification of IHC for myeloperoxidase in kidneys (left) and livers (right) collected from 14-mo-old reverse BM-Rragc+/+ (n = 5) and reverse BM-RragcS74N/+ (n = 5) male mice. n, Dermal thickness measured in back skin of 14-mo-old reverse BM-Rragc+/+ (n = 5) and RragcS74N/+ (n = 4) males. Statistical significance was assessed by two-tailed Student’s t-test (b,eg,l,n); two-sided Fisher’s exact test (c,d); log-rank test (hk); and two-way ANOVA (m). Data are presented as mean ± s.d. (ln). Source data
Fig. 5
Fig. 5. Old RragcS74N/+ organs promote neutrophil infiltration.
a, Quantification of IHC staining for myeloperoxidase in kidneys (left) and livers (right) collected from 18-mo-old Rragc+/+ (n = 8) and RragcS74N/+ (n = 7) male mice. b, Reactive oxygen species production by neutrophils isolated from Rragc+/+ (n = 4) and RragcS74N/+ (n = 4) BM as assessed by flow cytometry with DHR 123 after a 20-min treatment with PMA at the indicated concentrations. c, Kinetics of phagocytosis of GFP+ E.coli expressed as a percentage of GFP+ cells by neutrophils isolated from Rragc+/+ (n = 3) and RragcS74N/+ (n = 3) BM. Data are presented as mean ± s.d. d, Experimental setup of the neutrophil adoptive transplant experiment. BM-derived neutrophils were isolated from 2–3-mo-old Rragc+/+ mice (CD45.1.1) and transplanted to 3-mo-old Rragc+/+ (CD45.2.2) and to 3-mo-old RragcS74N/+ (CD45.2.2) male hosts. e, Quantification of wt CD45.1.1 neutrophils in the indicated tissues from CD45.2.2 Rragc+/+ (n = 5) and RragcS74N/+ (n = 6) male hosts 16 h after the adoptive transplant. f, Quantification of CD45.1.1 wt neutrophils by IF in kidneys from CD45.2.2 Rragc+/+ (n = 4) and RragcS74N/+ (n = 6) host males. g, Experimental setup of the neutrophil adoptive transplant experiment. BM-derived neutrophils were isolated from 3-mo-old Rragc+/+ mice (CD45.1.1) and transplanted to 12–14-mo-old Rragc+/+ (CD45.2.2) and RragcS74N/+ (CD45.2.2) male hosts. h, Quantification of transferred wt CD45.1.1 neutrophils in the indicated tissues from CD45.2.2 Rragc+/+ (n = 3) and RragcS74N/+ (n = 3) male hosts 16 h after adoptive transplant. i, Quantification of transferred wt CD45.1.1 neutrophils by IF in kidneys from CD45.2.2 Rragc+/+ (n = 3) and RragcS74N/+ (n = 3) host males. Statistical significance was assessed by two-tailed Student’s t-test (ac,f,i) and two-way ANOVA (e,h). Data in b,c,e,f,h,i, are presented as mean ± s.d. Source data
Fig. 6
Fig. 6. Pro-inflammatory signals precede inflammation in young RragcS74N/+ organs.
a, Quantification of IHC staining for myeloperoxidase (left) and CD45 (right) in kidneys collected from 2–4-mo-old Rragc+/+ (n = 4) and RragcS74N/+ (n = 4) male mice. b, Representative H&E pictures from the same mice as in a, showing lack of inflammatory foci in kidney. Scale bars, 50 μm. c, Quantification of IHC staining for myeloperoxidase (left) and CD45 (right) in livers collected from 2–4-mo-old Rragc+/+ (n = 4) and RragcS74N/+ (n = 4) male mice. d, Representative H&E pictures in the same mice as in a, showing lack of inflammatory foci in liver. Scale bars, 50 μm. e, Graphical representation of the FDRs from the indicated Hallmark, REACTOME, WikiPathways and curated gene sets enriched (red) and downregulated (blue) in kidneys from 3-mo-old RragcS74N/+ (n = 5) versus Rragc+/+ (n = 5) mice. f, GSEA related to chemokines, integrins, cytokines, inflammatory pathways and IL signaling genes upregulated in old kidneys of NIA cohort in kidneys from 3-mo-old RragcS74N/+ (n = 5) versus Rragc+/+ (n = 5) mice. See Supplementary Table 2 for further details of the gene sets. g, Graphical representation of the FDRs from the indicated KEGG, Hallmark, REACTOME and Biocarta gene sets enriched in livers from 2–3.5-mo-old RragcS74N/+ (n = 4) versus Rragc+/+ (n = 4) mice. h, GSEA related to upregulated genes in old kidneys from CNIO (left) NIA cohort (right) in kidneys from 3-mo-old RragcS74N/+ (n = 5) versus Rragc+/+ (n = 5) mice. See Supplementary Table 2 for further details of the gene sets. Statistical significance was assessed by two-tailed Student’s t-test (a,c). Data (a,c) are presented as mean ± s.d. Source data
Fig. 7
Fig. 7. Myeloid cell depletion corrects markers of inflammaging and extends survival in RragcS74N/+ mice.
a, Quantification of neutrophils in peripheral blood before and after a 5-day treatment with anti-Gr1 or isotype control antibody from isotype-treated Rragc+/+ (n = 4), anti-Gr1-treated Rragc+/+ (n = 4), isotype-treated RragcS74N/+ (n = 4) and anti-Gr1-treated RragcS74N/+ (n = 3) 24-mo-old male mice. b, WBC count in isotype-treated Rragc+/+ (n = 5) and RragcS74N/+ (n = 7), anti-Gr1-treated Rragc+/+ (n = 6) and RragcS74N/+ (n = 7) 24-mo-old male mice. c, Quantification of cytokines in sera from isotype-treated RragcS74N/+ (n = 4) and anti-Gr1-treated RragcS74N/+ (n = 4) 24-mo-old male mice in a 5-day treatment measured by Legendplex assay. d, qRT–PCR analysis of SASP genes in the kidneys from isotype-treated Rragc+/+ (n = 5) and RragcS74N/+ (n = 7), anti-Gr1-treated Rragc+/+ (n = 6) and RragcS74N/+ (n = 7) 18-mo-old male mice. e, Quantification of SA-β-gal+ area within the kidney area of isotype-treated Rragc+/+ (n = 5) and RragcS74N/+ (n = 7), anti-Gr1-treated Rragc+/+ (n = 6) and RragcS74N/+ (n = 7) of 18-mo-old mice. f, Dermal thickness in back skin of the same mice as in e. g, Quantification of IHC of CD45+ cells in skin from the same mice as in f. h, Incidence of infiltrated inflammatory cells in livers from mice in e. i, Kaplan–Meier survival curves of control (n = 5) and anti-Gr1-treated (n = 9) Rragc+/+ mice (left) and controls (n = 6) and anti-Gr1-treated (n = 10) RragcS74N/+ mice (right). j, Survival since the first dose of anti-Gr1 of the mice in k. k, qRT–PCR analysis of Vcam1 in kidneys of young (4-mo-old) and old (18-mo-old) Rragc+/+ (young, n = 8; old, n = 8) and RragcS74N/+ (young, n = 8; old, n = 8) male mice. l, Representative IHC staining of Vcam1 in kidney from 18-mo-old Rragc+/+ and RragcS74N/+ mice. m, Quantification of transferred wt CD45.1.1 neutrophils by IF in kidneys from CD45.2.2 host males treated with PBS (Rragc+/+ (n = 3); RragcS74mut/+ (n = 3)) or anti-Vcam1 (Rragc+/+ (n = 3); RragcS74mut/+ (n = 3)). Statistical significance was assessed by one-tailed Student’s t-test (a); two-tailed Student’s t-test (eg, j,k); two-sided Fisher’s exact test (h); two-way ANOVA (bd,m); and log-rank test (l). Data (b,eg,j,k,m) are mean ± s.d. Source data
Extended Data Fig. 1
Extended Data Fig. 1. Rragc-mutant mice have shortened lifespan.
a. Chromatogram of the Rragcwt and RragcS74N allele. RragcS74N allele encodes two amino acid substitutions (blue bold), plus silent diagnostic mutations (purple). b. Progenies of RragcS74N breeding schemes. c. MEFs from Rragc+/+ and RragcS74N/+ mice were deprived of all amino acids in RPMI medium with dialyzed serum for the indicated time-points. d. Quantification of P-T389-S6K1 and TFEB upper band (phosphorylated) from triplicates from Fig. 1a and Figure S1c (Statistical significance was calculated by two-tailed Student’s t-test for AUC). Data are presented as mean values ± SD. e. (Left) MEFs from Rragc+/+ (n = 4 biologically independent cells), RragcS74N/+ (n = 4 biologically independent cells), and RragcS74N/S74N (n = 2 biologically independent cells), mice were deprived from and re-stimulated with amino acids for 10 min. (Right) Quantification of P-T389-S6K1 and TFEB upper band in -AA samples. Data are presented as mean values ± SD f. (Left) Immunofluorescence of TFEB in Rragc+/+ and RragcS74N/S74N MEFs in RPMI with and without amino acids; (Right) with the percentage of nuclear TFEB per cell (Rragc+/+ + AA n = 112 –AA n = 117; RragcS74N/S74N + AA n = 72 –AA n = 91). Bars represent 100μm g. TFE3 and TFEB levels fractions of hearts from Rragc+/+ (n = 3) and RragcS74N/+ (n = 3) mice after fasting. h. Quantification of TFE3 and TFEB levels in the nucleus. Data are presented as mean values ± SD. i. Representative anti-TFEB IHC (left) and quantification (right) of TFEB-positive cells in the cytoplasm (Ct), nucleus (N) and cytoplasm&nucleus (Ct&N) in renal tubules from young Rragc+/+ (n = 4) and RragcS74N/+ (n = 4) male mice. Scale bar 100 µm. j. Kaplan–Meier survival curves of Rragc+/+ (n = 18) and RragcS74N/+ (n = 20) male mice (left), Rragc+/+ (n = 19) and RragcS74C/+ (n = 13) male mice (center) and Rragc+/+ (n = 18) and RragcT89N/+ (n = 19) male mice (right). k. Kaplan–Meier survival curves of Rragc+/+ (n = 21) and RragcS74N/+ (n = 24) female mice (left), Rragc+/+ (n = 19) and RragcS74C/+ (n = 23) female mice (center) and Rragc+/+ (n = 17) and RragcT89N/+ (n = 22) female mice (right). l. Kaplan–Meier survival curves of Rragc+/+ (n = 9) and RragcS74N/+ (n = 24) mice that were free of detectable malignant tumors at the time of death. m. Kaplan–Meier survival curves of Rragc+/+ (n = 10) and Rragc S74C/+ (n = 17) mice without malignant tumors. In j-m, statistical significance was calculated with the log-rank test. n. Bone mineral density (BMD) measured in 13.5-21.5-month-old Rragc+/+ (n = 17) and RragcS74N/+ (n = 21) male mice. o. Blood pressure in 16-19-month-old Rragc+/+ (n = 6) and RragcS74N/+ (n = 7) male mice. p. Hematological parameters in 3–5- and 18-month-old Rragc+/+ (young, n = 8; old, n = 16) and RragcS74N/+ (young, n = 9; old, n = 14) male mice. q. Representative anti-p21 IHC in kidneys from 18-month-old Rragc+/+ and RragcS74N/+ male mice. Bars represents 20 μm. Arrows indicate p21-positive cells. r. Representative anti-p21 IHC (left) and quantification (right) from pancreas harvested from 18-month-old Rragc+/+ (n = 3) and RragcS74N/+ (n = 5) male mice. Bars represent 200 μm. Statistical significance in e, h, n, p and r was calculated by two-tailed Student’s t-test. Statistical significance in f was calculated by one-way ANOVA and Tukey’s multiple comparisons test. Statistical significance in a and i was calculated by by two-sided Fisher’s exact test. Statistical significance in o was calculated by Two-way Anova. Source data
Extended Data Fig. 2
Extended Data Fig. 2. Old Rragc-mutant mice show an inflammaging phenotype.
a. Percentage of mice with increased creatinine levels (>0.2 mg/dL) measured in blood from 18-month-old Rragc+/+ (n = 12) and RragcS74N + S74C/+ (n = 12) male mice. Statistical significance was calculated by two-sided Fisher’s exact test. b. Amylase levels measured in blood from 18-month-old Rragc+/+ (n = 11) and RragcS74N + S74C/+ (n = 12) male mice. Statistical significance was calculated by two-tailed Student’s t-test. Data are presented as mean values ± SD. c. Principal component analysis (PCA) from the RNA-seq performed from kidney samples from 18-month-old Rragc+/+ (n = 5) and RragcS74N/+ (n = 5) mice. d. Gene set enrichment analysis (GSEA) related to inflammatory signatures, TFEB target genes, and genes involved in senescence-associated secretory phenotype in kidneys from 18-month-old RragcS74N/+ (n = 5) versus Rragc+/+ (n = 5) mice. e. Graphical representation of the false discover rates (FDRs) from the indicated KEGG, Hallmark, REACTOME and Wikipathways gene sets enriched in kidneys from RragcS74N/+ (n = 5) versus Rragc+/+ (n = 5) 18-month-old mice. f. Western blot of harvested kidneys from 16-month-old Rragc+/+ and RragcS74N/+ male mice fed with control chow or with rapamycin-supplemented chow for 2 months. g. Kaplan–Meier survival curves of control (n = 21) and rapamycin-treated Rragc+/+ (n = 24) mice. Statistical significance was calculated with the log-rank test. h. Kaplan–Meier survival curves of control (n = 23) and rapamycin-treated RragcS74mut/+ (n = 23) mice. Statistical significance was calculated with the log-rank test. i. Incidence of infiltrated inflammatory cells in the indicated tissues from 16-month-old Rragc+/+ (n = 7) and RragcS74N/+(n = 8) mice treated with rapamycin for 2 months. Statistical significance was calculated by two-sided Fisher’s exact test. j. Kaplan–Meier survival curves of Ighm-/-; Rragc+/+ (n = 28) and Ighm-/-; RragcS74C/+ (n = 25) mice. Statistical significance was calculated with the log-rank test. k. Incidence of infiltrated inflammatory cells in the indicated tissues from Ighm-/-; Rragc+/+ (n = 7) and Ighm-/-; RragcS74C/+ (n = 8) mice analyzed at humane end point. Statistical significance was calculated by two-sided Fisher’s exact test. Source data
Extended Data Fig. 3
Extended Data Fig. 3. Similarities between changes in Rragc-mutant mice and physiological aging in mice and humans.
a. Gene set enrichment analysis (GSEA) related to TFEB target genes in kidneys for CNIO cohort from 16-month-old wt (n = 5) versus 3-month-old (n = 4) mice. b. Gene set enrichment analysis (GSEA) related to TFEB target genes in kidneys for NIA cohort from 24-month-old wt (n = 5) versus 2-month-old (n = 5) mice. c. qRT–PCR analysis of TFEB target in kidney from 3-month-old wt (n = 8) and 16-month-old wt (n = 7) male mice. Statistical significance was calculated by two-way ANOVA. Data are presented as mean values ± SD. d. Gene set enrichment analysis (GSEA) related to TFEB target genes in PBMCs for the Spanish Centenarian Study Group (SCSG) cohort (Borras et al. 2016) from Septuagenarians (74-75 yr old) (n = 10) versus Young (24-41 yr old) (n = 10) individuals. Source data
Extended Data Fig. 4
Extended Data Fig. 4. Rragc-mutant ‘reverse’ BM chimeras exhibit shortened longevity.
a. Percentage of the indicated cell populations in the spleen of 18-month-old BM-Rragc+/+ (n = 9) and BM-RragcS74C/+ (n = 10) male mice. (B: B cells, T: T cells, Neu: neutrophils, Mon: monocytes, NK: natural killers, DC: dendritic cells, Mac: macrophages and Eos: eosinophils. b. Hematological parameters (hemoglobin and hematocrit) measured in 18-month-old BM-Rragc+/+ (n = 10) and BM-RragcS74C/+ (n = 11) male mice. c. qRT–PCR analysis of genes of the senescence-associated secretory phenotype (SASP) genes in kidneys from 18-month-old BM-Rragc+/+ (n = 12) and BM-RragcS74C/+ (n = 12) male mice. Data are presented as mean values ± SD. d. qRT–PCR analysis of genes of the senescence-associated secretory phenotype (SASP) in pancreas from 18-month-old BM-Rragc+/+ (n = 12) and BM-RragcS74C/+ (n = 12) male mice. Data are presented as mean values ± SD. e. Incidence of infiltrated inflammatory cells in the indicated tissues from 400 days-old Rragc+/+ (n = 5) and RragcS74N/+(n = 5) male hosts. f. Quantification of SA-β-gal+ area within the kidney area (left), p21 in kidney (center) and liver (right) from 400 days-old Rragc+/+ (n = 5) and RragcS74N/+(n = 5) male hosts. Data are presented as mean values ± SD. g. Quantification of inflammatory cytokines in sera from 390 days-old Rragc+/+ (n = 9) and RragcS74N/+(n = 7) male hosts measured by Legendplex assay using flow cytometry. Statistical significance in a, b and f was calculated by two-tailed Student’s t-test. Statistical significance in c and d was calculated by two-way ANOVA. Statistical significance in e and g was calculated by two-sided Fisher exact test. Source data
Extended Data Fig. 5
Extended Data Fig. 5. Old RragcS74N/+ organs promote neutrophil infiltration.
a. Representative IHC for myeloperoxidase (MPO) from kidneys harvested from 18-month-old Rragc+/+ and RragcS74N/+ male mice. Bars represents 100 μm. b. Representative IHC for myeloperoxidase (MPO) from livers harvested from 18-month-old Rragc+/+ and RragcS74N/+ male mice. Bars represents 100 μm. c. Volcano plot from RNA-seq performed in 6-8-week-old RragcS74N/+ (n = 4) versus 6-8-week-old Rragc+/+ (n = 5) neutrophils isolated from BM. Differential expression was performed with DESeq, using a 0.05 FDR. d. Gene set enrichment analysis (GSEA) related to TFEB target genes, NFKBIA target genes and genes involved in apoptosis in 6-8-week-old RragcS74N/+ (n = 4) versus 6-8-week-old Rragc+/+ (n = 5) neutrophils isolated from BM. e. Quantification of aged neutrophils (CD11b+/Ly6G+/CD62L-/CXCR4+, left) and fresh neutrophils (CD11b+/Ly6G+/CD62L+/CXCR2+, right) by flow cytometry in 2-month-old Rragc+/+ (n = 2) and RragcS74N/+ (n = 3) male mice and in 16-month-old Rragc+/+ (n = 5) and RragcS74N/+ (n = 5) male mice. Statistical significance was calculated by two-way ANOVA. Data are presented as mean values ± SD. f. Experimental setup of the neutrophil adoptive transplant experiment. BM-derived neutrophils were isolated from 10-week-old Rragc+/+ mice (CD45.1.2) and 10-week-old RragcS74N/+ (CD45.2.2) and transplanted at 1:1 ratio to 16-week-old Rragc+/+ (CD45.1.1) hosts. g. Ratio of CD45.2.2/CD45.1.1 transplanted neutrophils in blood, spleen and BM 16 h (n = 3 biological replicates) and 40 h (n = 3 biological replicates) after adoptive transfer as described in f. Data are presented as mean values ± SD. Statistical significance was calculated by two-tailed Student’s t-test. h. Representative images of IF depicting CD45.1 positive cells in kidneys from young male hosts. Bars represent 20 μm. i. Representative images of IF depicting CD45.1 positive cells in kidneys from old male hosts. Bars represent 20 μm. Source data
Extended Data Fig. 6
Extended Data Fig. 6. Pro-inflammatory signals precede inflammation in young RragcS74N/+ organs.
a. Representative images from anti-MPO and anti-CD45 immunostainings of kidneys harvested from 8-15-week-old Rragc+/+ and RragcS74N/+ male mice. Bars represent 50 μm b. Representative images from anti-MPO and anti-CD45 immunostainings of livers harvested from 8-15-week-old Rragc+/+and RragcS74N/+ male mice. Bars represent 50 μm. c. Principal component analysis (PCA) from the RNA-seq performed from kidney samples from 3-month-old Rragc+/+ (n = 5) and RragcS74N/+ (n = 5) mice. d. Gene set enrichment analysis (GSEA) related to inflammatory signatures, TFEB target genes, and mTORC1 signaling associated genes in kidneys from 3-month-old RragcS74N/+ (n = 5) versus Rragc+/+ (n = 5) mice. e. Principal component analysis (PCA) from the RNA-seq performed from liver samples from 3-month-old Rragc+/+ (n = 4) and RragcS74N/+ (n = 4) mice. f. Gene set enrichment analysis (GSEA) related to inflammatory signatures and mTORC1 signaling associated genes in livers from 2–3.5-month-old RragcS74N/+ (n = 4) versus Rragc+/+ (n = 4) mice.
Extended Data Fig. 7
Extended Data Fig. 7. Myeloid cell depletion corrects markers of inflammaging and extends survival in RragcS74N/+ mice.
a. Experimental setup for α-Gr1 acute treatment. Rragc+/+ and RragcS74N/+ male mice were treated with 200μg of α-Gr1 or isotype at day 0, 2 and 4. At 5d, mice were euthanized and blood and tissues were collected. b. Quantification of SA-β-gal+ area within the kidney area of 2 y old isotype-treated Rragc+/+ (n = 5), anti-Gr1 treated Rragc+/+ (n = 7), isotype-treated RragcS74N/+ (n = 6), anti-Gr1-treated RragcS74N/+ (n = 7) 2 y old male mice. Data are presented as mean values ± SD. c. Dermal thickness measured in back skin of isotype-treated Rragc+/+ (n = 5), anti-Gr1-treated Rragc+/+ (n = 7), isotype-treated RragcS74N/+ (n = 6), anti-Gr1-treated RragcS74N/+ (n = 7) 2-year-old male mice. Data are presented as mean values ± SD. d. Experimental setup for three-week anti-Gr1 treatment. One-and-a-half-year-old male mice were treated with 200μg of anti-Gr1 or isotype control every other day for 23d, and mice were sacrificed and blood and tissues were processed. e. Percentage of neutrophils measured in blood before and after a 23-day treatment of anti-Gr1 treated Rragc+/+ (n = 5) and anti-Gr1-treated RragcS74N/+ (n = 7) 18-m-old male mice. Statistical significance was calculated by one-tailed Student’s t-test. f. Quantification of inflammatory cytokines in sera from isotype-treated Rragc+/+ (n = 5), anti-Gr1-treated Rragc+/+ (n = 6), isotype-treated RragcS74N/+ (n = 7), anti-Gr1-treated RragcS74N/+ (n = 6) 18-month-old male mice after a 23-day treatment. g. Concentration of the indicated cytokines in sera from isotype-treated Rragc+/+ (n = 5), anti-Gr1 treated Rragc+/+ (n = 6), isotype-treated RragcS74N/+ (n = 7), anti-Gr1 treated RragcS74N/+ (n = 6) 1.5-year-old male mice. Data are presented as mean values ± SD. h. Representative pictures of SA β-gal stains from isotype-and anti-Gr1-treated mice. i. Experimental setup for extended anti-Gr1 survival experiment. One-year-old Rragc+/+ and RragcS74N/+ male mice were treated either with PBS or anti-Gr1 every other day for two weeks, followed by a resting period of 3 weeks. This regimen was repeated five times so mice received either PBS or anti-Gr1 antibody intermittently during approximately 6 months. j. Quantification of SA-β-gal+ area within the kidney area of mice under the regime described in j. PBS-treated Rragc+/+ (n = 4), anti-Gr1-treated Rragc+/+ (n = 7), PBS-treated RragcS74N/+ (n = 6), anti-Gr1 treated RragcS74N/+ (n = 10) males. Kidneys were harvested at humane end point. Data are presented as mean values ± SD. k. Incidence of infiltrated inflammatory cells in the indicated tissues from PBS-treated Rragc+/+ (n = 5), anti-Gr1-treated Rragc+/+ (n = 7), PBS-treated RragcS74N/+ (n = 6) and anti-Gr1-treated RragcS74N/+ (n = 10) mice. Statistical significance was calculated by two-sided Fisher’s exact test. l. Heatmap of integrins and chemokines upregulated in kidney from Rragc+/+ (n = 5) and RragcS74N/+ (n = 5) mice. Out of 91 genes, 25 genes related to TFEB were selected based on literature and 9 were negatively regulated by TFEB (based on literature); 7 out of 9 were validated by qRT–PCR and finally, Vcam1 was selected for functional assays. m. qRT–PCR analysis of integrins and chemokines negatively regulated by TFEB in kidneys of young (4-month-old) and old (18-month-old) Rragc+/+ (young, n = 8; old, n = 8) and RragcS74N/+ (young, n = 8; old, n = 8) male mice. Data are presented as mean values ± SD. n. Immunoblot and quantification for Vcam1 from 4-month-old Rragc+/+ (n = 3 biological independent samples) and RragcS74N/+ (n = 3 biological independent samples) and 18-month-old Rragc+/+ (n = 4 biological independent samples) and RragcS74N/+ (n = 4 biological independent samples) male mice. Data are presented as mean values ± SD. o. Experimental setup for α-Vcam1 treatment and neutrophil adoptive transplant. Mice were treated with PBS or 1.5 mg/kg of α-Vcam1 three consecutive days and one hour after the last dose, CD45.1.1 BM-isolated neutrophils were transplanted to 16-24-month-old Rragc+/+ (CD45.2.2) and RragcS74N/+ (CD45.2.2) male and female hosts. Statistical significance in a, b, j, m, and n was calculated by two-tailed Student’s t-test. Statistical significance in f and g was calculated by two-way ANOVA. Source data

Similar articles

Cited by

References

    1. Suzman, R. & Beard, J. Global Health and Aging (World Health Organization, 2011).
    1. López-Otín, C., Blasco, M. A., Partridge, L., Serrano, M. & Kroemer, G. The hallmarks of aging. Cell10.1016/j.cell.2013.05.039 (2013). - PMC - PubMed
    1. Singh, P. P., Demmitt, B. A., Nath, R. D. & Brunet, A. The genetics of aging: a vertebrate perspective. Cell10.1016/j.cell.2019.02.038 (2019). - PMC - PubMed
    1. Saxton, R. A. & Sabatini, D. M. mTOR signaling in growth, metabolism, and disease. Cell10.1016/j.cell.2017.02.004 (2017). - PMC - PubMed
    1. Green, C. L., Lamming, D. W. & Fontana, L. Molecular mechanisms of dietary restriction promoting health and longevity. Nat. Rev. Mol. Cell Biol.10.1038/s41580-021-00411-4 (2022). - PMC - PubMed

Substances