. 2024 Jul;26(7):1154-1164.
doi: 10.1038/s41556-024-01439-2. Epub 2024 Jun 7.

Valine aminoacyl-tRNA synthetase promotes therapy resistance in melanoma

Affiliations

Valine aminoacyl-tRNA synthetase promotes therapy resistance in melanoma

Najla El-Hachem et al. Nat Cell Biol. 2024 Jul.

Abstract

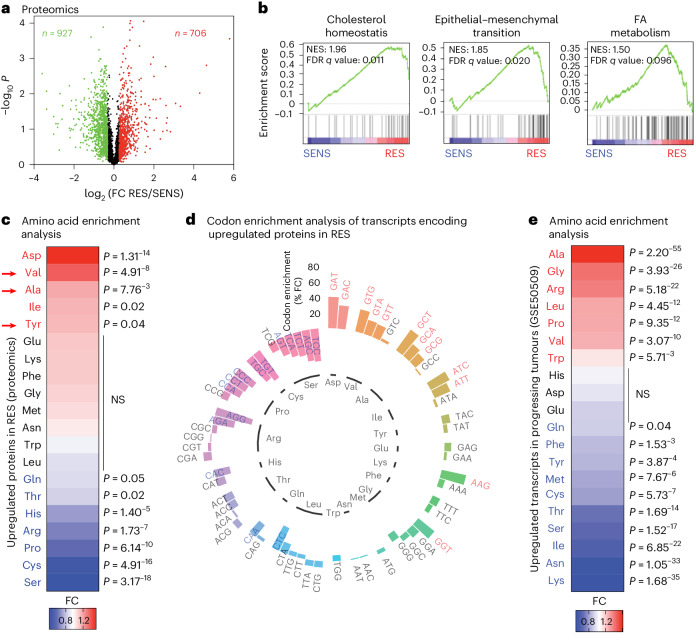
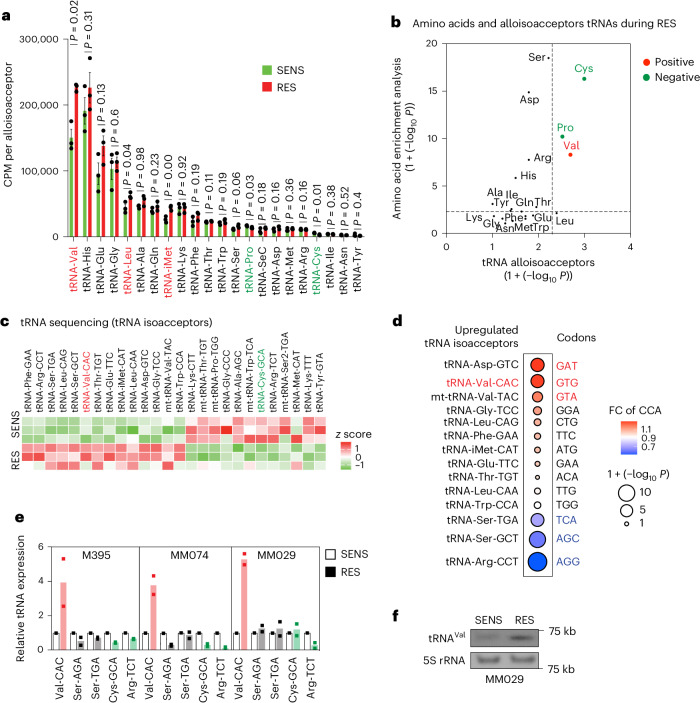
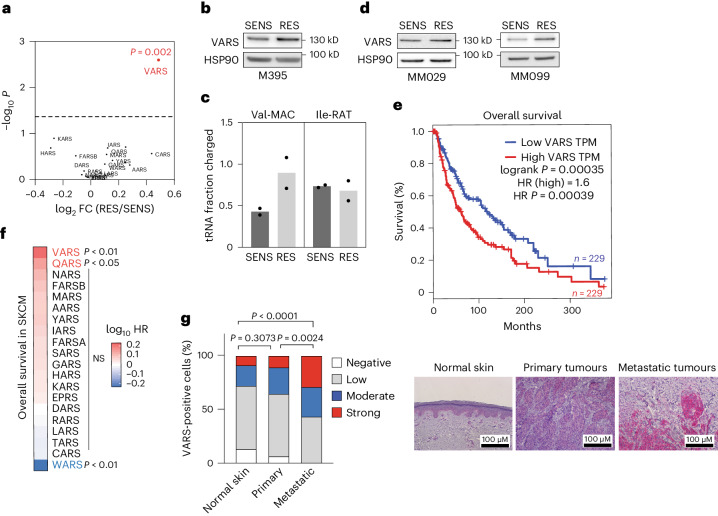
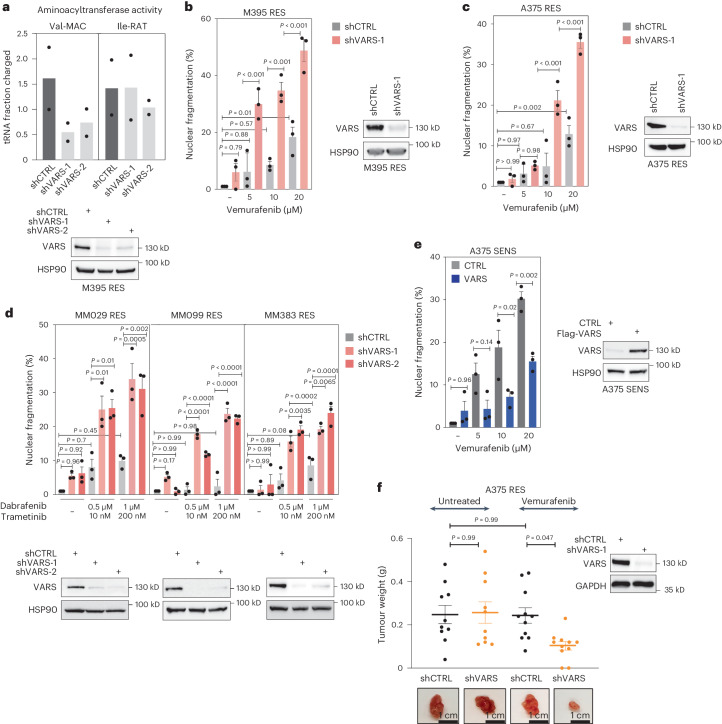
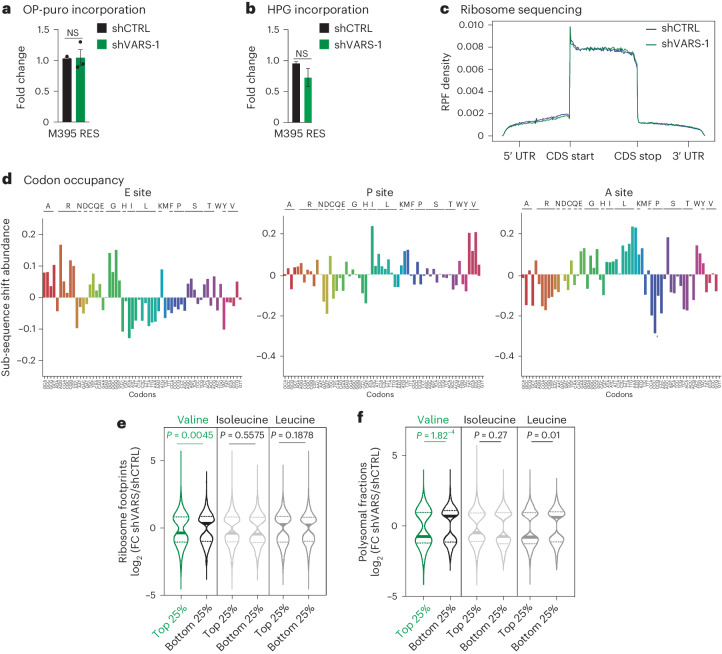
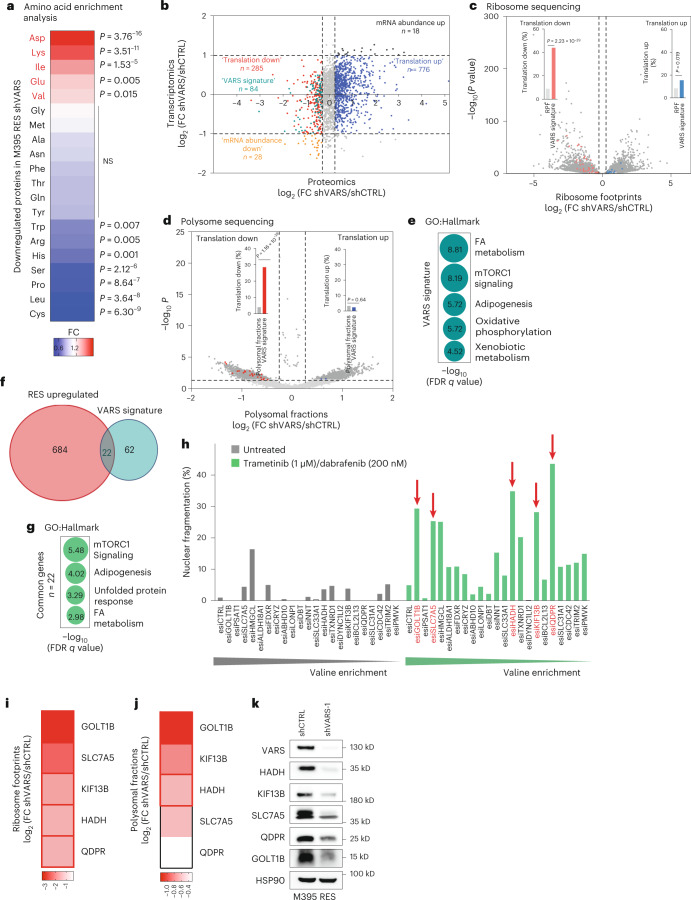
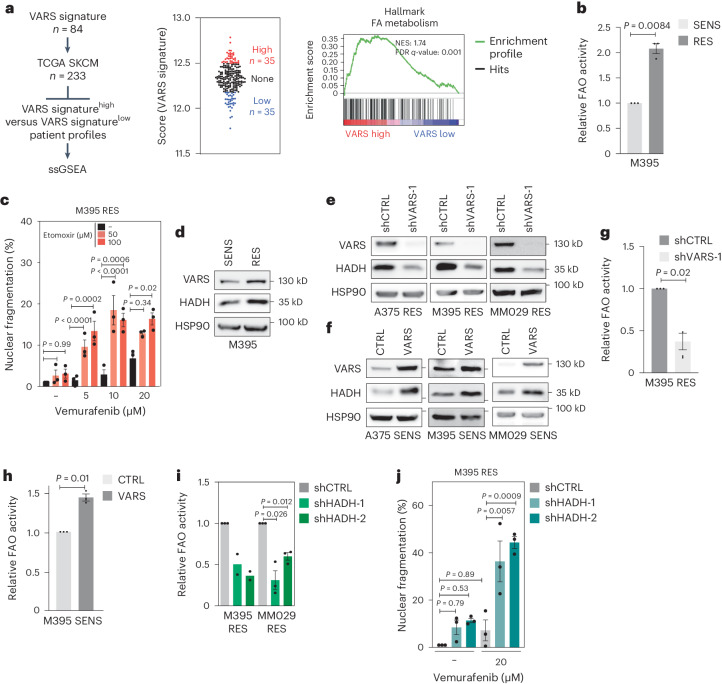
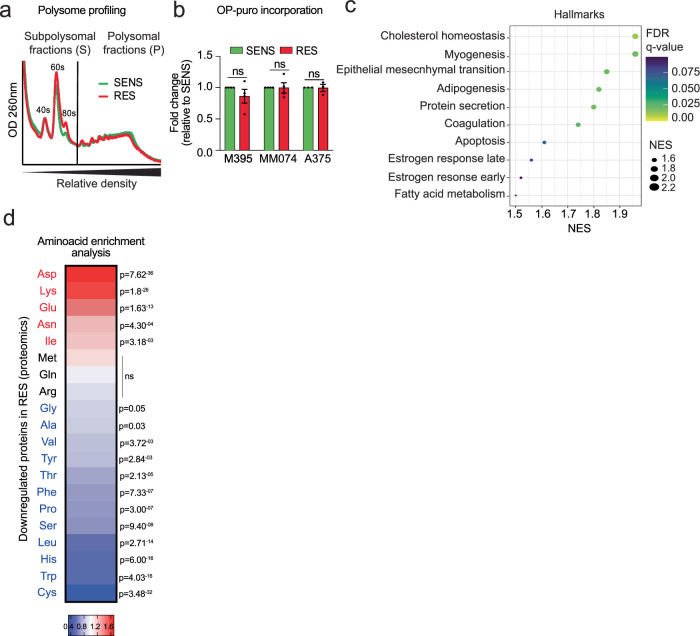
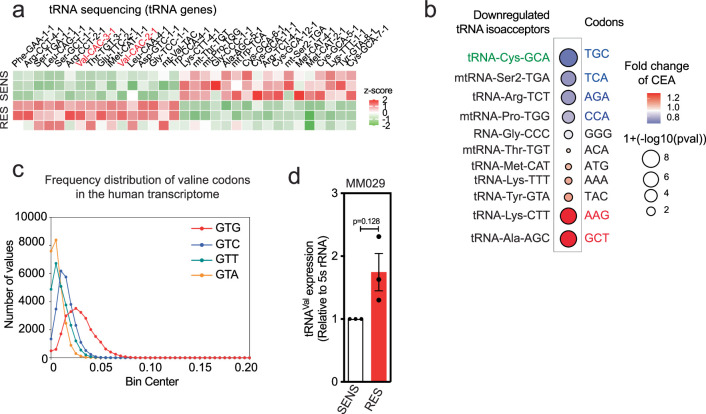
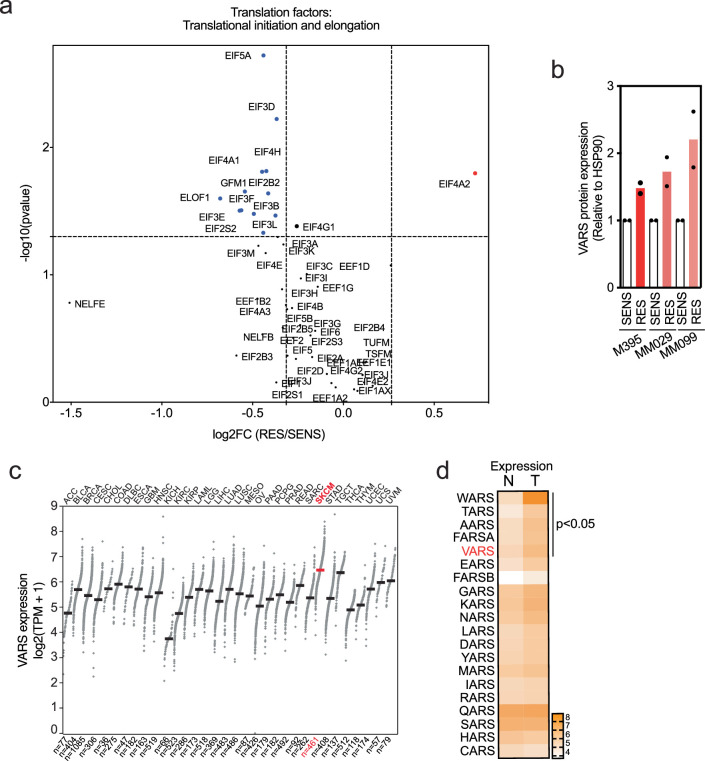
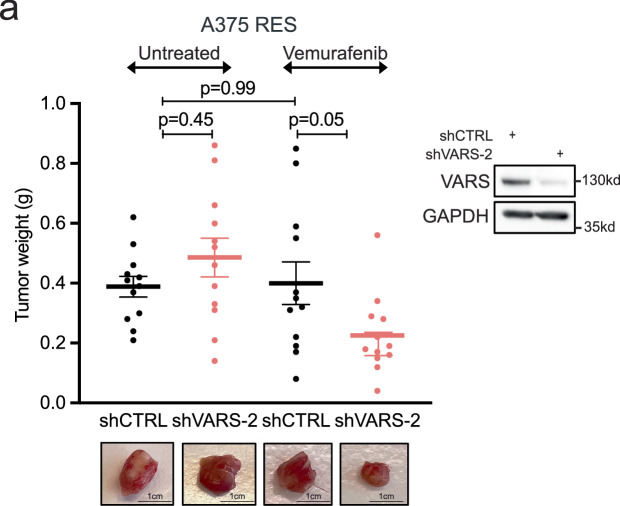
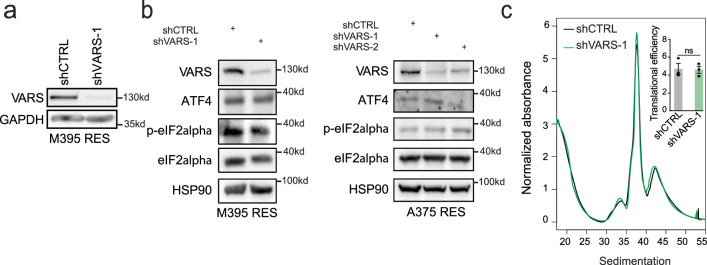
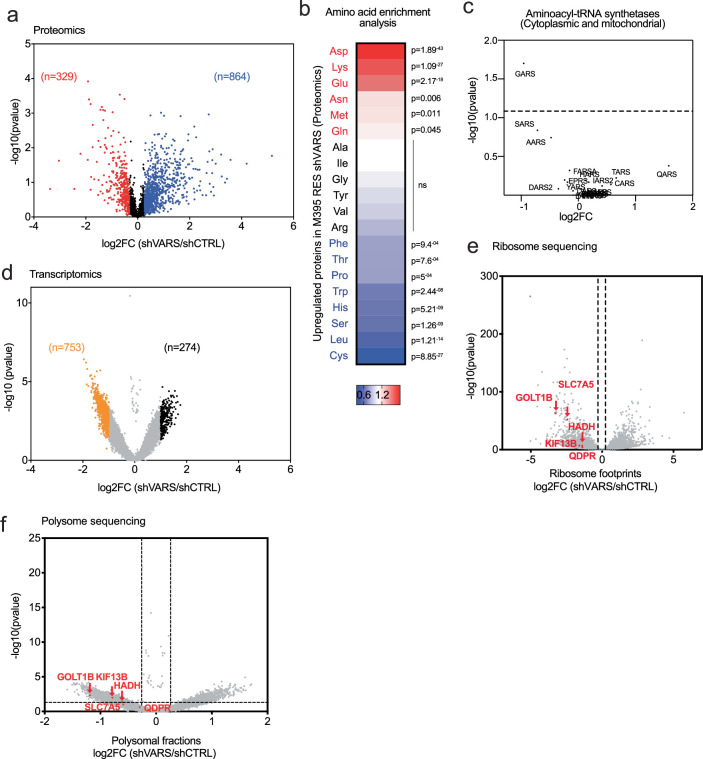
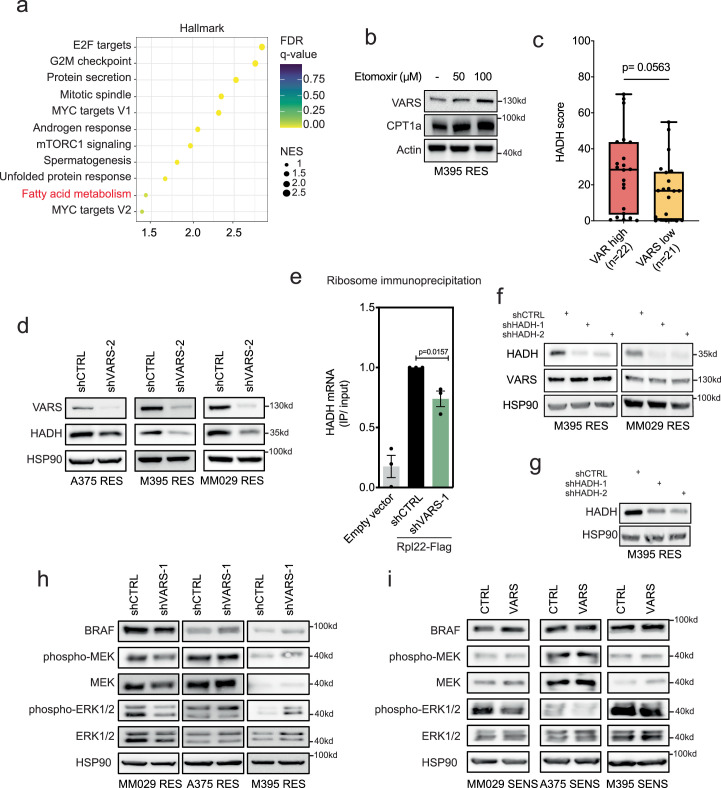
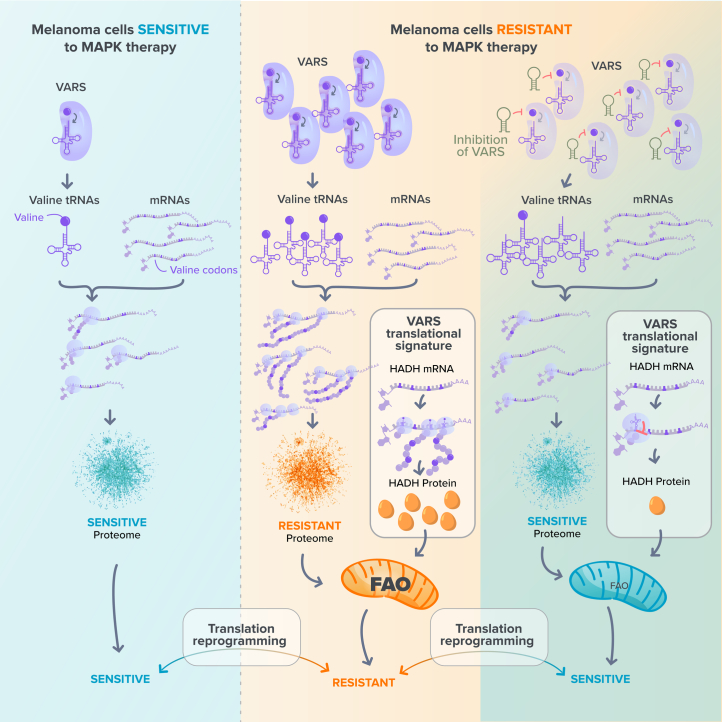
Transfer RNA dynamics contribute to cancer development through regulation of codon-specific messenger RNA translation. Specific aminoacyl-tRNA synthetases can either promote or suppress tumourigenesis. Here we show that valine aminoacyl-tRNA synthetase (VARS) is a key player in the codon-biased translation reprogramming induced by resistance to targeted (MAPK) therapy in melanoma. The proteome rewiring in patient-derived MAPK therapy-resistant melanoma is biased towards the usage of valine and coincides with the upregulation of valine cognate tRNAs and of VARS expression and activity. Strikingly, VARS knockdown re-sensitizes MAPK-therapy-resistant patient-derived melanoma in vitro and in vivo. Mechanistically, VARS regulates the messenger RNA translation of valine-enriched transcripts, among which hydroxyacyl-CoA dehydrogenase mRNA encodes for a key enzyme in fatty acid oxidation. Resistant melanoma cultures rely on fatty acid oxidation and hydroxyacyl-CoA dehydrogenase for their survival upon MAPK treatment. Together, our data demonstrate that VARS may represent an attractive therapeutic target for the treatment of therapy-resistant melanoma.


Conflict of interest statement

The authors declare no competing interests.

Figures

Fig. 1
Fig. 1. Valine is enriched in proteins upregulated during resistance to MAPK therapy.
a, Volcano plots showing P values (−log10) of two-tailed unpaired t-tests versus the log2 fold change (FC) of the proteomics analysis of melanoma M395 SENS or RES to vemurafenib (n = 3); red indicates upregulated and green indicates downregulated proteins (n = 3). b, GSEA analysis using the Hallmark database. Normalized enrichment score (NES) and false discovery rate (FDR) q values are added for each dataset. c, A heat map representing amino acids enrichment analysis. d, A circular plot representing codon content analysis in transcripts encoding proteins upregulated in M395 RES compared with the genome. e, A heat map representing amino acids analysis of mRNA from progressing tumours after treatment (GSE50509). The significance of amino acid and codon enrichment was calculated using a chi-squared test (ce). The significant differences are represented; the red indicates an enrichment and blue an impoverishment. NS, not significant. Source data
Fig. 2
Fig. 2. Valine tRNAs are upregulated in resistant melanoma.
a, A histogram showing all tRNA alloisoacceptors in M395 SENS and RES cultures (sum ± s.e.m. of n = 3 independent replicates, and a two-tailed unpaired t-test was performed); red represents the significantly upregulated tRNAs in RES and green represents the significantly downregulated tRNAs in RES. b, Correlation between significant changes in amino acids from the amino acid content analysis (chi-squared test) and the tRNA alloisoacceptors (two-tailed unpaired t-test; no adjustment was used for these comparisons). The red represents the enriched amino acids and increase in the corresponding tRNAs, and the green represents impoverished amino acids and corresponding tRNAs. c, A heat map representing the z scores of significantly modified tRNA isoacceptors (by tRNA sequencing) in M395 SENS and RES cultures (n = 3). The red represents tRNA-Val-CAC as one of the upregulated tRNAs isoacceptors in RES and the green represents tRNA-Cys-GCA as one of the downregulated tRNAs isoacceptors in RES. d, Correlation between significant changes in codons from the CCA (chi-squared test) and the upregulated tRNA isoacceptors (two-tailed unpaired t-test; no adjustment was used for these comparisons). The red represents enriched codons and increase in the corresponding isoacceptors tRNAs and the blue represents the impoverished codons and corresponding isoacceptors tRNAs. e, Relative expression (FC) of the indicated tRNAs assessed by RT–qPCR analysis (after tRNA demodification) in various SENS and RES cell cultures (n = 2). Red, increased expression; green, decreased expression. f, Northern blot representing tRNA-Val-CAC in SENS and RES MM029 melanoma cultures. A 5S rRNA is shown for normalization purpose. Source data
Fig. 3
Fig. 3. VARS activity is increased in melanoma resistant to targeted therapy.
a, Expression of aaRSs in M395 RES cultures (proteomics; n = 3, two-tailed unpaired t-test). b, VARS expression in SENS and RES cultures as confirmed by western blot (n = 2). c, Val-MAC tRNA and Ile-RAT tRNA aminoacylation analysis of M395 SENS and RES cells (mean ± s.e.m. of n = 2 independent replicates). d, VARS expression in SENS and RES to dual MAPK-targeted therapy (n = 2). e, Survival analysis of patients with SKCM with high or low expression of VARS. TPM, transcripts per million. HR, hazards ratio. f, Evaluation of the skin of patients with cutaneous melanoma overall survival (data from TCGA) related to the expression of all the tRNA synthetase. VARS expression is associated with the poorest prognosis in patients with SKCM. The P values were obtained from GEPIA2. g, VARS immunostaining in patients with normal skin (n = 12) and primary (n = 12) or metastatic (n = 21) melanoma biopsies. The representative images and quantifications are shown, and a chi-squared test was performed. Source data
Fig. 4
Fig. 4. VARS depletion re-sensitizes resistant melanoma cells to MAPK-based therapy.
a, Val-MAC-tRNA and Ile-RAT-tRNA aminoacylation activity of M395 RES cells depleted of VARS using two shRNAs (mean ± s.e.m. of n = 2 independent replicates). bd, Cell death of patient-derived melanoma measured by fluorescence staining with PI by FACS of M395 RES (b), A375 RES (c) and a series of patient-derived melanoma cultures resistant to the drug combination BRAFi/MEKi (d). The cells were treated or not treated with vemurafenib (as indicated in b and c) or with dabrafenib/trametinib (as indicated in d) and depleted or not of VARS. e, As in b and c but with SENS cells overexpressing VARS. CTRL, control overexpression. f, A375 RES control or VARS-depleted melanoma cells were xenografted in mice and treated or not with vemurafenib (25 mg kg−1) (n = 10 for untreated and n = 11 for vemurafenib treated mice). Tumour weight mean ± s.e.m. was assessed and plotted. The mean ± s.e.m. of n = 3 independent replicates is indicated for b, c, d and e. A two-way analysis of variance was performed for bf (P < 0.0001). Tukey’s multiple comparisons are indicated in the figures. Source data
Fig. 5
Fig. 5. VARS regulates the translation of valine rich transcripts.
a,b, OP-puro (a) and HPG (b) incorporation relative to control in M395 RES melanoma cultures depleted or not depleted of VARS (fold mean ± s.e.m. of n = 3 independent replicates; a two-tailed unpaired t-test was performed). c, Metagene density profiles depicting global RPFs in coding sequences (CDS) in M395 RES cells after VARS depletion (green) as compared with control (blue). The y axis shows the average intra-gene normalized density of RPFs for each transcript. UTR, untranslated region. d, Diricore analysis plots at the E site, P site and A site (positions 9, 12 and 15, respectively), analysing differential RPFs density at codons in M395 RES shVARS as compared with shCTRL. e,f, Violin plots representing the log2 FC of significantly regulated transcripts of shVARS as compared to control in ribosome sequencing (e) or polysome sequencing (f). The transcripts are sorted based on their enrichment (top 25%) or impoverishment (bottom 25%) in the indicated amino acids (two-tailed unpaired t-test). Source data
Fig. 6
Fig. 6. VARS translation targets in the resistant melanoma phenotype.
a, A heat map representing amino acid enrichment analysis of proteins (proteomics) downregulated in M395 RES depleted of VARS (chi-squared test). b, A graph representing genes commonly detected by RNA sequencing (y axis) and proteomics (x axis) of M395 RES VARS-depleted cells (shVARS-1) compared with control cells (shCTRL). Four groups were assigned depending on their log2 FC. ‘Translation down’ and ‘translation up’ groups were appointed with: −1 < log2 FC (y axis) < 1 and log2 FC (x axis) < −0.32 or 1 < log2 FC (x axis) < 1 and log2 FC (x axis) > 0.32, respectively. c,d, The VARS signature was superposed with genes presenting differential RPFs (c) or polysomal fractions (d) of control (shCTRL) or VARS-depleted cells (shVARS) (chi-squared test). e, A bubble plot of the top five enriched terms (using Gene Ontology (GO) Hallmark) for VARS signature (n = 84). The size of the bubble represents the −log10 (FDR q value). f, A Venn diagram highlighting 22 proteins commonly overlapping in proteins that are upregulated during RES (n = 706) and in VARS signature (n = 84). g, A bubble plot of the top five enriched (using GO Hallmark) for the 22 valine-enriched candidates. The size of the bubble represents the log10 (FDR q value). h, Cell death measurement of MM029 resistant to trametinib/dabrafenib by fluorescence staining with PI by FACS after the depletion of the indicated candidate using specific esiRNA and after treatment or not with the indicated drug combination. The red arrows depict the top five candidates (showing highest percentage of nuclear fragmentation upon treatment with no or little nuclear fragmentation in untreated condition) (n = 1). i,j, Heat maps highlighting the log2 (FC shVARS/shCTRL) of the top five candidates (HADH, KIF13B, SLC7A5, QDPR and GOLT1B) in ribosome footprints (i) and polysomal fractions (j). The red squares represent significant values. k, Western blot analysis of VARS and the indicated proteins expression in control (shCTRL) and VARS (shVARS)-depleted M395 RES cultures (n = 1). Source data
Fig. 7
Fig. 7. VARS controls the FA metabolism in resistant melanoma cells.
a, Experimental set-up showing the score attribution for VARS signature (high and low) in patients with BRAFV600E-mutated SKCM melanoma from TCGA (n = 233). GSEA analysis enrichment of the FA metabolism in VARS high versus VARS low TCGA melanomas. b, FA oxidation (FAO) activity measured in SENS and RES M395 patient-derived cultures (mean fold change ± s.e.m.; n = 3 independent biological replicates, two-tailed unpaired t-test). c, Cell death measurement by fluorescence staining with PI by FACS in M395 RES cells treated or not with etomoxir and vemurafenib at indicated concentrations (mean fold change ± s.e.m.; n = 3 independent biological replicates; two-way analysis of variance (P < 0.0001)). Tukey’s multiple comparisons test are indicated. df, Western blot of VARS and HADH protein expression in SENS and RES M395 cells (d), in A375, M395 and MM029 RES cells depleted of VARS (e), and in A375, M395 and MM029 SENS cells overexpressing (VARS) or not (control) VARS (f). g,h, FAO activity measured in M395 RES cells depleted or not for VARS (g) and in M395 SENS cells overexpressing (VARS) or not (control) (h) (fold mean ± s.e.m. of n = 3 independent replicates, two-tailed unpaired t-test). i, FAO activity measured in M395 and MM029 RES cells depleted of HADH (shHADH-1 and shHADH-2) compared with control cells (shCTRL) (mean fold change ± s.e.m.; n = 2 M395 RES and n = 3 MM029 RES, two-tailed unpaired t-test). j, Cell death measurement by fluorescence staining with PI by FACS in control (shCTRL) or HADH (shHADH) depleted M395 RES cells treated or not with vemurafenib (as indicated) (mean fold change ± s.e.m.; n = 3 independent biological replicates, two-way analysis of variance (P < 0.0001). Tukey’s multiple comparison tests are indicated. Source data
Extended Data Fig. 1
Extended Data Fig. 1. Overall translation rate is comparable in SENS and RES cultures.
a, Polysome profiling experiments of M395 SENS and RES cultures and b, Global rates of mRNA translation reported by total cell OP-puro fluorescence in M395, MM074 and A375 SENS and RES cultures (fold mean ± SEM of at least 3 independent replicates, two-tailed unpaired t-test was performed). c, Dot plot of significantly enriched terms in RES using the hallmark database (GSEA). The color of the bubbles represents the FDR q-value and the size of the bubbles represents the enrichment score (NES). d, Heatmap representing amino acids enrichment analysis of proteins downregulated in M395 RES compared to the global genome Significant differences are represented whereas red indicates an enrichment and blue an impoverishment (chi-squared test was performed). Colour bar, fold change. Source data
Extended Data Fig. 2
Extended Data Fig. 2. GTG codon is the most represented valine codon in the human transcriptome.
a, Heatmap representing the z-scores of significantly modified tRNA isodecoders (by tRNA sequencing) in M395 SENS and RES cultures (n = 3 independent replicates). tRNA expression profiling is annotated with gene symbol and anticodon. Red is used to highlight tRNA-Val-CAC isodecoder genes. b, Correlation between significant changes in codons from the CCA (chi-squared test) and the downregulated tRNA isoacceptors (Two-tailed unpaired t-test, no adjustment was used for these comparisons), Blue, impoverished codons and decrease in the corresponding isoacceptors tRNAs; red, enriched codons and the corresponding isoacceptors tRNAs; c, Histogram representing frequency distribution of valine codons in the human genome. d, Quantification of tRNA-Val-CAC in MM029 SENS and RES cultures (fold mean ± SEM of 3 independent replicates, two-tailed unpaired t-test was performed). Source data
Extended Data Fig. 3
Extended Data Fig. 3. VARS expression correlates negatively with the survival of patients with melanoma.
a, Volcano plot representing translation factors (initiation and elongation) from M395 SENS and RES proteomics data. Significant changes (two-tailed unpaired t-test) are represented in red (upregulated genes) or in blue (downregulated genes). b, Quantification of VARS protein expression in M395, MM099 and MM029 SENS and RES cultures (Fold mean ± SEM of 2 independent replicates). c, VARS mRNA expression across cancers. TPM stands for transcripts per million. SKCM stands for skin cutaneous melanoma. d, TCGA analysis of all aminoacyl-tRNA synthetases expression in normal (N) and tumor (T) skin cutaneous melanoma. Pvalues were obtained from GEPIA. Source data
Extended Data Fig. 4
Extended Data Fig. 4. VARS depletion resensitizes melanoma tumors to MAPK-therapy.
a, A375 RES control or VARS-depleted melanoma cells (shVARS-2) were xenografted in mice and treated or not with Vemurafenib (25 mg/kg). Tumor weight was assessed and plotted (n = 12 for each group). Mean ± SEM is represented. Two-way ANOVA was performed. Tukey’s multiple comparison tests are indicated in the figures. Source data
Extended Data Fig. 5
Extended Data Fig. 5. VARS depletion does not induce an integrated stress response response or demonstrate a global defect in translation.
a, Western blot corresponding to Fig. 5a, b. b, Western blot analyses of integrated stress response after VARS depletion. c Polysome profiles and translation efficiency of M395 RES control or depleted of VARS (fold mean ± SEM of n = 3 independent replicates, two-tailed unpaired t-test was performed). Source data
Extended Data Fig. 6
Extended Data Fig. 6. Proteomics analysis of VARS depleted cells reveals an enrichment in valine amino acid.
a, Volcano plots showing p-values (−log10) versus log2 fold change of proteomics analysis of melanoma M395 RES depleted for VARS as compared to the control (two-tailed unpaired t-test of n = 3 independent replicates), Blue: up-regulated; red: down-regulated proteins. b, Heatmap representing amino acids analysis of proteins upregulated in M395 RES depleted for VARS as compared to control. Chi-squared test was performed. Colour bar, fold change. c, Volcano plot listing detected aminoacyl-tRNA synthetases in proteomics analysis of M395 RES cells upon VARS depletion as compared to control (two-tailed unpaired t-test of n = 3 independent replicates). d, Volcano plots showing p-values (−log10) versus log2 fold change of transcriptomic analysis of melanoma M395 RES depleted for VARS as compared to the control; Black: up-regulated; Orange: down-regulated proteins (two-tailed unpaired t-test of n = 3 independent replicates). e, f, Volcano plots of ribosome (e) and polysome (f) sequencing highlighting the five identified candidates (HADH, KIF13B, SLC7A5, QDPR and GOLT1B) (two-tailed unpaired t-test of n = 3 independent replicates). Source data
Extended Data Fig. 7
Extended Data Fig. 7. VARS correlates with HADH expression and VARS transcriptionally regulates HADH.
a, Dot plot of significantly enriched terms in VARS high versus VARS low TCGA melanomas using the hallmark database (GSEA). The color of the bubbles represents the FDR q-values and the size of the bubbles represents the enrichment scores (NES). b, Western blot analysis of M395 RES upon etomoxir treatment as indicated. CPT1a is used as a control (n = 3). c, HADH immunostaining score was represented for VARS high (n = 22) and VARS low patient (n = 21) groups in normal skin, primary and metastatic melanoma patient biopsies. Two-sided Mann-Whitney test was performed. Whiskers are represented as min to max values with a median line. d, Western blot of VARS and HADH protein expression in A375, M395, MM029 RES cells depleted or not of VARS (shVARS-2). e, qRT-PCR after ribosomal immunoprecipitation using RPL22-Flag expression cells depleted (shVARS) or not (shCTRL) of VARS. Fold mean ± SEM of n = 3 independent replicates, two-tailed unpaired t-test was performed. f, Western blot corresponding to Fig. 7i. g, Western blot corresponding to Fig. 7j (n = 3). h,i, Western blot showing MAPK pathway upon VARS depletion (h) or VARS overexpression (i) in MM029, A375 and M395 RES or SENS melanoma cells (n = 1). Source data
Extended Data Fig. 8
Model: VARS promotes melanoma resistance through translation of valine enriched genes, among them the fatty acid regulator HADH.

Similar articles

Cited by

References

    1. Davis LE, Shalin SC, Tackett AJ. Current state of melanoma diagnosis and treatment. Cancer Biol. Ther. 2019;20:1366. doi: 10.1080/15384047.2019.1640032. - DOI - PMC - PubMed
    1. Davies H, et al. Mutations of the BRAF gene in human cancer. Nature. 2002;417:949–954. doi: 10.1038/nature00766. - DOI - PubMed
    1. Tanda ET, et al. Current state of target treatment in BRAF mutated melanoma. Front. Mol. Biosci. 2020;7:154. doi: 10.3389/fmolb.2020.00154. - DOI - PMC - PubMed
    1. Eroglu Z, Ribas A. Combination therapy with BRAF and MEK inhibitors for melanoma: latest evidence and place in therapy. Ther. Adv. Med. Oncol. 2016;8:48. doi: 10.1177/1758834015616934. - DOI - PMC - PubMed
    1. Salgia R, Kulkarni P. The genetic/non-genetic duality of drug ‘resistance’ in cancer. Trends Cancer. 2018;4:110. doi: 10.1016/j.trecan.2018.01.001. - DOI - PMC - PubMed