. 2024 Jun;26(6):868-877.
doi: 10.1038/s41556-024-01431-w. Epub 2024 Jun 7.

Extraembryonic gut endoderm cells undergo programmed cell death during development

Affiliations

Extraembryonic gut endoderm cells undergo programmed cell death during development

Julia Batki et al. Nat Cell Biol. 2024 Jun.

Abstract

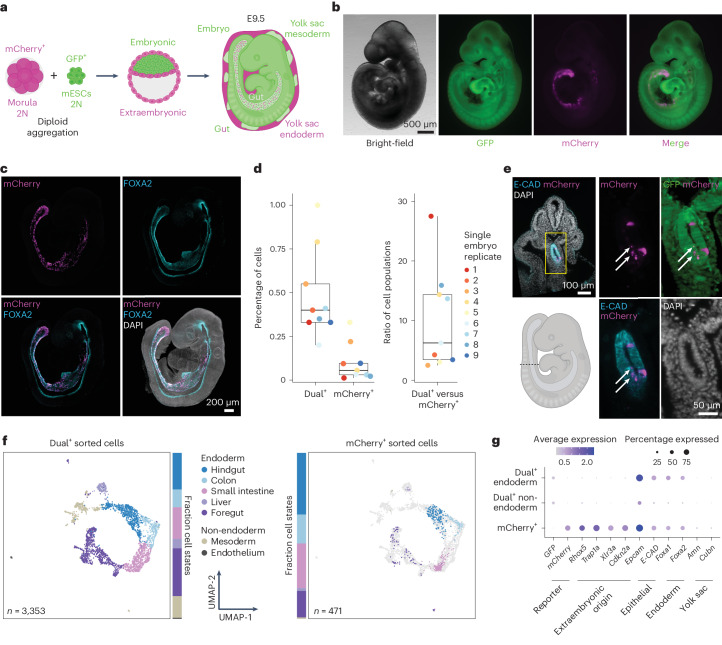
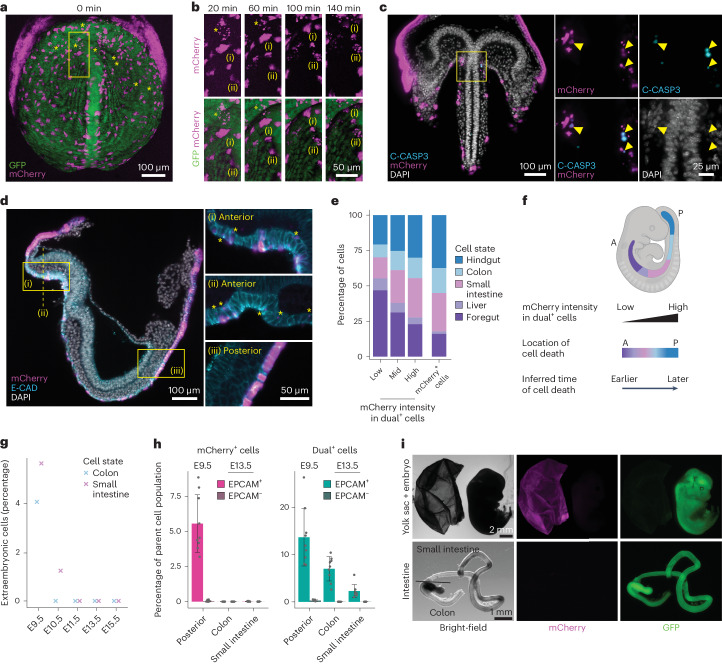
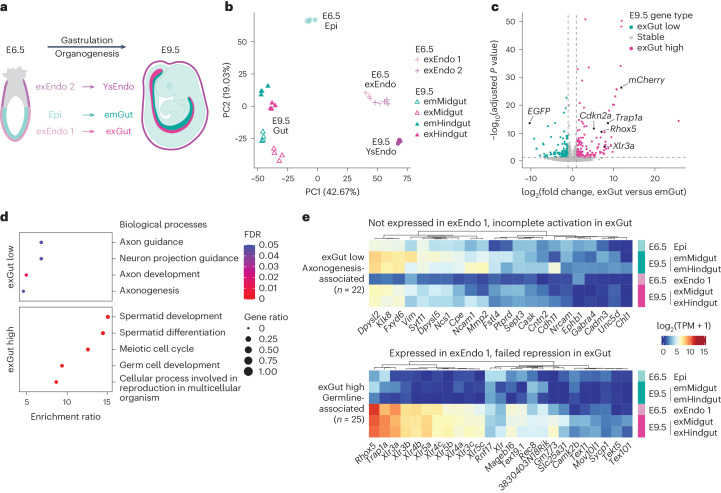
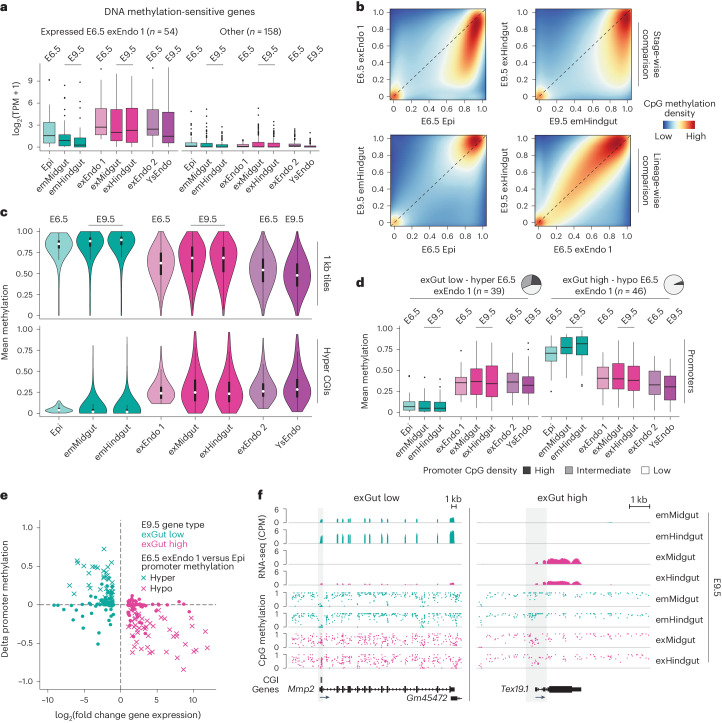
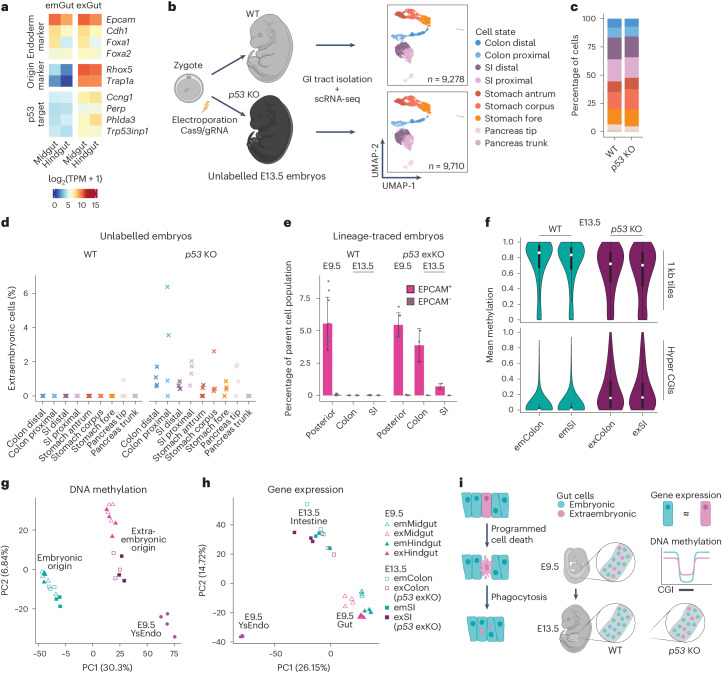
Despite a distinct developmental origin, extraembryonic cells in mice contribute to gut endoderm and converge to transcriptionally resemble their embryonic counterparts. Notably, all extraembryonic progenitors share a non-canonical epigenome, raising several pertinent questions, including whether this landscape is reset to match the embryonic regulation and if extraembryonic cells persist into later development. Here we developed a two-colour lineage-tracing strategy to track and isolate extraembryonic cells over time. We find that extraembryonic gut cells display substantial memory of their developmental origin including retention of the original DNA methylation landscape and resulting transcriptional signatures. Furthermore, we show that extraembryonic gut cells undergo programmed cell death and neighbouring embryonic cells clear their remnants via non-professional phagocytosis. By midgestation, we no longer detect extraembryonic cells in the wild-type gut, whereas they persist and differentiate further in p53-mutant embryos. Our study provides key insights into the molecular and developmental fate of extraembryonic cells inside the embryo.


Conflict of interest statement

A.M. is an inventor on a patent (US20200109456A1) related to hypermethylated CGI targets in cancer. A.M. is a co-founder and scientific advisor of Harbinger Health. The remaining authors declare no competing interests.

Figures

Fig. 1
Fig. 1. Two-colour lineage tracing identifies dual-labelled embryonic cells.
a, Schematic of the two-colour lineage labelling strategy for lineage tracing (2N indicates that cells are diploid). Embryonic versus extraembryonic lineage segregation can be seen at the blastocyst stage (Extended Data Fig. 1c). At E9.5, embryos are GFP+ and only the gut contains a small fraction of mCherry+ extraembryonic cells (see b). b, Bright-field (left) and fluorescence (right) microscopy images of an E9.5 embryo generated via the two-colour lineage tracing (n = 54; one representative embryo is shown). c, Maximum-intensity projection of optical sections acquired by confocal laser scanning microscopy showing an E9.5 embryo and confirming the presence of mCherry+ extraembryonic cells specifically in the gut, which is positive for FOXA2 (additionally expressed in the notochord and floor plate). Nuclei were stained with 4,6-diamidino-2-phenylindole (DAPI) and immunofluorescence was used for mCherry and FOXA2 (n = 3; one representative embryo is shown). d, Percentage of dual+ and mCherry+ cells (left) as well as the ratio of these two populations (right) in E9.5 embryos analysed by flow cytometry. Individual embryos are indicated by colour-coded dots (n = 9). Boxplots: the lines denote the median, the edges denote the interquartile range (IQR), whiskers denote 1.5× the IQR and minima/maxima are defined by dots. e, Transversal optical section of an E9.5 embryo acquired by light-sheet imaging (the dashed line in the schematic depicts the axial position, bottom left). E-CAD marks the surface ectoderm and gut endoderm. Magnified views of the gut (yellow box) are shown; mCherry foci are highlighted (white arrows). Nuclei were stained with DAPI and immunofluorescence was used for mCherry and E-CAD (n = 3; a section from one representative embryo is shown). f, Uniform manifold approximation and projection (UMAP) coloured by the assigned cell states showing dual+ (left) and mCherry+ (right) cells subjected to scRNA-seq (the dual+ population is indicated in grey on the right). The fractions of cells belonging to the individual cell states are indicated with the bars. g, Average log-normalized scRNA-seq expression of reporter transgenes and known marker genes of the indicated cell types. Expression is shown separately for embryonic dual+ endoderm and non-endoderm as well as mCherry+ extraembryonic cells.
Fig. 2
Fig. 2. Elimination of exGut cells by midgestation.
a, Maximum-intensity projection of optical sections (confocal laser scanning microscopy) showing an E7.5 embryo at the start of the ex utero culture and live imaging. In addition to intact mCherry+ extraembryonic cells in the embryo, mCherry+ foci were detected (yellow asterisks; n = 4, one representative embryo is shown). b, Magnified view of the region in the yellow box in a at different time points of the live imaging. (i),(ii), Two mCherry+ cells, which become fragmented, have been highlighted. c, Ventral view (light-sheet microscopy) of an E7.5 embryo. The magnified views (right) of the region in the yellow box in the main image (left) show mCherry+ cells that are positive for cleaved CASPASE3 (C-CASP3; yellow arrowheads). Nuclei were stained with DAPI and immunofluorescence was used for C-CASP3 and mCherry (n = 3, one representative embryo is shown). d, Lateral view of an E7.5 embryo (left). Magnified views of the yellow boxes ((i) and (iii)) and the yellow dashed line ((ii), transversal section) are provided (right). Yellow asterisks highlight mCherry+ foci. Nuclei were stained with DAPI and immunofluorescence was used for mCherry and E-CAD (n = 3, one representative embryo is shown). e, Percentage of cells assigned to endodermal cell states in the different sort populations (low, intermediate and high dual+, and mCherry+) from E9.5 lineage-traced embryos using scRNA-seq. f, Schematic of the gut endoderm organ distribution along the anterior–posterior axis (top) and a summary of the proposed spatiotemporal regulation of exGut cell elimination (bottom). g, Percentage of cells with extraembryonic origin (defined as Rhox5+Trap1a+ cells) in the colon and small intestine from E9.5 to E15.5 (scRNA-seq data from Zhao et al.). h, Proportion of mCherry+ and dual+ cell content of the indicated parent cell populations (EPCAM+ and EPCAM) in the posterior part of E9.5 embryos and E13.5 organs (n = 9). The bars denote the mean, the error bars denote the s.d. and individual replicates are shown as dots. i, Bright-field and fluorescence microscopy images of a lineage-traced E13.5 embryo and its corresponding yolk sac. The intestine was manually separated into the colon and small intestine, indicated by the black line (n = 4, one representative embryo is shown). A, anterior; P, posterior.
Fig. 3
Fig. 3. Transcriptional signatures of gut cells reflect their lineage origins.
a, Schematic of the origin and composition of gut endoderm: emGut cells (E9.5) originating from the embryonic epiblast (Epi, E6.5) and exGut cells (E9.5) originating from the distal part of the extraembryonic endoderm at E6.5 (exEndo 1) both contribute to the formation of gut endoderm. The proximal part of the extraembryonic endoderm (exEndo 2) gives rise to the E9.5 YsEndo. E6.5 Epi and E9.5 emGut cells are positive for GFP, whereas E6.5 exEndo 1 and 2, E9.5 exGut and YsEndo cells are positive for mCherry in lineage-traced embryos. E9.5 emGut cells can also be positive for mCherry in the case of dual+ cells that have taken up remnants of dying mCherry+ cells (not illustrated). b, Principal component analysis (PCA) of E6.5 and E9.5 RNA-seq samples based on the 5,000 most variably expressed genes. Samples are largely separated by tissue, with exGut cells grouping close but distinguishable from their embryonic counterparts. c, Genes that are differentially expressed (two-sided Wald test; P values were adjusted for multiple testing using false discovery rate (FDR)) between E9.5 exGut and emGut (including both midgut and hindgut). Genes that are expressed at significantly higher levels in exGut cells compared with emGut cells (termed exGut high) include known extraembryonic marker genes as well as the mCherry transgene, whereas GFP is expressed at significantly higher levels in emGut cells (termed exGut low). Vertical and horizontal lines denote log2 fold change and adjusted P-value boundaries used for differential expression calling. d, Overrepresentation analysis of exGut low and high genes in biological processes. The exGut low genes are enriched in axonogenesis-related processes, whereas exGut high genes are enriched in germline- and meiosis-associated processes. e, Expression (log2-transformed) of a selection of exGut low (top) and high (bottom) genes associated with the terms shown in d in E6.5 progenitor and E9.5 gut cells. The selected exGut low genes are not expressed in the E6.5 exEndo 1 and are insufficiently activated in the E9.5 exGut cells. In contrast, exGut high genes are generally not expressed, or are expressed at low levels, in the E6.5 Epi and E9.5 emGut samples, whereas both the extraembryonic progenitor and exGut cells express them. TPM, transcripts per million.
Fig. 4
Fig. 4. Preserved epigenetic memory of lineage origins.
a, Expression levels (log2-transformed) of DNA methylation-sensitive genes (defined by ref. ,; n = 4 biological replicates) separated based on whether or not a gene is expressed in E6.5 exEndo 1. b, CpG-wise comparison of DNA methylation between E6.5 progenitors, E9.5 emGut and exGut cells of the hindgut (emHindgut and exHindgut, respectively; WGBS). Global DNA methylation correlated better with lineage (bottom) than with developmental stage (top). c, Average genome-wide methylation (top; one kilobase (kb) tiles, n = 1,791,329) and the methylation of CGIs hypermethylated in the E6.5 exEndo 1 compared with the epiblast (bottom; hyper CGIs, n = 1,121), WGBS. Boxplots: the white dots denote the median, the edges denote the IQR and whiskers denote 1.5× the IQR (minima/maxima are indicated by the violin plot range). d, Levels of promoter methylation of exGut low genes that are hypermethylated (left) and exGut high genes that are hypomethylated (right) in E6.5 exEndo 1 compared with the epiblast. The pie charts (top) indicate the promoter CpG density of the respective gene sets. c,d, n = 1 or 2 biological replicates. a,d, Boxplots: the lines denote the median, the edges denote the IQR, the whiskers denote 1.5× the IQR and outliers are represented by dots. e, Comparison of the log2-transformed fold change of E9.5 differentially expressed genes (exGut low and high) with the respective delta promoter methylation between exGut and emGut. A lower DNA methylation level corresponds to higher gene expression, which is most pronounced for the promoters for which a difference in DNA methylation can already be observed in the E6.5 gut progenitors. f, Genome browser tracks of the Mmp2 (exGut low) and Tex19.1 (exGut high) locus showing RNA-seq coverage and WGBS. Mmp2 is expressed in emGut samples where it is associated with an unmethylated promoter. The intermediate methylation of the promoter CGI in exGut samples only allows low expression levels in the exHindgut. Tex19.1 is fully methylated in emGut samples, which corresponds to a complete silencing of the gene. In contrast, lower DNA methylation levels of the low CpG density promoter in exGut samples allow expression.
Fig. 5
Fig. 5. p53 disruption allows the survival of exGut cells with origin-specific signatures.
a, Expression levels (log2-transformed) of endoderm and extraembryonic origin marker genes as well as four exGut high genes that are known p53 target genes in E9.5 gut samples. b, Schematic of the generation of wild-type (WT) and p53-KO embryos using Cas9-mediated genetic perturbation (left). UMAP of WT (top) and p53-KO (bottom) epithelial cells sorted from the gastrointestinal (GI) tract of E13.5 embryos (right; n = 4 independent biological replicates per condition). Colours indicate the assigned cell state. c, Percentage of cells that belong to the individual cell states in WT and p53-KO GI tracts. d, Percentage of extraembryonic cells (Rhox5+Trap1a+ cells) in the WT and p53-KO organs of unlabelled embryos of the experiment shown in b and c (all four individual embryo replicates are shown). In the WT, only one cell with Rhox5 and Trap1a expression was found at E13.5, whereas a substantial fraction with extraembryonic origin survived in the p53 KO. e, Comparison of the proportion of mCherry+ cell content in WT lineage-traced embryos (left; data from Fig. 2h) and lineage-traced embryos with extraembryonic-specific p53 KO (exKO; right) showing in the posterior part of E9.5 embryos (n = 5) and the colon and small intestine from E13.5 embryos (n = 3). The bars denote the mean, the error bars denote the s.d. and individual replicates are shown as dots. f, Average genome-wide methylation (top; 1 kb tiles, n = 583,771) and the methylation of CGIs hypermethylated in the E6.5 exEndo 1 compared with the epiblast (bottom; hyper CGIs, n = 1,292) in E13.5 tissues (reduced representation bisulfite sequencing, RRBS). The violin plot characteristics are the same as in Fig. 4c (n = 3 biological replicates). g, DNA methylation PCA of E9.5 and E13.5 RRBS samples based on the 5,000 most variably methylated 1 kb tiles where samples largely separate according to lineage origin. h, Gene expression PCA of E9.5 and E13.5 RNA-seq samples based on the 5,000 most variably expressed genes, where samples largely separate according to tissue type. i, Simplified schematic showing the developmental fate and molecular characteristics of extraembryonic cells in the gut. SI, small intestine.
Extended Data Fig. 1
Extended Data Fig. 1. Two-colour lineage tracing by stage-specific diploid complementation.
a) Schematic illustrating the two-colour lineage tracing strategy used throughout the study to selectively and stably label embryonic and extraembryonic lineages. An mCherry+ pre-compaction morula is aggregated with a GFP+ ESC colony (2N indicates that both are diploid). Representative experiments at E9.5 are summarized in the table, where in the majority of the cases (more than 95%, 54/56), embryos were GFP+, and only the gut region contained diploid mCherry+ cells, while in rare cases, embryos were fully mCherry+ without detectable GFP+ cells (less than 5%, 2/56). b) Bright-field and fluorescence microscopy images of a yolk sac (corresponding to the embryo shown in Fig. 1a) generated via the two-colour lineage tracing (n = 54, one representative yolk sac is shown). c) Confocal laser scanning microscopy images showing an expanded blastocyst, where the GFP signal is present in the region indicating the early epiblast, while the mCherry signal is present in the region indicating the extraembryonic lineages. Nuclei were stained with DAPI (n = 10, one representative embryo is shown). d) Bright-field and fluorescence microscopy images of an E9.5 embryo, which contains only diploid mCherry+ cells (n = 2, one representative embryo is shown) as a likely outcome of failed aggregation and mESC incorporation. Such fully mCherry+ embryos were excluded from further experiments. e) Bright-field and fluorescence microscopy images of a yolk sac (corresponding to the embryo shown in Extended Data Fig. 1d), which contains only diploid mCherry+ cells as a likely outcome of failed aggregation and mESC incorporation (n = 2, one representative yolk sac is shown). f) Maximum-intensity projection of optical sections acquired by confocal laser scanning microscopy showing a lineage-traced E9.5 embryo and confirming the presence of mCherry+ extraembryonic cells specifically in the gut tube. E-CADHERIN, a surface marker of epithelial cells, is present not only in the gut endoderm but also in the surface ectoderm, where no mCherry+ cells are located. Nuclei were stained with DAPI, and immunofluorescence was used for mCherry and E-CAD (n = 3, one representative embryo is shown).
Extended Data Fig. 2
Extended Data Fig. 2. Benchmarking different complementation strategies.
a) Schematic illustrating the conventional tetraploid complementation by morula aggregation, with selective and stable lineage labelling (similar to the two-colour lineage tracing strategy used throughout the study) with the caveat that extraembryonic cells are tetraploid. 2-cell-stage mCherry+ embryos are electrofused. Then, two tetraploid mCherry+ pre-compaction morulas are aggregated with a GFP+ mESC colony (2N indicates diploid, 4N indicates tetraploid). At E9.5, the embryo overall consists of diploid GFP+ cells, where only the gut contains tetraploid mCherry+ extraembryonic cells. At E9.5, embryos without visible malformations were collected and counted: 1) mCherry signal specific to the region resembling the gut tube or 2) fully mCherry+ embryos or 3) chimaeras where both mCherry+ and GFP+ cells are broadly distributed (data provided in the table). b) Bright-field and fluorescence microscopy images of an E9.5 embryo generated via tetraploid complementation with morula aggregation, which is overall diploid and GFP+, while tetraploid mCherry+ extraembryonic cells are present only in a distinct area resembling the gut tube (n = 22, one representative embryo is shown). c) Bright-field and fluorescence microscopy images of a yolk sac corresponding to the embryo shown in b (n = 22, one representative yolk sac is shown). d) Schematic illustrating the diploid complementation by blastocyst injection, which leads to fully chimeric embryos because embryonic and extraembryonic lineages are not distinctly labelled (in contrast to the two-colour lineage tracing strategy used throughout the study). GFP+ mESCs are injected into blastocyst-stage mCherry+ embryo (2N indicates diploid). As the blastocyst already has a defined ICM, mCherry+ cells contribute to the embryo proper as well, resulting in chimeras. At E9.5, embryos without visible malformations were collected and counted as described in a (data provided in the table). e) Bright-field and fluorescence microscopy images of an E9.5 embryo generated via diploid complementation by blastocyst injection (n = 26/32, one representative chimeric embryo is shown). f) Bright-field and fluorescence microscopy images of a yolk sac corresponding to the embryo shown in e (n = 26/32, one representative yolk sac is shown).
Extended Data Fig. 3
Extended Data Fig. 3. Cell type identity of dual+ and mCherry+ cells.
a) Flow cytometry dot plot depicting mCherry and GFP intensities in a single E9.5 wild type embryo used as a negative control in comparison to the E9.5 lineage-traced embryo (Extended Data Fig. 3b). Three populations and their abundance are indicated. b) Flow cytometry dot plot depicting mCherry and GFP intensities in a single E9.5 lineage-traced embryo (n = 9). Three populations and their abundance are indicated: single GFP+, single mCherry+ and dual+ with both GFP and mCherry signals. c) Transversal optical sections as in Fig. 1e for additional axial positions, depicted by the dashed lines in the schematics (n = 3, sections from one representative embryo are shown). d) Flow cytometry dot plot depicting mCherry and GFP intensities in pooled E9.5 lineage-traced embryos (n = 15). Four sorted populations and their abundance are indicated: single mCherry+ cells and dual+ cells with high GFP level plus low, medium, or high mCherry levels. Absolute cell numbers of sorted cells are summarized in the table; each population was labelled with distinct MULTI-Seq surface barcodes. e) Heatmap representation of the standardized, log-normalized expression levels of marker genes of cell states in dual+ and mCherry+ cells. f) Average log-normalized expression of lineage marker genes across cells of each cell state (dual+ and mCherry+ combined). g) Boxplot of prediction scores for mCherry+ cells as they are assigned to their respective cell state based on the local neighbourhood of dual+ cells. Overall, mCherry+ cells are assigned with a high probability to their respective cell state compared to others, and scores are more confident for endodermal cell state assignments. The dashed line denotes the prediction score that reflects equal association with any of the seven cell states (random assignment). Lines denote the median, edges denote the IQR, whiskers denote 1.5 × IQR, and outliers are represented by dots (n = 15 biological replicates).
Extended Data Fig. 4
Extended Data Fig. 4. Fragmenting mCherry+ cells are phagocytosed and cleared from intestinal organs.
a) Frontal (top) and sagittal (bottom) optical sections of an E7.5 embryo acquired by light sheet microscopy, with immunofluorescence for E-CADHERIN and mCherry (n = 3, one representative embryo is shown). The yellow boxes highlight the zoomed-in images, and the yellow lines indicate the position of the sagittal transection in the frontal plane and the frontal transection in the sagittal plane. The yellow arrows point to the same two mCherry+ foci, which are inside GFP+ cells. b) Maximum-intensity projection of optical sections as described for Fig. 2a, additionally using the Lysotracker dye (n = 4, one representative embryo is shown). The yellow box highlights the zoomed-in window for c. c) Zoomed-in view showing time points during live imaging. One mCherry+ cell is highlighted with a yellow arrow at the start of the experiment, which becomes fragmented and the remnants are highlighted with yellow arrowheads. d) UMAP of dual+ (top) and mCherry+ (bottom) cells coloured by their original sort group. e) Percentage of cells with extraembryonic origin (defined as Rhox5+/Trap1a+ cells) within the gastrointestinal tract from E9.5 to E15.5 split by Epcam expression status (data from Ref. ). f) Flow cytometry dot plot of the limb from an E13.5 lineage-traced embryo (n = 4). g) Flow cytometry dot plots of the colon and small intestine from E13.5 lineage-traced embryos showing the endoderm (EPCAM+) and non-endoderm (EPCAM−) fractions. Left: mCherry+ cells are not detected (n = 4). Right: mCherry+ cells are not detected in the colon, while a trace amount is detected in the small intestine (n = 5). h) EPCAM+ content of the posterior part of E9.5 embryos, and E13.5 colon and small intestine (n = 9) corresponding to Fig. 2h. Bars denote the mean, error bars denote the standard deviation, and single replicates are indicated by dots. i) EPCAM+, mCherry+ and dual+ content of the posterior part of E9.5 embryos (n = 9) and E12.5 colon and small intestine (n = 3). Plot characteristics are the same as in h.
Extended Data Fig. 5
Extended Data Fig. 5. Full developmental potential of mCherry+ cells.
a) Schematic illustrating the generation of a chimaeric embryo at E13.5 by diploid complementation with blastocyst injection (as described in Extended Data Fig. 2d,e). This served as a control to show that mCherry+ cells, when also contributing via the embryonic lineage, have full developmental potential. b) Bright-field and fluorescence microscopy images of an E13.5 chimaeric embryo and its corresponding yolk sac, generated by diploid complementation with blastocyst injection. The intestine was manually separated into the colon and small intestine, indicated by the black line (n = 6, one representative embryo is shown). c) Representative flow cytometry dot plots of the corresponding colon and small intestine from an E13.5 chimeric embryo showing the endoderm (EPCAM+) and the non-endoderm (EPCAM−) fractions (n = 6). mCherry+ cells are present in significant proportion confirming that mCherry+ cells are eliminated from the embryo only if they originate from the extraembryonic lineage, such as in our two-colour lineage tracing. d) Boxplot showing the abundance of epithelial endoderm cells (EPCAM+), the abundance of mCherry+ cells in the endoderm (EPCAM+) and non-endoderm (EPCAM−) populations in the organs isolated from E13.5 chimeras. The single embryo replicates are indicated by colour-coded dots. Lines denote the median, edges denote the IQR, whiskers denote 1.5× IQR, and minima/maxima are defined by dots. e) Schematic illustrating the generation of a fully mCherry+ embryo at E13.5 via natural mating. This served as a control to exclude that silencing of the mCherry transgene is the reason why mCherry+ extraembryonic cells are not detected in E13.5 embryos generated by the two-colour lineage tracing (Fig. 2). f) Bright-field and fluorescence microscopy images of an mCherry-only E13.5 embryo and its corresponding yolk sac generated via natural mating (n = 1). The intestine was manually separated into the colon and small intestine, indicated by the black line. g) Flow cytometry dot plots of the colon and small intestine from an E13.5 mCherry-only embryo showing the endoderm (EPCAM+) and the non-endoderm (EPCAM−) fractions (n = 1). All the cells are mCherry+, and no silencing of the mCherry transgene occurs.
Extended Data Fig. 6
Extended Data Fig. 6. Gene expression differences between embryonic and extraembryonic gut cells.
a) Bright-field and fluorescence microscopy images of an E9.5 embryo generated via the two-colour lineage tracing. The embryo was manually split into anterior and posterior halves (upper row). The posterior half, containing a large fraction of mCherry+ cells, was used for manually isolating the midgut and the tailbud contains the hindgut (lower row). These were used for sorting, then RNA-seq and WGBS (n = 16, one representative embryo is shown, corresponding tissues from four embryos were pooled). b) Flow cytometry dot plot of the epithelial fraction (EPCAM+) from the pooled hindgut tissues (n = 4). mCherry and GFP intensities were used to sort mCherry+ extraembryonic gut cells and dual+ cells with low mCherry intensity as embryonic hindgut. Our single-cell RNA-seq experiment (Fig. 1) confirmed that epithelial dual+ cells are gut endoderm of embryonic origin and, therefore, ideal to utilize as a stage-matched embryonic comparison. c) Log2-transformed expression of origin and lineage marker genes for E6.5 epiblast and extraembryonic endoderm as well as E9.5 gut and yolk sac endoderm in single replicates. d) Scatterplot comparing the log2 fold change between exGut and emGut samples with the average log2-transformed expression in emMidgut, emHindgut, exMidgut and exHindgut. e) Overrepresentation analysis of exGut low and high genes in cellular components. f) Log2-transformed enrichment of the chromosomal location of exGut low and high genes compared to the genomic background distribution of all genes (=0 equals no difference, > 0 implies enrichment, < 0 implies depletion). exGut high genes are enriched on the X chromosome. g) Overlap of exGut high genes with genes known to escape X chromosome inactivation. The small overlap suggests that the expression of exGut high genes is not caused by sex differences between emGut and exGut or the effect of double dosage from X chromosome inactivation escapees. h) Average log-normalized expression of endoderm marker genes, axonogenesis-associated exGut low genes and germline-associated exGut high genes across embryonic (emGut) and extraembryonic (exGut) gut cells from E8.75 (ref. ) and E9.5 (ref. ) embryos using published datasets.
Extended Data Fig. 7
Extended Data Fig. 7. Extraembryonic gut cells maintain the extraembryonic DNA methylation landscape.
a) Top: Fraction of differentially upregulated genes in E8.5 Dnmt3b or Dnmt3a/Dnmt3b knockout compared to wild type embryos termed DNA methylation-sensitive (or other) as previously defined by Auclair et al. and Dahlet et al.. Bottom: Overlap of DNA methylation-sensitive upregulated genes in E8.5 Dnmt3b- or Dnmt3a/Dnmt3b-knockout embryos. b) Density plot showing the CpG-wise comparison between E6.5 progenitors, E9.5 emMidgut, exMidgut and YsEndo (WGBS). c) Boxplot showing the promoter methylation of exGut low genes that are not hypermethylated in E6.5 exEndo 1 compared to epiblast (left) and exGut high genes that are not hypomethylated in E6.5 exEndo 1 compared to epiblast (right). Low promoter methylation can be observed across all stages and tissues. Pie charts indicate the promoter CpG density of the respective gene sets. Boxplot characteristics and sample sizes as in Fig. 4d. d) Log2-transformed expression of all exGut low and high genes with sufficient promoter coverage by WGBS (see Methods) split by methylation status in the E6.5 exEndo 1 compared to Epi. All profiled E6.5 and E9.5 tissues are shown. e) Genome browser track of the Mmp2 (exGut low) and Tex19.1 (exGut high) loci showing RNA-seq coverage and WGBS for the E6.5 progenitor cells and the E9.5 YsEndo. Mmp2 is lowly expressed in the epiblast (unmethylated promoter) and not expressed in the extraembryonic tissues (hypermethylated promoter). Tex19.1 is expressed across all tissues but higher in the exEndo and YsEndo, which correlates with stronger promoter hypomethylation. f) Heatmap showing the expression levels of epigenetic regulators in E6.5 progenitors and E9.5 gut cells. The different DNA methylation landscapes observed between cells of embryonic and extraembryonic origin are not clearly linked to differences in expression levels of epigenetic regulators. Instead, samples are more similar to each other by developmental time point.
Extended Data Fig. 8
Extended Data Fig. 8. Single-cell profiling of p53 mutant gastrointestinal tract.
a) Average log-transformed expression of the genes shown in Fig. 5a using published single-cell data,. Cells were subdivided into emGut and exGut based on Rhox5 and Trap1a expression (see Methods). b) Bright-field microscopy images of a WT and a p53 KO E13.5 embryo, and the isolated gastrointestinal (GI) tracts (n = 4, one representative embryo is shown for each condition). No developmental phenotype is observed for the p53 KO embryo and GI tract compared to the WT. c) Average log-transformed expression of gastrointestinal epithelial marker genes in single cells corresponding to cell states annotated for WT and p53 KO embryos. d) Heatmap representation of the standardized, log-normalized expression levels of marker genes of cell states in E13.5 WT and p53 KO cells. e) Percentage of single cells assigned to the different cell states for each E13.5 WT and p53 KO single embryo replicate. f) Quantification of different read types spanning the Cas9 target sequences (g1 to g3) in WT and p53 KO cells. For the p53 KO cells, virtually no complete, error-free reads can be found implying the successful knockout of the target gene. g) Boxplot of prediction scores for p53 KO cells as they are assigned to their respective cell state based on the local neighbourhood of WT cells. The dashed line denotes the prediction score that reflects equal association with any of the nine cell states (random assignment). Lines denote the median, edges denote the IQR, whiskers denote 1.5 × IQR, and outliers are represented by dots (n = 4 biological replicates). h) Average log-transformed expression of the genes shown in Fig. 5a in the E13.5 WT and p53 KO cells. Cells were subdivided into emGut and exGut based on Rhox5 and Trap1a expression (see Methods).
Extended Data Fig. 9
Extended Data Fig. 9. Two-colour lineage tracing with extraembryonic p53 knockout.
a) Schematic illustrating the two-colour lineage tracing strategy combined with extraembryonic lineage-specific p53 knockout (KO). The mCherry+ zygote is electroporated with Cas9/gRNA complex, and once reaching the pre-compaction morula stage, the p53 KO embryo is aggregated with a GFP+ mESC colony. As a result, the extraembryonic lineages are p53 KO, including the mCherry+ gut cells of extraembryonic origin, while the GFP+ embryonic lineage is wild type. b) Bright-field and fluorescence microscopy images of an E9.5 embryo and its corresponding yolk sac, generated via the two-colour lineage tracing combined with extraembryonic lineage-specific p53 KO (n = 5, one representative embryo is shown). c) Bright-field and fluorescence microscopy images of an E13.5 embryo and its corresponding yolk sac, generated via the two-colour lineage tracing combined with extraembryonic lineage-specific p53 KO. The dissected intestine was manually separated into the colon and small intestine, indicated by the black line. The overall GFP+ intestine contains mCherry+ cells, indicated by the white arrows (n = 3, one representative embryo is shown). d) EPCAM+ content of WT lineage-traced embryos, showing the posterior part of E9.5 embryos, and the colon and small intestine from E13.5 embryos (*WT data from Extended Data Fig. 4h used here as comparison, n = 9). Additionally, EPCAM+ content of lineage-traced embryos with extraembryonic-specific p53 KO is presented showing the posterior part of E9.5 embryos (n = 5) and the colon and small intestine from E13.5 embryos (n = 3). Bars denote the mean, error bars denote the standard deviation, and single replicates are indicated by dots. e) Flow cytometry dot plots of the corresponding colon (left) and small intestine (right) from an E13.5 lineage-traced embryo with extraembryonic lineage-specific p53 KO showing the endoderm fraction (EPCAM+, top) and non-endoderm fraction (EPCAM−, bottom) of the isolated organs (n = 3). mCherry+ cells with extraembryonic origin are detected. f) Flow cytometry dot plot of the limb from an E13.5 lineage-traced embryo (n = 3).
Extended Data Fig. 10
Extended Data Fig. 10. Persisting p53-mutant extraembryonic cells in vitro and in vivo.
a) Single channel bright-field and fluorescence microscopy images, showing time points of representative in vitro cultured gut cell assemblies over 5 days, sorted from the posterior part of wild type lineage-traced embryos (top) or the posterior part of embryos with extraembryonic p53 KO (bottom) at E9.5 (n = 3, one representative gut cell assembly is shown for each condition). Embryonic gut cells show substantial growth and WT extraembryonic gut cells do not show signs of proliferative capacity, while p53 KO extraembryonic gut cells show substantial and comparable growth to the embryonic gut cells. b) Merged bright-field and fluorescence microscopy images from the in vitro culture experiment at day 1 and day 5 from a. c) Growth quantification of in vitro cultured gut cell assemblies (represented in a,b) as determined by the relative area calculated by normalizing the assembly area to the average area on day 1 (n = 3). Central line denotes the mean, whiskers denote standard deviation. d) Boxplots showing the exGut low and high gene groups separated by promoter methylation in the E6.5 exEndo 1 compared to the epiblast, for E9.5 and E13.5 tissues (RRBS). The distinct promoter methylation patterns of cells with embryonic and extraembryonic origin are still present at E13.5. Lines denote the median, edges denote the IQR, whiskers denote 1.5× IQR, and outliers are represented by dots (n = 3–4 biological replicates). e) Z-score-transformed expression across E9.5 gut and E13.5 intestine samples of all E9.5 exGut low and high genes split using k-means clustering. Germline- and axonogenesis-associated genes shown in Fig. 3e are indicated next to their assigned cluster.

References

    1. Tam PPL, Behringer RR. Mouse gastrulation: the formation of a mammalian body plan. Mech. Dev. 1997;68:3–25. - PubMed
    1. Nowotschin S, Hadjantonakis A-K. Guts and gastrulation: emergence and convergence of endoderm in the mouse embryo. Curr. Top. Dev. Biol. 2020;136:429–454. - PubMed
    1. Kwon GS, Viotti M, Hadjantonakis A-K. The endoderm of the mouse embryo arises by dynamic widespread intercalation of embryonic and extraembryonic lineages. Dev. Cell. 2008;15:509–520. - PMC - PubMed
    1. Nowotschin S, et al. The emergent landscape of the mouse gut endoderm at single-cell resolution. Nature. 2019;569:361–367. - PMC - PubMed
    1. Pijuan-Sala B, et al. A single-cell molecular map of mouse gastrulation and early organogenesis. Nature. 2019;566:490–495. - PMC - PubMed

MeSH terms

Substances