. 2024 Jul;21(7):1349-1363.
doi: 10.1038/s41592-024-02298-3. Epub 2024 Jun 7.

Systematic assessment of long-read RNA-seq methods for transcript identification and quantification

Francisco J Pardo-Palacios #  1 Dingjie Wang #  2   3 Fairlie Reese #  4   5 Mark Diekhans #  6 Sílvia Carbonell-Sala #  7 Brian Williams #  8 Jane E Loveland #  9 Maite De María #  10   11 Matthew S Adams  12 Gabriela Balderrama-Gutierrez  4   5 Amit K Behera  13 Jose M Gonzalez Martinez  9 Toby Hunt  9 Julien Lagarde  7   14 Cindy E Liang  12 Haoran Li  2   3 Marcus Jerryd Meade  15 David A Moraga Amador  16 Andrey D Prjibelski  17   18 Inanc Birol  19 Hamed Bostan  20 Ashley M Brooks  20 Muhammed Hasan Çelik  4   5 Ying Chen  21 Mei R M Du  22 Colette Felton  13 Jonathan Göke  21   23 Saber Hafezqorani  19 Ralf Herwig  24 Hideya Kawaji  25 Joseph Lee  21 Jian-Liang Li  20 Matthias Lienhard  24 Alla Mikheenko  26 Dennis Mulligan  13 Ka Ming Nip  19 Mihaela Pertea  27   28 Matthew E Ritchie  22   29 Andre D Sim  21 Alison D Tang  13 Yuk Kei Wan  21   30 Changqing Wang  22 Brandon Y Wong  27   28 Chen Yang  19 If Barnes  9 Andrew E Berry  9 Salvador Capella-Gutierrez  31 Alyssa Cousineau  32 Namrita Dhillon  13 Jose M Fernandez-Gonzalez  31 Luis Ferrández-Peral  1 Natàlia Garcia-Reyero  33 Stefan Götz  34 Carles Hernández-Ferrer  31 Liudmyla Kondratova  35 Tianyuan Liu  36 Alessandra Martinez-Martin  1 Carlos Menor  34 Jorge Mestre-Tomás  1 Jonathan M Mudge  9 Nedka G Panayotova  16 Alejandro Paniagua  1 Dmitry Repchevsky  31 Xingjie Ren  37 Eric Rouchka  38 Brandon Saint-John  13 Enrique Sapena  39 Leon Sheynkman  15 Melissa Laird Smith  38 Marie-Marthe Suner  9 Hazuki Takahashi  40 Ingrid A Youngworth  41 Piero Carninci  40   42 Nancy D Denslow  10   43 Roderic Guigó  7   44 Margaret E Hunter  45 Rene Maehr  32 Yin Shen  46 Hagen U Tilgner  47 Barbara J Wold  8 Christopher Vollmers  48 Adam Frankish  49 Kin Fai Au  50   51 Gloria M Sheynkman  52   53   54 Ali Mortazavi  55   56 Ana Conesa  57   58 Angela N Brooks  59   60
Affiliations

Systematic assessment of long-read RNA-seq methods for transcript identification and quantification

Francisco J Pardo-Palacios et al. Nat Methods. 2024 Jul.

Abstract

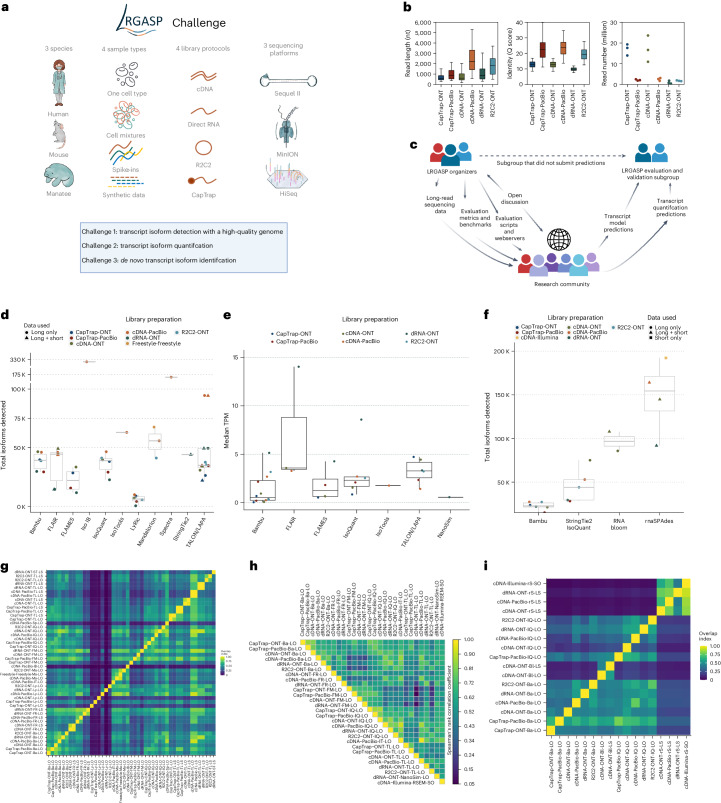
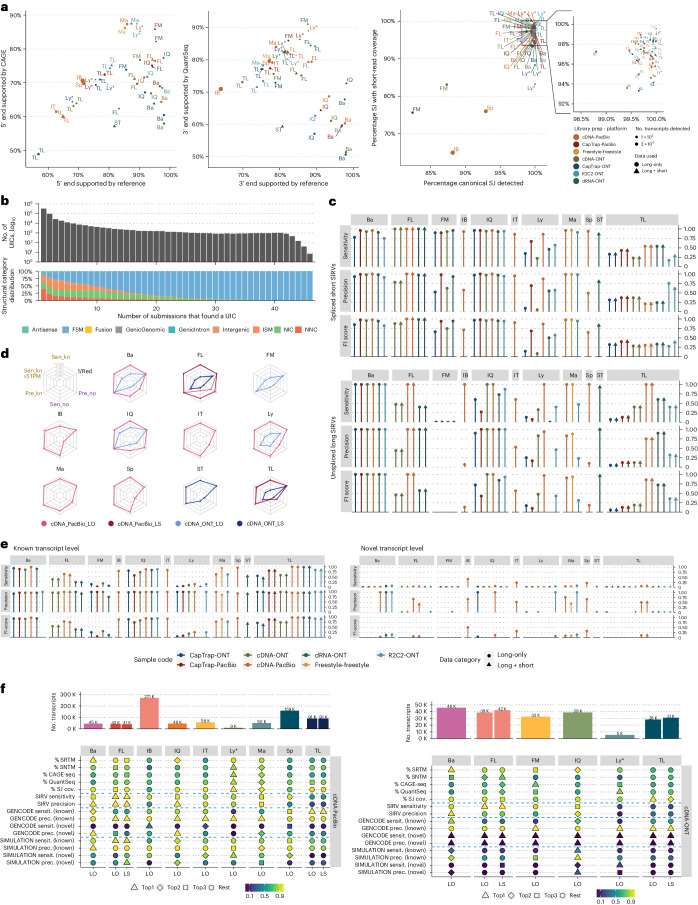
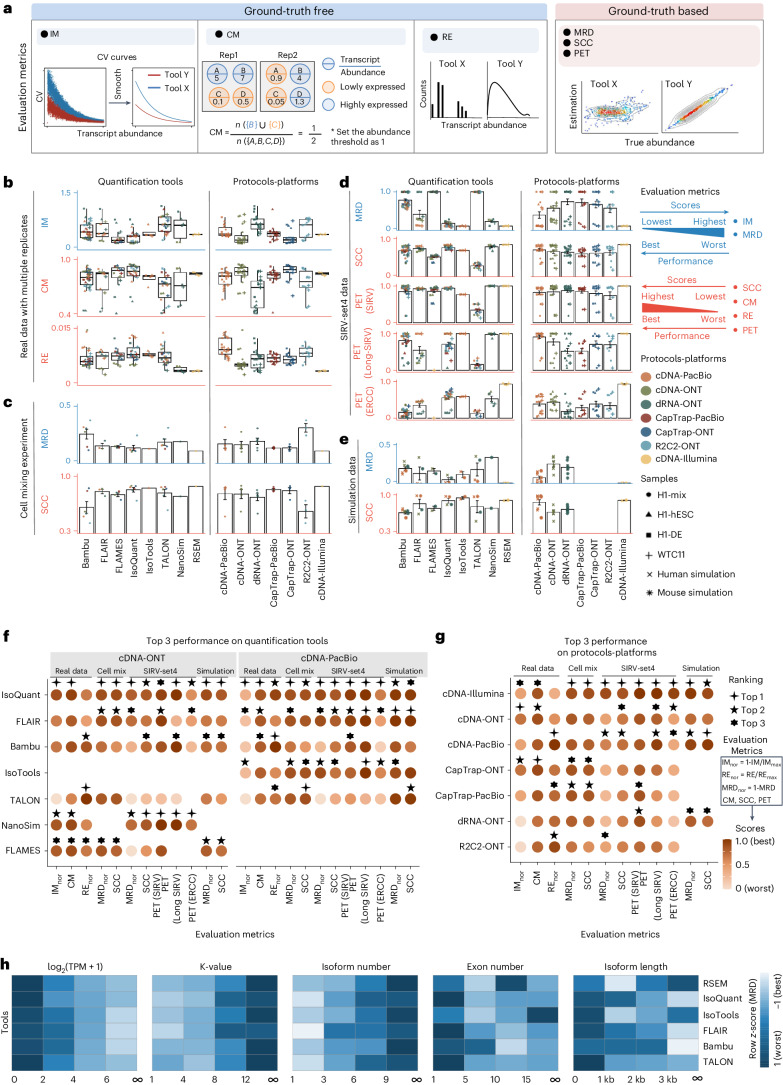
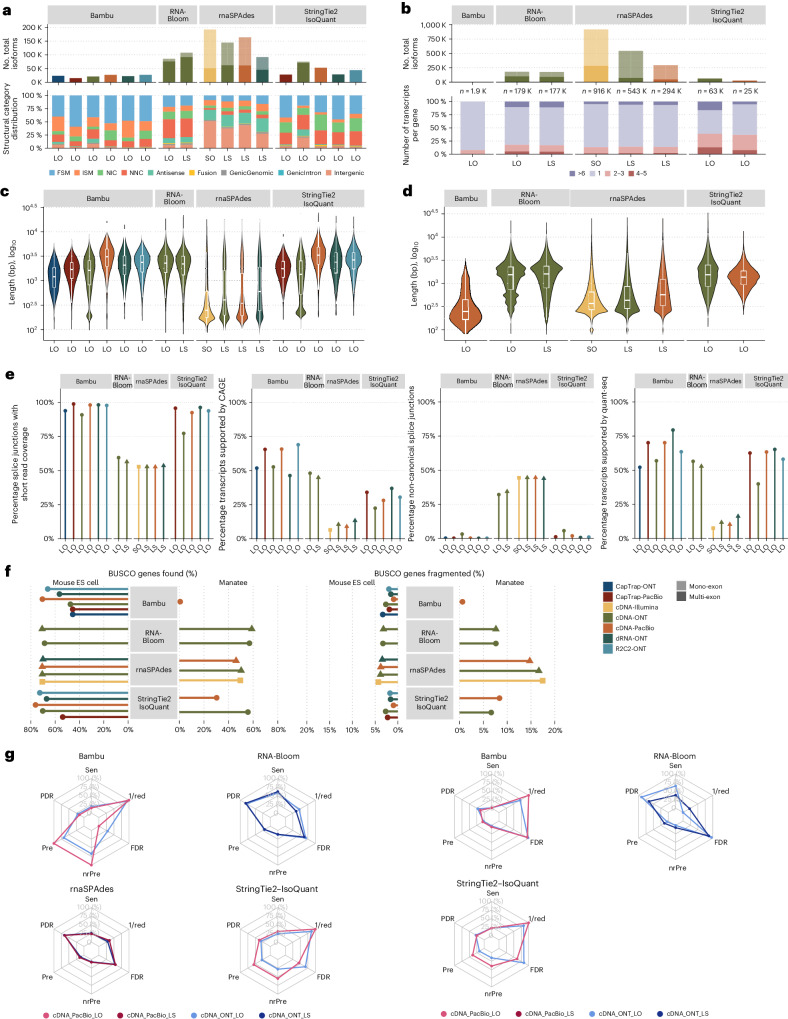
The Long-read RNA-Seq Genome Annotation Assessment Project Consortium was formed to evaluate the effectiveness of long-read approaches for transcriptome analysis. Using different protocols and sequencing platforms, the consortium generated over 427 million long-read sequences from complementary DNA and direct RNA datasets, encompassing human, mouse and manatee species. Developers utilized these data to address challenges in transcript isoform detection, quantification and de novo transcript detection. The study revealed that libraries with longer, more accurate sequences produce more accurate transcripts than those with increased read depth, whereas greater read depth improved quantification accuracy. In well-annotated genomes, tools based on reference sequences demonstrated the best performance. Incorporating additional orthogonal data and replicate samples is advised when aiming to detect rare and novel transcripts or using reference-free approaches. This collaborative study offers a benchmark for current practices and provides direction for future method development in transcriptome analysis.


Conflict of interest statement

The design of the project was discussed with ONT, PacBio and Lexogen. ONT provided partial support for flow cells and reagents. H.U.T. and A. Conesa have, in the past, presented at events organized by PacBio and have received reimbursement or support for travel, accommodation and conference fees. H.U.T. has also spoken at local ONT events during the duration of this project and received food. Unrelated to this project, the laboratory of H.U.T. has purchased reagents from Illumina, PacBio and ONT at discounted prices. S.C.-S., A.N.B. and J.G. have received reimbursement for travel, accommodation and conference fees to speak at events organized by ONT. A.N.B. is a consultant for Remix Therapeutics. A. Conesa is the founder of Biobam Bioinformatics. The other authors declare no competing interests.

Figures

Fig. 1
Fig. 1. Overview of the LRGASP.
a, Data produced for LRGASP. b, Distribution of read lengths, identify Q score and sequencing depth (per biological replicate) for the WTC11 sample. c, The collaborative design of the LRGASP organizers and participants. d, Number of isoforms reported by each tool on different data types for the human WTC11 sample for Challenge 1. Number of submissions per tool, in order, n = 6, 6, 4, 1, 6, 1, 6, 3, 1, 1 and 12. e, Median TPM value reported by each tool on different data types for the human WTC11 sample for Challenge 2. Number of submissions per tool, in order, n = 11, 3, 4, 6, 1, 6 and 1. f, Number of isoforms reported by each tool on different data types for the mouse ES data for Challenge 3. Number of submissions per tool, in order, n = 6, 5, 2 and 4. g, Pairwise relative overlap of unique junction chains (UJCs) reported by each submission. The UJCs reported by a submission are used as a reference set for each row. The fraction of overlap of UJCs from the column submission is shown as a heatmap. For example, a submission that has a small subset of many other UJCs from other submissions will have a high fraction shown in the rows but a low fraction by column for that submission. Data are only shown for WTC11 submissions. h, Spearman correlation of TPM values between submissions to Challenge 2. i, Pairwise relative overlap of UJCs reported by each submission. The UJCs reported by a submission are used as a reference set for each row. The fraction of overlap of UJCs from the column submission is shown as a heatmap. Ba, Bambu; Bl, RNA-Bloom; FM, FLAMES; FR, FLAIR; IB, Iso_IB; IQ, IsoQuant; IT, IsoTools; Ly, LyRic; Ma, Mandalorion; rS, rnaSPAdes; Sp, Spectra; ST, StringTie2; TL, TALON-LAPA. The figure was partially created with BioRender.com.
Fig. 2
Fig. 2. Evaluation of transcript identification with a reference annotation for Challenge 1.
a, Percentage of transcript models fully supported at 5′ ends either by reference annotation or same-sample CAGE data (left), 3′ end either by reference annotation or same-sample QuantSeq data (middle) and splice junctions (SJ) by short-read coverage or a canonical site (right). b, Agreement in transcript detection as a function of the number of detecting pipelines, c, Performance of tools based on spliced-short (top) and unspliced long SIRVs (bottom). d, Performance of tools based on simulated data. e, Performance of tools on known and novel transcripts of 50 genes manually annotated by GENCODE. f, Summary of performance metrics of tools for the cDNA-PacBio and cDNA-ONT benchmarking datasets. The color scale represents the performance value ranging from worse (dark blue) to better (light yellow). The graphic symbol indicates the ranking position of the tool for the metric represented in each row. LO, long (reads) only; LS, long and short (reads); Sen_kn, sensitivity for known transcripts; Pre_kn, precision for known transcripts; Sen_no, sensitivity for novel transcripts; Pre_no, precision for novel transcripts; 1/Red, inverse of redundancy.
Fig. 3
Fig. 3. Evaluation of transcript isoform quantification for Challenge 2.
a, Cartoon diagrams to explain evaluation metrics without or with a ground truth. be, Overall evaluation results of eight quantification tools and seven protocols-platforms on real data with multiple replicates (b), cell mixing experiment (c), SIRV-Set 4 data (d) and simulation data (e). Box plots of evaluation metrics across various datasets, depicting the minimum, lower quartile, median, upper quartile and maximum values. Bar plots represent the mean values of evaluation metrics across diverse datasets, with error bars indicating the s.d. b, Number of submissions per tool or protocol-platform, in order, n = 36, 12, 16, 24, 4, 24, 6, and 4 per tool or n = 22, 24, 26, 18, 18, 14 and 4 per protocol-platform. c, Number of submissions per tool or per protocol-platform, in order, n = 6, 3, 4, 6, 1, 6, 1 and 1 per tool or n = 5, 5, 6, 4, 4, 3 and 1 per protocol-platform. d, Number of submissions per tool or per protocol-platform, in order, n = 36, 12, 16, 24, 4, 24, 6 and 4 per tool or n = 22, 24, 26, 18, 18, 14 and 4 per protocol-platform. e, Number of submissions per tool or per protocol-platform, in order, n = 8, 4, 2, 4, 2, 4, 1 and 2 per tool or n = 12, 6, 7, 0, 0, 0 and 2 per protocol-platform. f, Quantification tool scores under common cDNA-ONT and cDNA-PacBio platforms across various evaluation metrics, with the top three performers highlighted for each metric. g, Based on the average values of each metric across all quantification tools, scores for protocols-platforms are displayed, along with the top three performers for each metric. Blank spaces denote instances where the tool or protocols-platforms did not have participants submitting the corresponding quantitative results. h, Evaluation of quantification tools with respect to multiple transcript features, including the number of isoforms, number of exons, isoform length and a customized statistic K-value representing the complexity of exon-isoform structures. Here, the normalized MRD metric is used to evaluate the performance of quantification tools on human cDNA-PacBio simulation data. Additionally, RSEM evaluation results with respect to transcript features based on human short-read simulation data are shown as a control.
Fig. 4
Fig. 4. Evaluation of transcript identification without a reference annotation for Challenge 3.
a, Number of detected transcripts and distribution of SQANTI structural categories, mouse ES cell sample. b, Number of detected transcripts and distribution of transcripts per loci, manatee sample. c, Length distribution of mouse ES cell transcripts predictions. Number of transcripts reported by each pipeline, in order, n = 23,540, 15,054, 21,312, 27,215, 21,913, 27,056, 85,720, 107,832, 192,324, 144,752, 164,117, 91,833, 28,293, 75,106, 52,944, 29,458 and 44,079. d, Length distribution of manatee transcripts predictions. Number of transcripts reported by each pipeline, in order, n = 1,911, 179,258, 176,895, 695,167, 535,845, 288,958, 63,000 and 25,643. e, Support by orthogonal data. f, BUSCO metrics. g, Performance metrics based on SIRVs. Sen, sensitivity; PDR, positive detection rate; Pre, precision; nrPred, non-redundant precision; SO, short only.
Fig. 5
Fig. 5. Experimental validation of known and novel isoforms.
a, Schematic for the experimental validation pipeline. QC, quality control b, Example of a consistently detected NIC isoform (detected in over half of all LRGASP pipeline submissions), which was successfully validated by targeted PCR. The primer set amplifies a new event of exon skipping (NIC). Only transcripts above ~5 CPM and any part of the GENCODE Basic annotation are shown. c, Example of a successfully validated new terminal exon, with ONT amplicon reads shown in the IGV track (PacBio produces similar results). d, Recovery rates for GENCODE-annotated isoforms that are reference matched (known), novel and rejected. e, Recovery rates for consistently versus rarely detected isoforms for known and novel isoforms. f, Recovery rates between isoforms that are more frequently identified in ONT versus PacBio pipelines. gi, Relationship between estimated transcript abundances (calculated as the sum of reads across all WTC11 sequencing samples) and validation success for GENCODE (g), consistent versus rare (h) and platform-preferential (i) isoforms. NV, not validated; V, validated. The number of transcripts in each category is shown in df. j, Fraction of validated transcripts as a function of the number of WTC11 samples in which supportive reads were observed. k, Example of two de novo isoforms in manatee validated through isoform-specific PCR amplification. Purple corresponds to the designed primers, orange to the possible amplification product associated with one isoform and black to the predicted isoforms. l, PCR validation results for manatee isoforms for seven target genes. Blue corresponds to supported transcripts and red to unsupported transcripts. The figure was partially created with BioRender.com.
Extended Data Fig. 1
Extended Data Fig. 1. SQANTI3 classifications of LRGASP submissions on the WTC11 dataset.
a) Comparison of the number of known genes to transcripts in those genes for the WTC11 dataset. b) Percentage of FSM (Full Splice Match) vs ISM (Incomplete Splice Match). c) Percentage of NIC (Novel In Catalog) vs NNC (Novel Not in Catalog). d) Percentage of known and novel transcripts with full support at junctions and end positions. Ba: Bambu, FM: FLAMES, FL: FLAIR, IQ: IsoQuant, IT: IsoTools, IB: Iso_IB, Ly: LyRic, Ma: Mandalorion, TL: TALON-LAPA, Sp: Spectra, ST: StringTie2.
Extended Data Fig. 2
Extended Data Fig. 2. Percentage of transcript models with different ranges of sequence coverage by long reads.
a) WTC11. b) H1-mix. c) Mouse ES. Ba: Bambu, FM: FLAMES, FL: FLAIR, IQ: IsoQuant, IT: IsoTools, IB: Iso_IB, Ly: LyRic, Ma: Mandalorion, TL: TALON-LAPA, Sp: Spectra, ST: StringTie2.
Extended Data Fig. 3
Extended Data Fig. 3. Positional coverage of long unspliced SIRV transcript sequences by long reads for each sample type.
The coverage of bases of long unspliced SIRV transcript by long reads for each sample type, grouped by sequence length range.
Extended Data Fig. 4
Extended Data Fig. 4. Properties of GENCODE manually annotated loci for WTC11 sample.
a) Distribution of gene expression. b) Distribution of SQANTI categories. c) Intersection of Unique Intron Chains (UIC) among experimental protocols.
Extended Data Fig. 5
Extended Data Fig. 5. Properties of GENCODE manually annotated loci for mouse ES sample.
a) Distribution of gene expression. b) Distribution of SQANTI categories. c) Intersection of Unique Intron Chains (UIC) among experimental protocols.
Extended Data Fig. 6
Extended Data Fig. 6. Overall evaluation results of eight quantification tools.
Evaluation results from seven protocols-platforms on four data scenarios: real data with multiple replicates, cell mixing experiment, SIRV-set 4 data, and simulation data. To display the evaluation results more effectively, we normalized all metrics to 0–1 range: 0 corresponds to the worst performance, and 1 corresponds to the best performance.
Extended Data Fig. 7
Extended Data Fig. 7. Top three performance on quantification tools.
Quantification results under six different protocols-platforms for each metric. Here, quantification tools showcase scores under six different protocols-platforms across various evaluation metrics, with the top three performers highlighted for each metric. Blank spaces denote instances where the tool or protocols-platforms did not have participants submitting the corresponding quantitative results.
Extended Data Fig. 8
Extended Data Fig. 8. SQANTI category classification of transcript models.
Results on transcript models detected by the same tools in Challenge 1 predictions using the reference annotation, and Challenge 3 predictions did not. Ba = Bambu, IQ = StringTie2/IsoQuant.
Extended Data Fig. 9
Extended Data Fig. 9. Fraction of experimentally validated WTC11 transcripts.
Experimental validation of WTC11 transcripts as a function of the total numbers of long reads that were observed across the 21 library preparations (for example, PacBio cDNA, ONT cDNA, PacBio CapTrap).

Update of

  • Systematic assessment of long-read RNA-seq methods for transcript identification and quantification.
    Pardo-Palacios FJ, Wang D, Reese F, Diekhans M, Carbonell-Sala S, Williams B, Loveland JE, De María M, Adams MS, Balderrama-Gutierrez G, Behera AK, Gonzalez JM, Hunt T, Lagarde J, Liang CE, Li H, Jerryd Meade M, Moraga Amador DA, Prjibelski AD, Birol I, Bostan H, Brooks AM, Hasan Çelik M, Chen Y, Du MRM, Felton C, Göke J, Hafezqorani S, Herwig R, Kawaji H, Lee J, Liang Li J, Lienhard M, Mikheenko A, Mulligan D, Ming Nip K, Pertea M, Ritchie ME, Sim AD, Tang AD, Kei Wan Y, Wang C, Wong BY, Yang C, Barnes I, Berry A, Capella S, Dhillon N, Fernandez-Gonzalez JM, Ferrández-Peral L, Garcia-Reyero N, Goetz S, Hernández-Ferrer C, Kondratova L, Liu T, Martinez-Martin A, Menor C, Mestre-Tomás J, Mudge JM, Panayotova NG, Paniagua A, Repchevsky D, Rouchka E, Saint-John B, Sapena E, Sheynkman L, Laird Smith M, Suner MM, Takahashi H, Youngworth IA, Carninci P, Denslow ND, Guigó R, Hunter ME, Tilgner HU, Wold BJ, Vollmers C, Frankish A, Fai Au K, Sheynkman GM, Mortazavi A, Conesa A, Brooks AN. Pardo-Palacios FJ, et al. bioRxiv [Preprint]. 2023 Jul 27:2023.07.25.550582. doi: 10.1101/2023.07.25.550582. bioRxiv. 2023. Update in: Nat Methods. 2024 Jul;21(7):1349-1363. doi: 10.1038/s41592-024-02298-3. PMID: 37546854 Free PMC article. Updated. Preprint.

Similar articles

Cited by

References

    1. Reese, M. G. et al. Genome annotation assessment in Drosophila melanogaster. Genome Res.10, 483–501 (2000). - PMC - PubMed
    1. Guigó, R. et al. EGASP: the human ENCODE genome annotation assessment project. Genome Biol.7, S2.1–31 (2006). - PMC - PubMed
    1. Engström, P. G. et al. Systematic evaluation of spliced alignment programs for RNA-seq data. Nat. Methods10, 1185–1191 (2013). - PMC - PubMed
    1. Steijger, T. et al. Assessment of transcript reconstruction methods for RNA-seq. Nat. Methods10, 1177–1184 (2013). - PMC - PubMed
    1. Carbonell-Sala, S. et al. CapTrap-Seq: a platform-agnostic and quantitative approach for high-fidelity full-length RNA transcript sequencing. Preprint at bioRxiv10.1101/2023.06.16.543444 (2023). - PMC - PubMed

Grants and funding