. 2024 Jul;25(7):3040-3063.
doi: 10.1038/s44319-024-00170-1. Epub 2024 Jun 7.

DLG1 functions upstream of SDCCAG3 and IFT20 to control ciliary targeting of polycystin-2

Affiliations

DLG1 functions upstream of SDCCAG3 and IFT20 to control ciliary targeting of polycystin-2

Csenge K Rezi et al. EMBO Rep. 2024 Jul.

Abstract

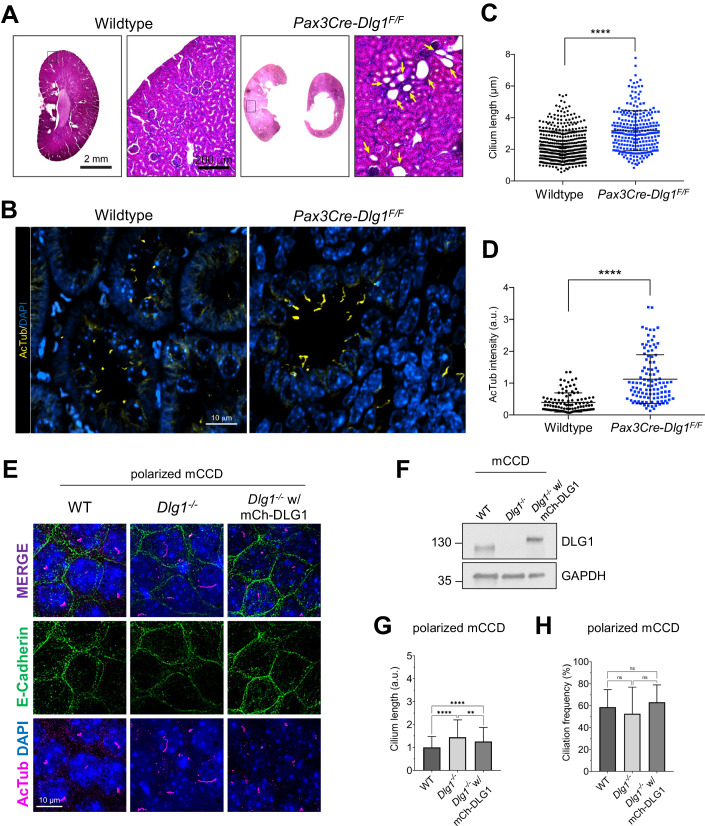
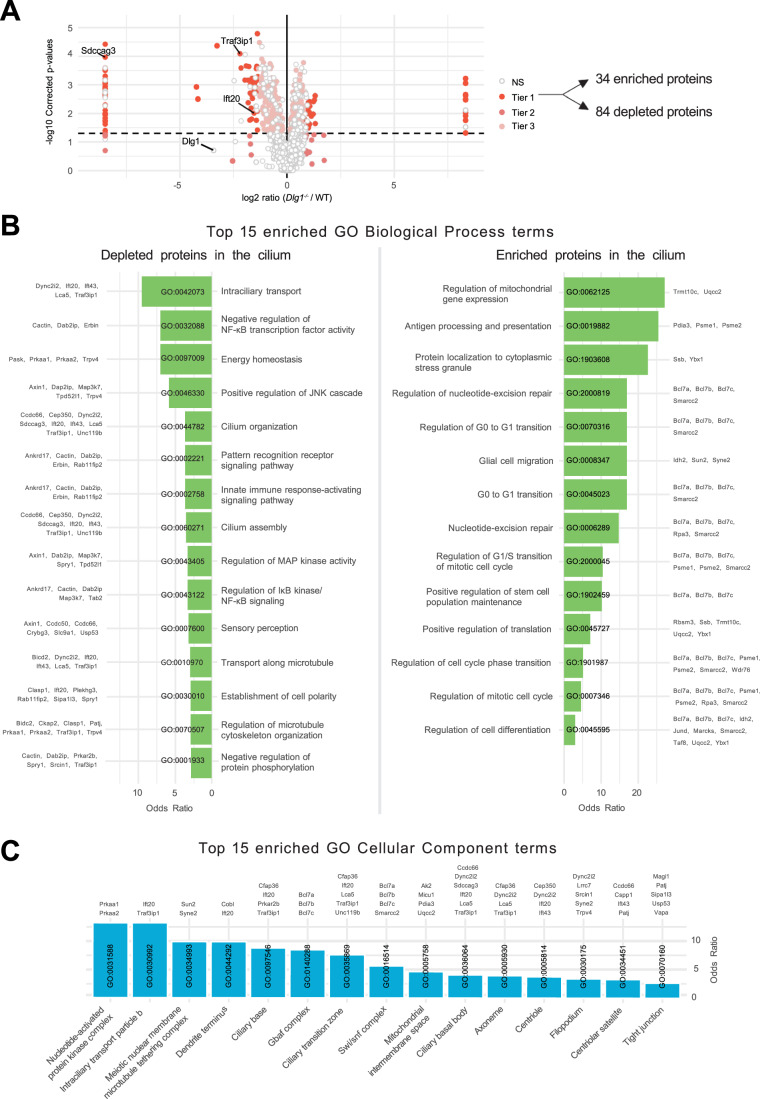
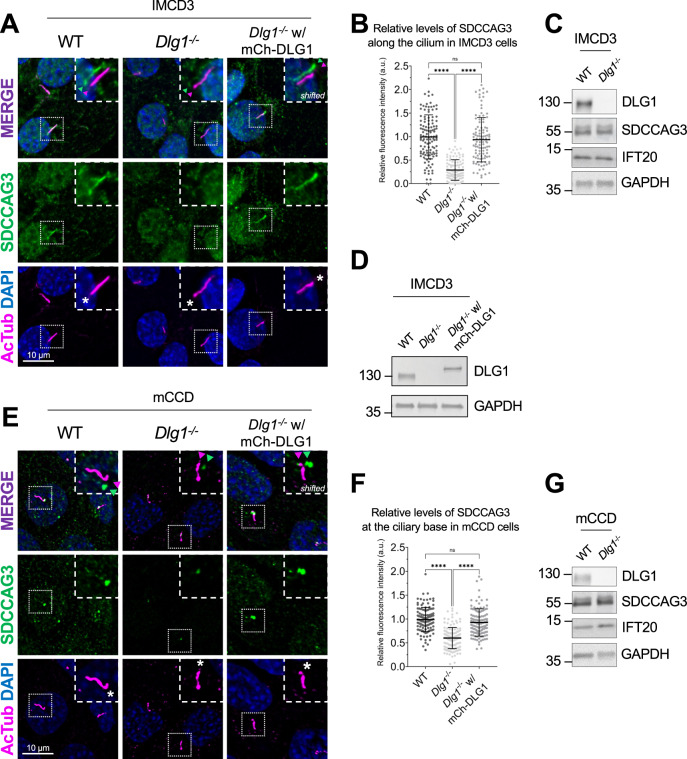
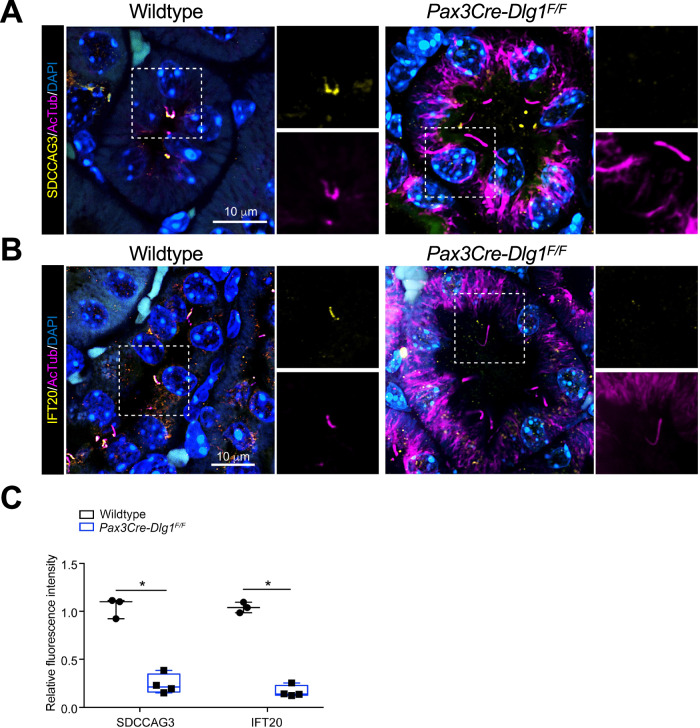
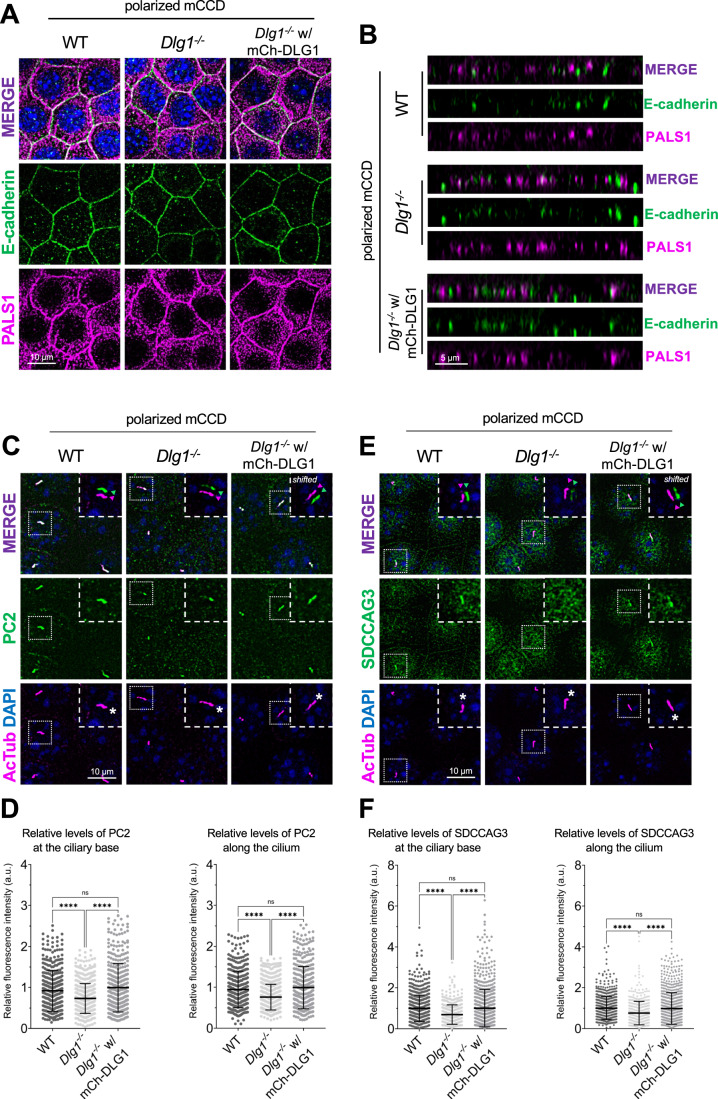
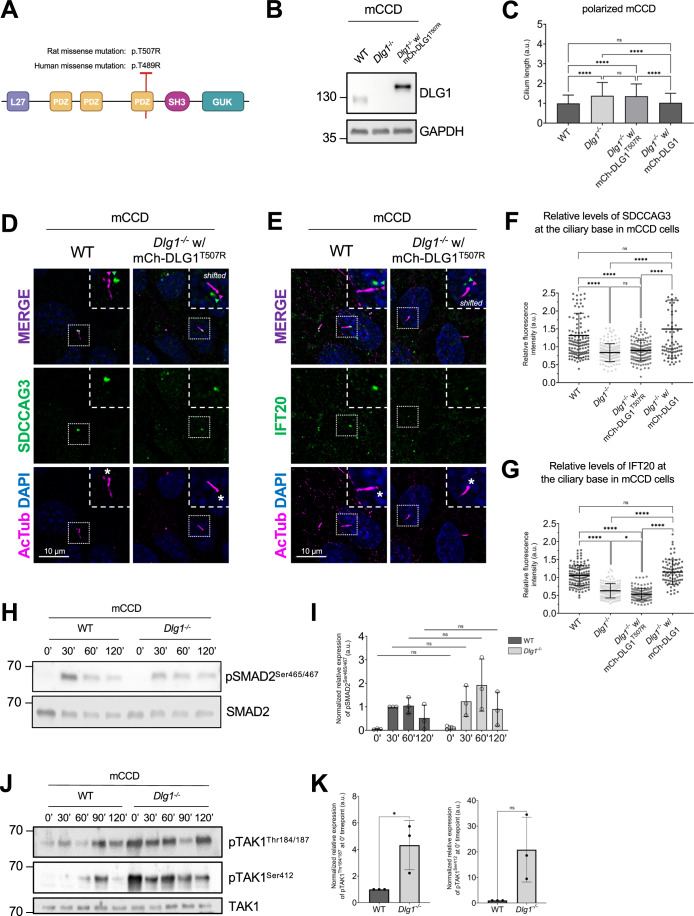
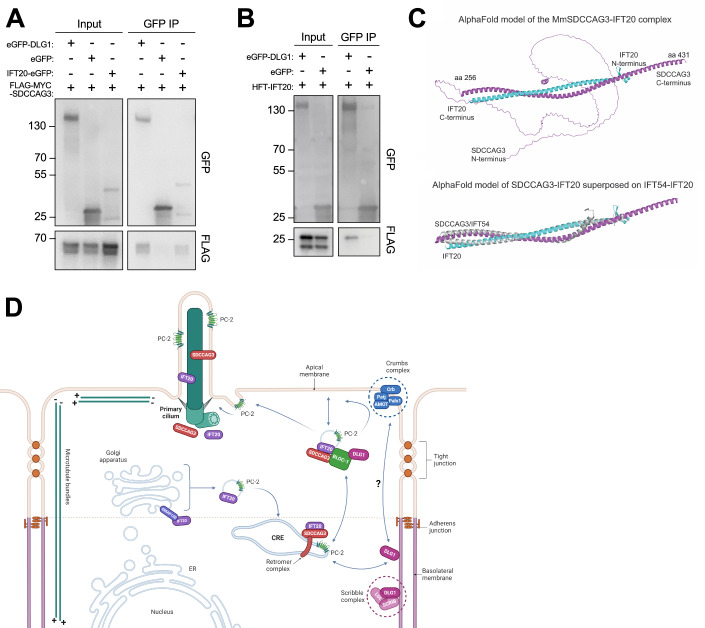
Polarized vesicular trafficking directs specific receptors and ion channels to cilia, but the underlying mechanisms are poorly understood. Here we describe a role for DLG1, a core component of the Scribble polarity complex, in regulating ciliary protein trafficking in kidney epithelial cells. Conditional knockout of Dlg1 in mouse kidney causes ciliary elongation and cystogenesis, and cell-based proximity labeling proteomics and fluorescence microscopy show alterations in the ciliary proteome upon loss of DLG1. Specifically, the retromer-associated protein SDCCAG3, IFT20, and polycystin-2 (PC2) are reduced in the cilia of DLG1-deficient cells compared to control cells. This phenotype is recapitulated in vivo and rescuable by re-expression of wild-type DLG1, but not a Congenital Anomalies of the Kidney and Urinary Tract (CAKUT)-associated DLG1 variant, p.T489R. Finally, biochemical approaches and Alpha Fold modelling suggest that SDCCAG3 and IFT20 form a complex that associates, at least indirectly, with DLG1. Our work identifies a key role for DLG1 in regulating ciliary protein composition and suggests that ciliary dysfunction of the p.T489R DLG1 variant may contribute to CAKUT.

Keywords: DLG1; IFT20; Polycystin-2; Primary Cilia; SDCCAG3.


Conflict of interest statement

The authors declare no competing interests.

Figures

Figure 1
Figure 1. Loss of Dlg1 in mouse kidney cells leads to elongated cilia.
(A) H&E staining of representative kidney sections from wild-type and Pax3Cre-Dlg1F/F mice. Black box denotes regions shown as magnified images on the right. Yellow arrows point to cystic tubules in the cortical region. (BD) Immunofluorescence staining for cilia (acetylated α-tubulin, yellow) and quantification of ciliary length (C) and ciliary acetylated α-tubulin intensity (D) in kidney sections of wild-type (n = 3) and Pax3Cre-Dlg1F/F (n = 4) mice at 4 months of age. Data are presented as mean ± SD and statistical analysis was performed using Student’s t-test. ****P < 0.0001. (E) Representative image of transwell filter-grown mCCD cell lines (mCh-DLG1: mCherry-DLG1). Cilia were visualized using acetylated α-tubulin antibody (AcTub, magenta), cell–cell contacts were visualized with E-cadherin antibody (green) and nuclei were stained with DAPI (blue). (F) Western blot analysis of total cell lysates of the indicated mCCD cells lines using antibodies against DLG1 and GAPDH (loading control). Molecular mass markers are shown in kDa to the left. (G, H) Quantification of ciliary length (G) and frequency (H) in the indicated transwell filter-grown mCCD lines. Ciliary length and ciliation rate were measured using a fully automated MATLAB script (see “Methods” for details). Graphs represent accumulated data from three independent experiments, and statistical analysis was performed using Mann–Whitney U test (unpaired, two-tailed). Error bars represent mean ± SD. **P < 0.01; ****P < 0.0001; ns, not statistically significant. Source data are available online for this figure.
Figure 2
Figure 2. Analysis of cilia mass spectrometry results.
(A) Volcano plot visualizing differential protein expression in the ciliary proteome upon disruption of DLG1. Logarithmic ratios are plotted against the negative logarithmic P-value of a Student’s t-test. The proteins are colored according to their significance tier (Tier 1, 2, 3, and non significant (NS)). The total amount of affected candidate ciliary proteins found in Tier 1 upon Dlg1 depletion are highlighted on the right side of the volcano plot, while the proteins related to this research are marked on the volcano plot. The complete list of identified proteins can be found in Dataset EV1. Note that there are multiple points with the same x axis values on either side of the plot. These proteins were the ones where the median intensity values for either the WT or Dlg1/− were 0. As a result, the log2 ratio was infinite and we introduced a pseudovalue that is two units above or below the maximum and minimum ratio value across all genes, respectively, to allow plotting of these points. (B, C) Gene Ontology enrichment analysis for biological process (B) and cellular component (C) using the proteins found in Tier 1. The tables show the top 15 terms that are significantly enriched (Fisher’s exact test value ≤ 0.05) and are listed in order of their enrichment ratio along with the corresponding GO terms.
Figure 3
Figure 3. Loss of DLG1 impairs ciliary localization of SDCCAG3 in IMCD3 and mCCD cells.
(A) Immunostaining of ciliated cilia-BioID2 IMCD3 cell lines showing comparative SDCCAG3 staining (green) in WT, Dlg1/− and mCherry-DLG1 (mCh-DLG1) rescue cells. Cilia were stained with antibodies against acetylated α-tubulin (AcTub, magenta), and nuclei visualized with DAPI staining (blue). Insets show enlarged images of cilia, and asterisks mark the ciliary base. The merged insets show primary cilia with channels shifted to aid visualization. (B) Quantification of the relative mean fluorescence intensity (MFI) of SDCCAG3 staining along the cilium of cilia-BioID2 IMCD3 cell lines. Graphs represent WT normalized and accumulated data of three independent biological replicates. The number of dots in each condition represents the total number of primary cilia quantified. Kruskal–Wallis test with Dunn’s multiple comparison test was used for the statistical analysis. Error bars represent mean ± SD. ****P < 0.0001; ns, not statistically significant. (C, D) Western blot analysis of total cell lysates of cilia-BioID2 IMCD3 cell lines. Blots were probed with antibodies as indicated, and GAPDH was used as a loading control. Molecular mass markers are shown in kDa to the left. (E) Immunostaining was done with anti-SDCCAG3 antibody (green) and anti-acetylated α-tubulin (AcTub, magenta) in ciliated mCCD WT, Dlg1−/ and mCherry-DLG1 (mCh-DLG1) rescue cells. Nuclei were visualized with DAPI staining (blue). Insets show enlarged images of cilia; asterisks mark the ciliary base. The merged insets show primary cilia with channels shifted to aid visualization. (F) Quantification of the relative MFI of SDCCAG3 staining at the ciliary base of mCCD cell lines. Graphs represent WT normalized and accumulated data of three independent biological replicates. The number of dots in each condition represents the total number of primary cilia quantified. Kruskal–Wallis test with Dunn’s multiple comparison test was used for the statistical analysis. Error bars represent mean ± SD. ****P < 0.0001; ns, not statistically significant. (G) Western blot analysis of total cell lysates of mCCD cell lines. Blots were probed with antibodies as indicated, and GAPDH was used as a loading control. Molecular mass markers are shown in kDa to the left. Source data are available online for this figure.
Figure 4
Figure 4. Conditional loss of DLG1 in mouse kidney leads to impaired ciliary localization of SDCCAG3 and IFT20.
(A, B) Immunofluorescence staining of SDCCAG3 (A) or IFT20 (B), both in yellow, and acetylated α-tubulin (AcTub, magenta) in kidney sections from wild-type and Pax3Cre-Dlg1F/F mice. (C) Quantification of relative MFI of SDCCAG3 and IFT20 in cilia of wild-type (n = 3) and Pax3Cre-Dlg1F/F (n = 4) mice, respectively. The levels from control mice were set to 1, and the ciliary levels from mutant mice were compared to that (i.e., relative fluorescence intensity). Data shown are the average values from each mouse. The vertical segments in box plots show the first quartile, median, and third quartile. The whiskers on both ends represent the maximum and minimum values for each dataset analyzed. Statistical analysis was performed two-tail unpaired t-test. *P < 0.05, **P < 0.01. Source data are available online for this figure.
Figure 5
Figure 5. Loss of DLG1 affects ciliary composition in transwell filter-grown mCCD cells.
(A, B) Representative top (A) and side view (B) confocal images of transwell filter-grown WT, Dlg1−/− and mCherry-DLG1 (mCh-DLG1) rescue lines. The cells were stained for E-cadherin (green) and PALS1 (magenta) to visualize the basolateral membrane and apical-lateral border, respectively. (C, D) IFM analysis of PC2 in the indicated transwell filter-grown cell lines. (C) Immunostaining with anti-PC2 antibody (green) of transwell filter-grown mCCD cell lines, where cilia were visualized with antibodies against α-acetylated tubulin (AcTub, magenta), and nuclei stained with DAPI (blue). Insets show enlarged images of cilia, while the merged insets show primary cilia with channels shifted to aid visualization. Asterisks mark the ciliary base. (D) Quantification of the relative MFI of PC2 along the cilium (right panel) and at the ciliary base (left panel). The MFI of PC2 was measured using the fully automated MATLAB-based quantification. The graphs represent WT normalized and accumulated data of three independent biological replicates. The number of dots in each condition represents the total number of primary cilia quantified. Statistical analysis utilized one-way ANOVA with Tukey’s multiple comparison test. Error bars represent mean ± SD. ****P < 0.0001; ns, not statistically significant. (E, F) IFM analysis of SDCCAG3 in the indicated transwell filter-grown cell lines. (E) Cilia were visualized with antibodies against acetylated α-tubulin (AcTub, magenta) and nuclei stained with DAPI (blue). Insets show enlarged images of cilia, while the merged insets show primary cilia with channels shifted to aid visualization. Asterisks mark the ciliary base. (F) Quantification of the relative MFI of SDCCAG3 along the cilium (right panel) and at the ciliary base (left panel). The MFI of SDCCAG3 was measured using the fully automated MATLAB-based quantification. The graphs represent WT normalized and accumulated data of three independent biological replicates. The number of dots in each condition represents the total number of primary cilia quantified. Statistical analysis utilized one-way ANOVA with Tukey’s multiple comparison test. Error bars represent mean ± SD. ****P < 0.0001; ns, not statistically significant. Source data are available online for this figure.
Figure 6
Figure 6. A CAKUT-associated DLG1 missense variant fails to rescue ciliary phenotype of Dlg1−/− mCCD cells.
(A) DLG1 protein domain structure and schematic representation and localization of the human CAKUT-associated DLG1T489R variant and the rat counterpart (DLG1T507R). The specific human WT DLG1 isoform depicted is DLG1-210 (UniProt Q12959-5), which is encoded by transcript ENST00000422288 (ensembl.org) (Nicolaou et al, 2016); the corresponding WT rat DLG1 isoform is UniProt A0A8I6A5M7. (B) Western blot validation of stable expression of transgenic mutant mCherry-DLG1 (mCh-DLG1T507R) in mCCD cells using antibodies as indicated. (C) Ciliary length measurements of indicated cell lines, grown on transwell filters. The ciliary length was measured using the fully automated MATLAB-based quantification. The graphs represent accumulated data of three independent biological replicates. Kruskal–Wallis test with Dunn’s multiple comparison test was used for statistical analysis. Error bars represent mean ± SD. ****P < 0.0001; ns, not statistically significant. (D, E) IFM analysis of the indicated ciliated cell lines using antibodies against SDCCAG3 (D) or IFT20 (E), both shown in green. Acetylated α-tubulin (AcTub, magenta) was used to stain cilia; nuclei were visualized with DAPI (blue). Insets show enlarged images of cilia, while the merged insets show primary cilia with channels shifted to aid visualization. Asterisks mark the ciliary base. (F, G) Quantification of relative MFI of SDCCAG3 (F) and IFT20 (G) at the ciliary base of indicated mCCD cell lines, based on images as shown in (D, E), respectively. Kruskal–Wallis test with Dunn’s multiple comparison test was used for statistical analysis and graphs represent WT normalized and accumulated data of three independent biological replicates, with dots representing total number of cilia analyzed. Error bars represent mean ± SD. ****P < 0.0001; ns, not statistically significant. (H) Western blot analysis of total or phosphorylated (p) SMAD2 upon stimulation with TGFβ-1 ligand for indicated times in growth-arrested mCCD cells. (I) Quantifications of protein phosphorylation shown in (H), which represent WT-30’ normalized and accumulated data of three independent biological replicates. Error bars represent mean ± SD. (J) Western blot analysis of total or phosphorylated (p) TAK1 upon stimulation with TGFβ-1 ligand for indicated times in growth-arrested mCCD cells. (K) Quantifications of protein phosphorylation shown in (J), which represent WT-0’ normalized and accumulated data of three independent experimental replicates. Error bars represent mean ± SD. *P < 0.05; ns, not statistically significant. Source data are available online for this figure.
Figure 7
Figure 7. Analysis of DLG1, IFT20, and SDCCAG3 interactions.
(A, B) Immunoprecipitation with anti-GFP beads was performed in HEK293T cells transiently expressing FLAG-Myc-SDCCAG3 (A) or FLAG-IFT20 (HTF-IFT20) (B) together with the indicated GFP-fusions. Input and pellet fractions were subjected to SDS-PAGE and western blot analysis using antibodies against FLAG or GFP, as indicated, and GFP expressed alone was used as a negative control. Molecular mass markers are indicated in kDa to the left. (C) Structural prediction for the complex between MmSDCCAG3 (yellow) and MmIFT20 (cyan) in cartoon representation (upper panel). The structure is predicted to be an anti-parallel hetero-dimer coiled coil. The lower panel includes IFT54 showing its binding to IFT20 is mutually exclusive with binding of SDCCAG3 to IFT20. (D) Proposed model for how DLG1 promotes ciliary trafficking of SDCCAG3, IFT20 and PC2. Based on (Hu and Harris, ; Monis et al, 2017) and data presented in the current study. CRE common recycling endosome. Source data are available online for this figure.

Update of

References

    1. Ahn S, Kim Y, Kim ST, Swat W, Miner JH. Scaffolding proteins DLG1 and CASK cooperate to maintain the nephron progenitor population during kidney development. J Am Soc Nephrol. 2013;24:1127–1138. doi: 10.1681/ASN.2012111074. - DOI - PMC - PubMed
    1. Akhmanova A, Kapitein LC. Mechanisms of microtubule organization in differentiated animal cells. Nat Rev Mol Cell Biol. 2022;23:541–558. doi: 10.1038/s41580-022-00473-y. - DOI - PubMed
    1. Alexa A, Rahnenfuhrer J (2023) topGO: Enrichment analysis for gene ontology, R package version 2540. p. https://bioconductor.org/packages/topGO
    1. Aslanyan MG, Doornbos C, Diwan GD, Anvarian Z, Beyer T, Junger K, van Beersum SEC, Russell RB, Ueffing M, Ludwig A, et al. A targeted multi-proteomics approach generates a blueprint of the ciliary ubiquitinome. Front Cell Dev Biol. 2023;11:1113656. doi: 10.3389/fcell.2023.1113656. - DOI - PMC - PubMed
    1. Avasthi P, Marshall WF. Stages of ciliogenesis and regulation of ciliary length. Differentiation. 2012;83:S30–42. doi: 10.1016/j.diff.2011.11.015. - DOI - PMC - PubMed

MeSH terms

Supplementary concepts

LinkOut - more resources