

Association between maternal blood lipids and neonatal hypoglycaemia in pregnancy with gestational diabetes mellitus: a cohort study
- PMID: 38849832
- PMCID: PMC11157930
- DOI: 10.1186/s12944-024-02168-z
Association between maternal blood lipids and neonatal hypoglycaemia in pregnancy with gestational diabetes mellitus: a cohort study
Abstract
Background: Gestational diabetes mellitus (GDM) prevalence is on the rise globally. Offspring of diabetic mothers face increased risk of neonatal hypoglycaemia (NH), and women with GDM have abnormal lipid profiles. However, there is no consensus on the link between maternal blood lipids and NH in infants from mothers with GDM. This study aimed to explore how maternal blood lipids affect NH.
Methods: A retrospective cohort study was conducted at the First Affiliated Hospital of Sun Yat-sen University. Information on participants' baseline characteristics and maternal metabolic profiles of glucose and lipids was collected. Significant variables from the univariate analysis were included in logistic regression, which was used to construct the predictive model for NH. A nomogram was constructed for visualizing the model and assessed using the area under the receiver operating characteristic (ROC) curve (AUC).
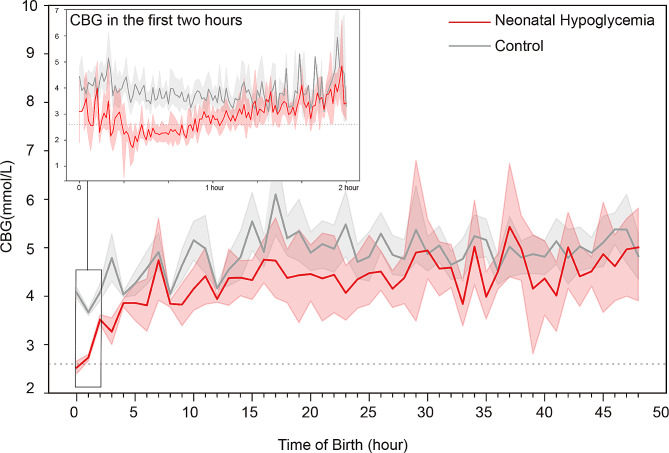
Results: Neonatal capillary blood glucose (CBG) decreased rapidly in the first hour after birth, increased gradually from the first to the second hour, and then remained stable. In the NH group, 86.11% (502/583) of hypoglycaemia cases occurred within the first two hours after birth. Multivariate logistic regression suggested that the lipid indices of maternal apoprotein B/apoprotein A1 (Apo-B/Apo-A1) (odds ratio (OR) = 1.36, 95% confidence intervals (CIs): 1.049-1.764, P = 0.02) and apoprotein E (Apo-E) (OR = 1.014, 95% CIs: 1.004-1.024, P = 0.004) were positively associated with NH in neonates from mothers with GDM. Triglycerides (TGs) (OR = 0.883, 95% CIs: 0.788-0.986, P = 0.028) were inversely associated with NH. Maternal glycated haemoglobin (HbA1c), age, twin pregnancy and caesarean delivery also had predictive value of NH. The AUC of the nomogram derived from these factors for the prediction model of NH was 0.657 (95% CIs: 0.630-0.684).
Conclusions: The present study revealed that the Apo-B/Apo-A1 and Apo-E levels were associated with an increased risk of NH. A nomogram was developed to forecast the risk of NH in babies born to mothers with GDM, incorporating maternal blood lipids, HbA1c, age, twin pregnancy, and caesarean section. The trajectory of glycaemia for neonates indicates the need for intensive CBG monitoring within 2 h of birth for neonates from mothers with GDM.
Keywords: Blood lipids; Gestational diabetes mellitus; Neonatal hypoglycaemia; Nomogram; Prediction model.
© 2024. The Author(s).
Conflict of interest statement
The authors declare no competing interests.
Figures


Similar articles
-
Safe threshold of capillary blood glucose for predicting early future neonatal hypoglycaemia in babies born to mothers with gestational diabetes mellitus, an observational, retrospective cohort study.BMC Pregnancy Childbirth. 2021 Jul 9;21(1):499. doi: 10.1186/s12884-021-03973-5. BMC Pregnancy Childbirth. 2021. PMID: 34243753 Free PMC article.
-
The correlation between blood-lipid ratio in the first trimester and large-for-gestational-age infants.Lipids Health Dis. 2023 Feb 1;22(1):18. doi: 10.1186/s12944-023-01781-8. Lipids Health Dis. 2023. PMID: 36726150 Free PMC article.
-
Late-pregnancy dysglycemia in obese pregnancies after negative testing for gestational diabetes and risk of future childhood overweight: An interim analysis from a longitudinal mother-child cohort study.PLoS Med. 2018 Oct 29;15(10):e1002681. doi: 10.1371/journal.pmed.1002681. eCollection 2018 Oct. PLoS Med. 2018. PMID: 30372451 Free PMC article.
-
Screening and diagnosing gestational diabetes mellitus.Evid Rep Technol Assess (Full Rep). 2012 Oct;(210):1-327. Evid Rep Technol Assess (Full Rep). 2012. PMID: 24423035 Free PMC article. Review.
-
[Gestational diabetes mellitus (Update 2019)].Wien Klin Wochenschr. 2019 May;131(Suppl 1):91-102. doi: 10.1007/s00508-018-1419-8. Wien Klin Wochenschr. 2019. PMID: 30980150 Review. German.
References
-
- Classification and Diagnosis of Diabetes Standards of Medical Care in Diabetes-2018. Diabetes Care. 2018;41(Suppl 1):S13–27. - PubMed
-
- Yew TW, Chi C, Chan SY, van Dam RM, Whitton C, Lim CS, et al. A randomized controlled trial to evaluate the effects of a Smartphone Application-based Lifestyle Coaching Program on Gestational Weight Gain, Glycemic Control, and maternal and neonatal outcomes in Women with Gestational Diabetes Mellitus: the SMART-GDM study. Diabetes Care. 2021;44(2):456–63. doi: 10.2337/dc20-1216. - DOI - PMC - PubMed
MeSH terms
Substances
Grants and funding
LinkOut - more resources
Full Text Sources
Medical
Research Materials
Miscellaneous
