

NIR triggered polydopamine coated cerium dioxide nanozyme for ameliorating acute lung injury via enhanced ROS scavenging
- PMID: 38849841
- PMCID: PMC11162040
- DOI: 10.1186/s12951-024-02570-w
NIR triggered polydopamine coated cerium dioxide nanozyme for ameliorating acute lung injury via enhanced ROS scavenging
Abstract
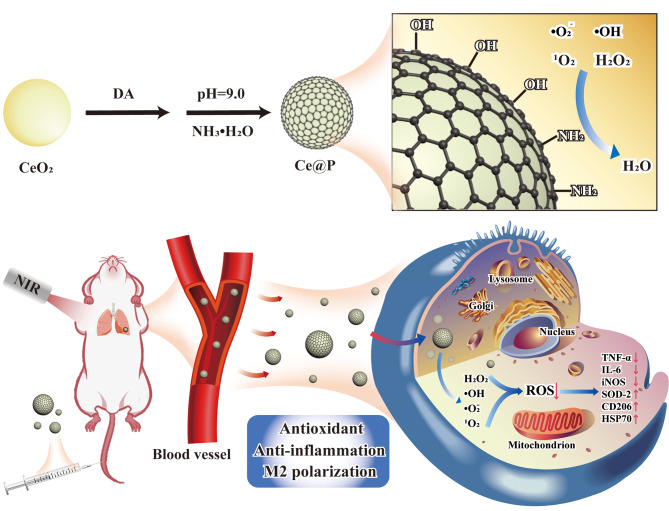
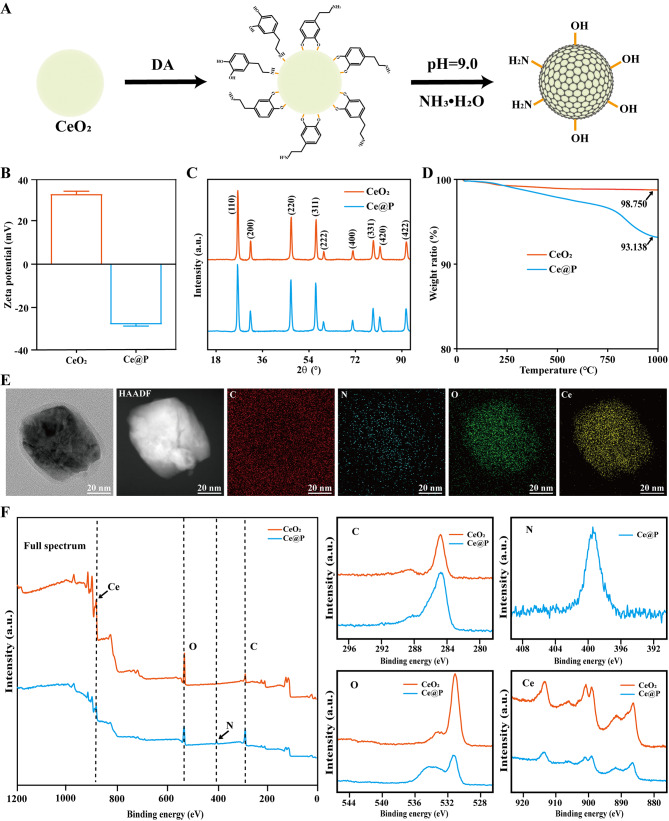
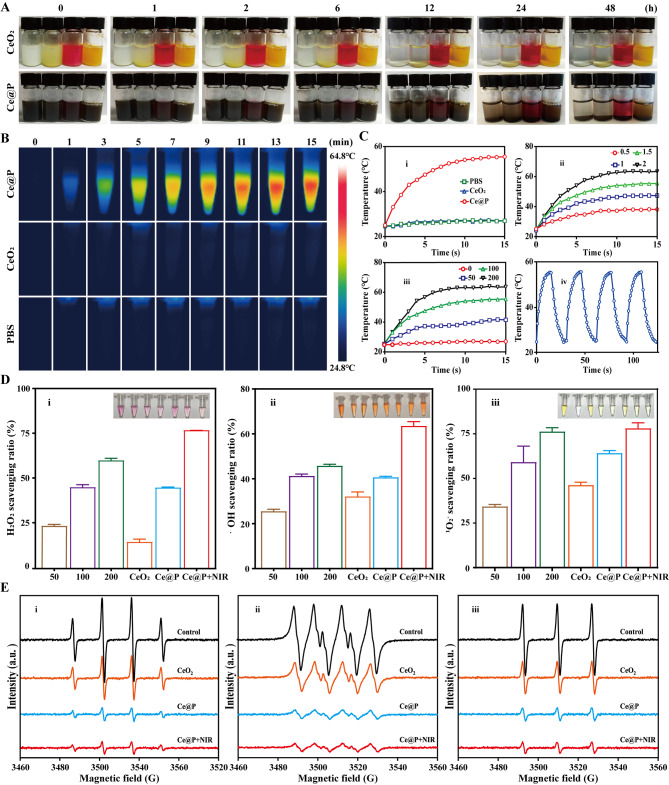
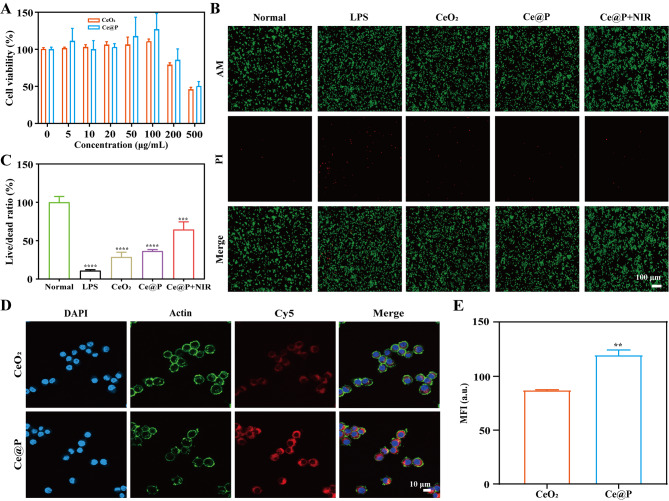
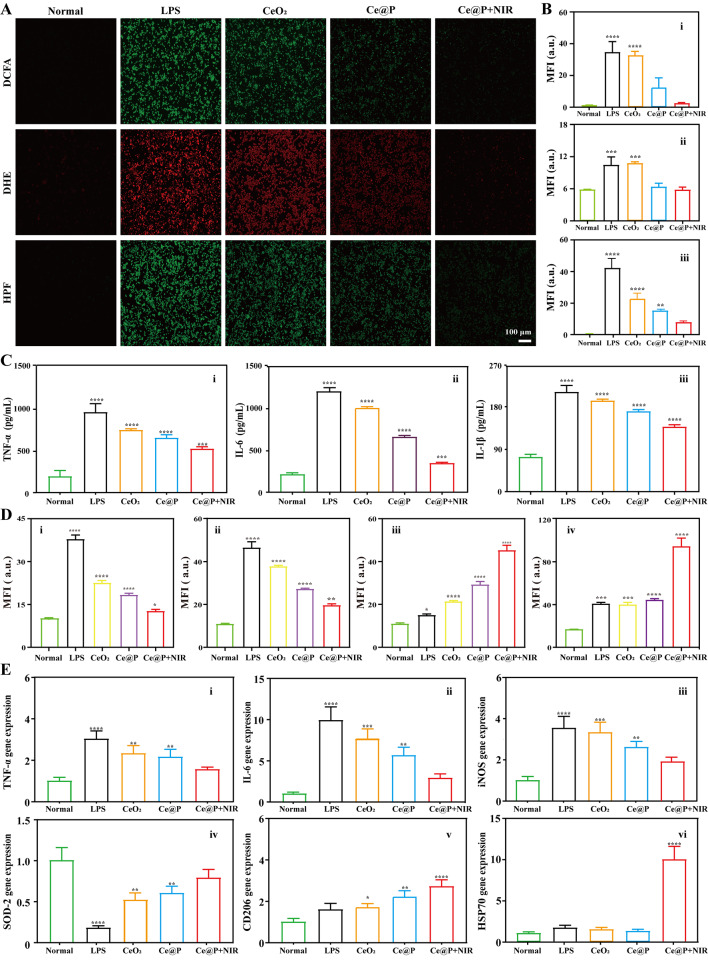
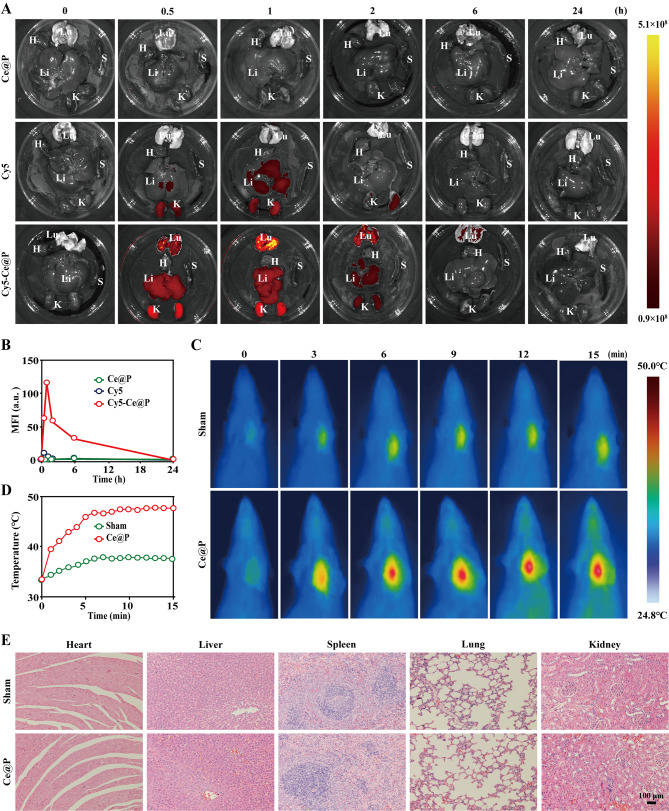
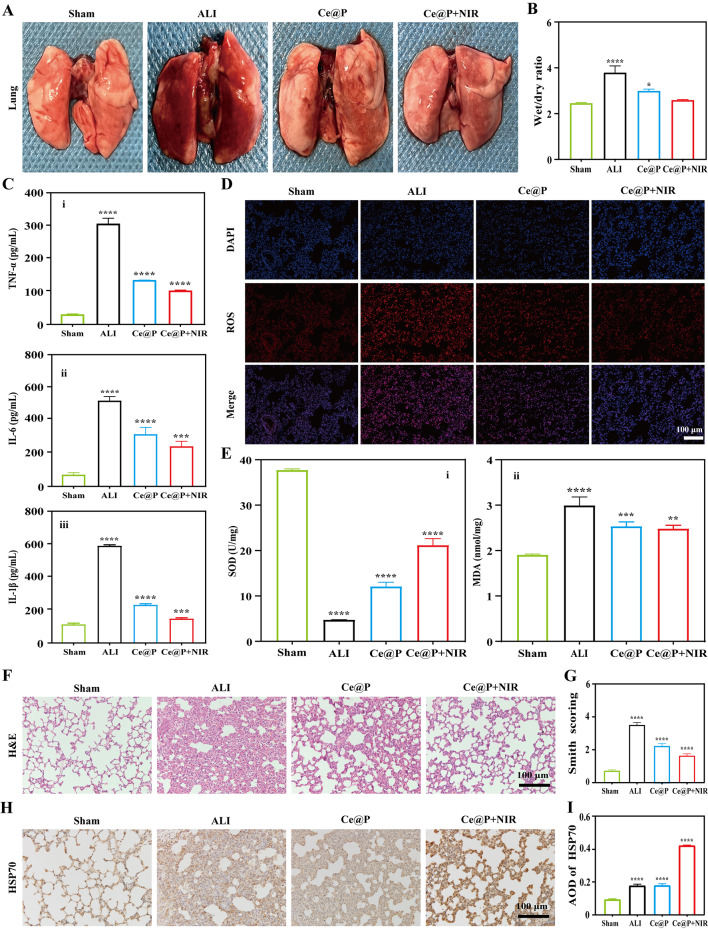
Acute lung injury (ALI) is a life threatening disease in critically ill patients, and characterized by excessive reactive oxygen species (ROS) and inflammatory factors levels in the lung. Multiple evidences suggest that nanozyme with diversified catalytic capabilities plays a vital role in this fatal lung injury. At present, we developed a novel class of polydopamine (PDA) coated cerium dioxide (CeO2) nanozyme (Ce@P) that acts as the potent ROS scavenger for scavenging intracellular ROS and suppressing inflammatory responses against ALI. Herein, we aimed to identify that Ce@P combining with NIR irradiation could further strengthen its ROS scavenging capacity. Specifically, NIR triggered Ce@P exhibited the most potent antioxidant and anti-inflammatory behaviors in lipopolysaccharide (LPS) induced macrophages through decreasing the intracellular ROS levels, down-regulating the levels of TNF-α, IL-1β and IL-6, up-regulating the level of antioxidant cytokine (SOD-2), inducing M2 directional polarization (CD206 up-regulation), and increasing the expression level of HSP70. Besides, we performed intravenous (IV) injection of Ce@P in LPS induced ALI rat model, and found that it significantly accumulated in the lung tissue for 6 h after injection. It was also observed that Ce@P + NIR presented the superior behaviors of decreasing lung inflammation, alleviating diffuse alveolar damage, as well as promoting lung tissue repair. All in all, it has developed the strategy of using Ce@P combining with NIR irradiation for the synergistic enhanced treatment of ALI, which can serve as a promising therapeutic strategy for the clinical treatment of ROS derived diseases as well.
Keywords: Acute lung injury; M2 directional polarization; Nanozyme; ROS scavenging; Synergistic enhanced therapy.
© 2024. The Author(s).
Conflict of interest statement
The authors declare no competing interests.
Figures
Similar articles
-
Reprogramming Lung Redox Homeostasis by NIR Driven Ultra-Small Pd Loaded Covalent Organic Framework Inhibits NF-κB Pathway for Acute Lung Injury Immunotherapy.Adv Sci (Weinh). 2025 Apr;12(14):e2413697. doi: 10.1002/advs.202413697. Epub 2025 Feb 18. Adv Sci (Weinh). 2025. PMID: 39965148 Free PMC article.
-
Polydopamine Modified Ceria Nanorods Alleviate Inflammation in Colitis by Scavenging ROS and Regulating Macrophage M2 Polarization.Int J Nanomedicine. 2023 Aug 14;18:4601-4616. doi: 10.2147/IJN.S416049. eCollection 2023. Int J Nanomedicine. 2023. PMID: 37600119 Free PMC article.
-
Synergistic anti-oxidative/anti-inflammatory treatment for acute lung injury with selenium based chlorogenic acid nanoparticles through modulating Mapk8ip1/MAPK and Itga2b/PI3k-AKT axis.J Nanobiotechnology. 2025 Jan 23;23(1):37. doi: 10.1186/s12951-025-03114-6. J Nanobiotechnology. 2025. PMID: 39849453 Free PMC article.
-
Different approaches to synthesising cerium oxide nanoparticles and their corresponding physical characteristics, and ROS scavenging and anti-inflammatory capabilities.J Mater Chem B. 2021 Sep 22;9(36):7291-7301. doi: 10.1039/d1tb01091c. J Mater Chem B. 2021. PMID: 34355717 Review.
-
Reactive oxygen species-scavenging biomaterials for neural regenerative medicine.Biomater Sci. 2025 Jan 14;13(2):343-363. doi: 10.1039/d4bm01221f. Biomater Sci. 2025. PMID: 39620279 Review.
Cited by
-
Reprogramming Lung Redox Homeostasis by NIR Driven Ultra-Small Pd Loaded Covalent Organic Framework Inhibits NF-κB Pathway for Acute Lung Injury Immunotherapy.Adv Sci (Weinh). 2025 Apr;12(14):e2413697. doi: 10.1002/advs.202413697. Epub 2025 Feb 18. Adv Sci (Weinh). 2025. PMID: 39965148 Free PMC article.
-
The Role of Inorganic Nanomaterials in Overcoming Challenges in Colorectal Cancer Diagnosis and Therapy.Pharmaceutics. 2025 Mar 25;17(4):409. doi: 10.3390/pharmaceutics17040409. Pharmaceutics. 2025. PMID: 40284405 Free PMC article. Review.
-
Pathophysiological mechanisms of ARDS: a narrative review from molecular to organ-level perspectives.Respir Res. 2025 Feb 13;26(1):54. doi: 10.1186/s12931-025-03137-5. Respir Res. 2025. PMID: 39948645 Free PMC article. Review.
-
Therapeutic Potential of PDA@CeO2 in Suppressing Hepatic Stellate Cell Activation and Preventing Liver Fibrosis.Int J Nanomedicine. 2025 Jul 15;20:9073-9091. doi: 10.2147/IJN.S521372. eCollection 2025. Int J Nanomedicine. 2025. PMID: 40689015 Free PMC article.
-
Surface Engineering-Induced d-Band Center Down-Regulation in High-Entropy Alloy Nanowires for Enhanced Nanozyme Catalysis.Adv Sci (Weinh). 2025 Jul;12(25):e2502354. doi: 10.1002/advs.202502354. Epub 2025 Apr 7. Adv Sci (Weinh). 2025. PMID: 40192189 Free PMC article.
References
-
- FAN E, BRODIE D, SLUTSKY A S. Acute respiratory distress syndrome: advances in diagnosis and treatment. JAMA. 2018;319(7):698–710. - PubMed
-
- Deng J, Wang R, Huang S, Ding J, Zhou W. Macrophages-regulating nanomedicines for sepsis therapy. Chin Chem Lett. 2023;34:107588. doi: 10.1016/j.cclet.2022.06.011. - DOI
MeSH terms
Substances
Grants and funding
- 2023KY0117/2023 Basic Ability Improvement Project for Young and Middle-Aged Teachers in Colleges and Universities in Guangxi
- S2020099/Medical Appropriate Technology Development and Popularization and Application Project of Guangxi
- 2023JJA140322/Natural Science Foundation of Guangxi
- 82060022/National Natural Science Foundation of China
- 82360372/National Natural Science Foundation of China
LinkOut - more resources
Full Text Sources
Miscellaneous
