. 2024 Jun 7;22(1):549.
doi: 10.1186/s12967-024-05369-3.

Spatiotemporal heterogeneity of LMOD1 expression summarizes two modes of cell communication in colorectal cancer

Affiliations

Spatiotemporal heterogeneity of LMOD1 expression summarizes two modes of cell communication in colorectal cancer

Jie-Pin Li et al. J Transl Med. .

Abstract

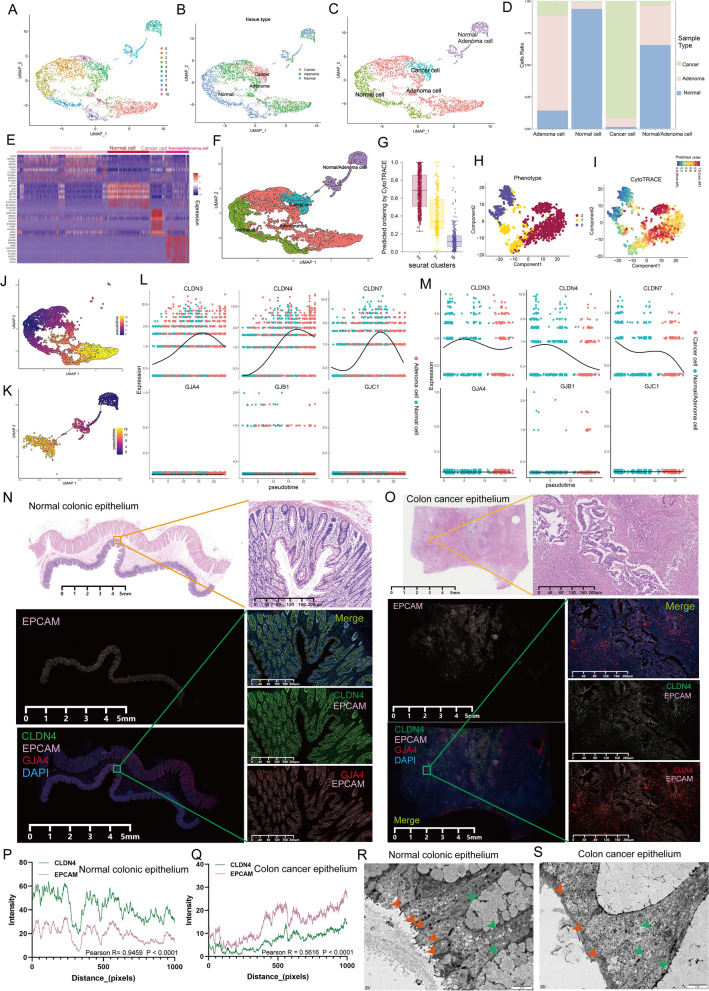
Cellular communication (CC) influences tumor development by mediating intercellular junctions between cells. However, the role and underlying mechanisms of CC in malignant transformation remain unknown. Here, we investigated the spatiotemporal heterogeneity of CC molecular expression during malignant transformation. It was found that although both tight junctions (TJs) and gap junctions (GJs) were involved in maintaining the tumor microenvironment (TME), they exhibited opposite characteristics. Mechanistically, for epithelial cells (parenchymal component), the expression of TJ molecules consistently decreased during normal-cancer transformation and is a potential oncogenic factor. For fibroblasts (mesenchymal component), the expression of GJs consistently increased during normal-cancer transformation and is a potential oncogenic factor. In addition, the molecular profiles of TJs and GJs were used to stratify colorectal cancer (CRC) patients, where subtypes characterized by high GJ levels and low TJ levels exhibited enhanced mesenchymal signals. Importantly, we propose that leiomodin 1 (LMOD1) is biphasic, with features of both TJs and GJs. LMOD1 not only promotes the activation of cancer-associated fibroblasts (CAFs) but also inhibits the Epithelial-mesenchymal transition (EMT) program in cancer cells. In conclusion, these findings demonstrate the molecular heterogeneity of CC and provide new insights into further understanding of TME heterogeneity.

Keywords: Colorectal cancer; Epithelial cells; Fibroblasts; Gap junctions; LMOD1; Tight junctions.


Conflict of interest statement

The authors declare no conflicts of interest. All authors contributed to data analysis, drafting, or revising of the article; agree on the journal to which the article is being submitted; provided final approval of the version to be published; agree to be accountable for all aspects of the work.

Figures

Fig. 1
Fig. 1
Comparison of expression levels of cell communication (CC) molecules. A Patterns mapped on the BioRender website to reveal the regulatory mechanisms of CC in tumors and their functions in the immune microenvironment of tumors. B The waterfall diagram illustrates the most frequent 47 CC molecule’s somatic mutations in The Cancer Genome Atlas (TCGA) pan-cancer data. 50.81% represents the proportion of 753 samples with at least 1 mutation of the top 10 genes among 1482 samples with at least one mutation of 47 CC genes. The percentage value on the right side of each line in the image indicates the number of samples with the specific gene mutation divided by 1,482 samples which had at least one mutation among the 47 CC genes. We label different types of CC molecules in red [gap junctions (GJs)] and blue [tight junctions (TJs)], respectively. C The dot’s color = degree of fold change. Red = high and blue = low expression in cancer tissue. Fold change = mean (tumor)/mean (normal), p-values were used. Field realistic doses (FDR) was utilized for adjusting the t-test and p-value. The size of the bubble indicates FDR; the larger the bubble, the lower the FDR. Genes with > twofold change and significance (FDR > 0.05) were used to plot graphs. If no significant genes are present in a cancer type, that cancer type was not included in the final figure. D Bubble plots display the correlation between the Copy number variant (CNV) (D) as well as DNA methylation (E) and the expression of the mRNA levels. A positive correlation is reflected in red, while a negative correlation is indicated by blue. Darker colors indicate a higher correlation index. The FDR is indicated by the bubble size. F Bubble plots showing the results of a log-rank test of the survival of 47 CC molecules in the TCGA-CRC cohort. Red represents detrimental to survival and blue denotes favorable to survival. The FDR is represented by the bubble size. G The mutation profiles of 44 CC molecules in 544 CRC patients in the TCGA-CRC cohort; co-mutations are shown by the green, mutex-mutations are indicated by the red, and asterisks indicate P values (*P < 0.05,.P < 0.01). H Mutation frequency of 47 CC molecules in 544 CRC patients in the TCGA-CRC cohort. The small graph above is the Tumor Mutational Burden (TMB), and the numbers on the right indicate the mutation frequency of each gene and provide the proportion of each variant. I, J Uniform Manifold Approximation and Projection (UMAP) (I) and violin (J) plot indicates the CC feature level (generated by the “AddModuleScore” function) across different cell types in our single cell RNA data. K Violin plot showing the CC feature level across different tissue types
Fig. 2
Fig. 2
Heterogeneous landscape of CC molecules across different lesions in epithelial cells. AC UMAP plot of all epithelial cells, color-coded for eleven seurat clusters (A), three tissue types (B), and four cell types (C). D The fraction of three tissue types in four cell types. E Heatmap showing differentially expressed genes among the four cell types (fold change > 1.5, FDR < 0.01). F The trajectories of all epithelial cells constructed by Monocle 3. Each point corresponds to a single cell and is colour coded by pseudotime. GI Box (G) and t-distributed stochastic neighbor embedding (t-SNE) (H, I) plot demonstrate the degree of differentiation of cluster 2, 7, and 8 (three normal epithelial cell clusters) assessed by CytoTRACE. JK Monocle 3 demonstrates two trajectories of cellular differentiation present in epithelial cells, including from normal cells to adenoma cells (J) and from normal/adenoma cells to cancer cells (K). L, M Two-dimensional plots showing the dynamic expression of representative CC molecules during the epithelial cell transitions during the pseudotime. N Multiplex immunofluorescence (mIF) staining images of CLDN4 (green), EPCAM (pink), and GJA4 (red) in a resected normal colon specimen (blue, DAPI), and CLDN4 (for TJs) is upregulated in epithelial cells (marked by EPCAM). Scale bars are labeled on the graph. O mIF staining images of CLDN4 (green), EPCAM (pink), and GJA4 (red) in a resected colon cancer specimen (blue, DAPI), And CLDN4 (for TJs) is downregulated in epithelial cells (marked by EPCAM). Scale bars are labeled on the graph. P, Q Co-localization was determined using the Pearson correlation coefficient in normal colon specimens (P, R = 0.9459, P < 0.0001) and colon cancer specimens (Q, R = 0.5616, P < 0.0001), respectively. The co-localization relationship between CLDN4 and EPCAM was weaker in tumor tissue compared to that of normal tissue. The X-axis represents each pixel point on the image, and the Y-axis represents the gray value corresponding to each pixel point. R, S The ultrastructure of junctions was examined using transmission electron microscope (EM) in in normal colon specimen and colon cancer specimen. Orange arrows indicate TJs and green arrows denote GJs
Fig. 3
Fig. 3
The heterogeneous landscape of CC molecules across different lesions in fibroblasts. A Circle plot showing the possible ligand-receptor pairs between fibroblasts and other type cells (predicted by CellChat). B The UMAP plot of all fibroblasts, color-coded for two seurat clusters. C, D The fraction of three tissue types in two cell types showed by histogram (C) and UMAP plot (D). E All fibroblasts were defined as Normal fibroblasts (NFs) and Cancer-associated fibroblasts (CAFs), respectively, according to tissue origin. F Heatmap showing differentially expressed genes between the two cell types (fold change > 1.5, FDR < 0.01). G, H The bubble plots indicate the up-regulated gene set in NFs (G) and CAFs (H), differently. I Trajectory of fibroblasts constructed by Monocle 3. Each point corresponds to a single cell and is colour-coded by pseudotime. J Two-dimensional plots showing the dynamic expression of representative CC molecules during the fibroblast transitions along the pseudotime. K mIF staining images of ACTA2 (pink), CLDN4 (green), and GJA4 (red) in a resected normal colon specimen (blue, DAPI), and GJA4 (for GJs) is lowly expressed in normal mesenchymal tissues (marked by ACTA2). Scale bars are labeled on the graph. L mIF staining images of CK (orange), ACTA2 (pink), CLDN4 (green), and GJA4 (red) in a resected colon cancer specimen (blue, DAPI), and GJA4 is highly expressed in cancer mesenchymal tissues (marked by ACTA2 and CK). Scale bars are labeled on the graph. M, N Co-localization was evaluates based on the Pearson correlation coefficient in normal colon specimens (M, R = 0.2692, P < 0.0001) and colon cancer specimen (N, R = 0.8806, P < 0.0001), respectively. The co-localization relationship between GJA4 and ACTA2 was stronger in tumor tissue compared to normal tissues. The X-axis represents each pixel point on the image, and the Y-axis represents the gray value corresponding to each pixel point. O, P The ultrastructure of junctions in normal colon specimens and colon cancer specimen was examined using a transmission electron microscope (EM). Orange arrows represent TJs, and green arrows represent GJs. Q, R Spatial transcription sections indicate the spatial expression of EPCAM, ACTA2, TJs markers (CLDN3/4/7), and GJs markers (GJA4, GJB1, and GJC1) in normal colonic tissue (Q) and colon cancer tissue (R). The dot color indicates the expression level of the markers. Green boxes for the parenchyma and pink boxes for the mesenchyme
Fig. 4
Fig. 4
Unsupervised Machine Learning algorithms used to identify 2 molecular subtypes in TCGA-CRC. A Heat map showing the sample clustering at K = 2 (the optimal cluster number) in TCGA-CRC. B Left: The cumulative distribution function (CDF) curve in consensus cluster analysis. The consensus score’s CDF curves with various subtype numbers (k = 2, 3, 4, 5, and 6) are shown. Right: Relative change in area under the CDF curve for k = 2–6. C The TCGA-CRC samples were classified via Principal Component Analysis (PCA) based on the CC molecules expression profile. Different colors = C1 and C2 subtypes, respectively. Each point is a single sample. D The distribution of 47 CC molecules between two subtypes in TCGA-CRC. GJs molecules are upregulated in C2 and TJs molecules are upregulated in C1. E Survival analysis in terms of Overall Survival (OS), Disease-Specific Survival (DSS), Progression-Free Survival (PFS), and Disease-Free Survival (DFS) based on 2 subtypes (TCGA-CRC, Logrank test, n = 620). F The Sankey diagram completely showing the association between the subtypes and clinicopathological attributes. G Representative images of pathological Hematoxylin–eosin (HE) staining of 2 CC phenotypes (above, scale bars = 500 μm; below, scale bars = 50 μm). C2 contained a more abundant matrix component than C1. H Violin plots showing the immune score and stromal score of different CC patterns (Wilcoxon test). I The box plot indicating the Tumor Immune Dysfunction and Exclusion (TIDE) score of different CC patterns (Wilcoxon test). J Comparison of TME infiltrating cells between the two CC phenotypes (Wilcoxon test). ****P < 0.0001, ***P < 0.001, **P < 0.01, *P < 0.05
Fig. 5
Fig. 5
Transcriptional landscape heterogeneity of LMOD1. A Two-dimensional plots illustrating the invariabilities in LMOD1 expression during the transitions (from normal cells to adenoma cells) along the pseudotime. B Two-dimensional plots showing the variations (decrease) in LMOD1 expression during the transitions (from normal/adenoma cells to cancer cells) along the pseudotime. C Two-dimensional plots indicating the variations (increase) in LMOD1 expression and fibroblasts activation markers during the transitions (from NFs to CAFs) along the pseudotime. D LMOD1 is involved in transdifferentiation from normal epithelium to colorectal cancer but not from normal epithelium to intestine adenomas (grey⊥stands for no change; purple↓stands for decrease). E, F Double immunofluorescence (dIF) staining images of EPCAM (green) and LMOD1 (red) in a resected normal colon specimen (E) and a resected colon cancer specimen (F) (blue, DAPI). LMOD1 is upregulated in normal epithelial cells but downregulate in cancer cells. Scale bars are provided on the graph. G, H Co-localization was determined using the Pearson correlation coefficient in normal colon specimen (G, R = 0.5367, P < 0.0001) and colon cancer specimen (H, R = − 0.5860, P < 0.0001), respectively. The X-axis represents each pixel point on the image, and the Y-axis represents the gray value corresponding to each pixel point. The co-localization relationship between LMOD1 and EPCAM was weaker in tumor tissue compared to that of normal tissue, just like TJs. I dIF staining images of ACTA2 (green) and LMOD1 (red) in a resected normal colon specimen (blue = DAPI), and LMOD1 downregulated in NFs. Scale bars are labelled on the graph. J mIF staining images of ACTA2 (green), LMOD1 (red), and CK (pink) in a resected colon cancer specimen (blue = DAPI), and LMOD1 is upregulated in cancer mesenchymal tissues. Scale bars are provided on the graph. K, L Co-localization was determined using the Pearson correlation coefficient in normal colon specimen (K, R = 0.7930, P < 0.0001) and colon cancer specimen (L, R = 0.9290, P < 0.0001), respectively. The co-localization relationship between LMOD1 and ACTA2 was stronger in tumor tissue compared with that in normal tissue, simile to GJs. The X-axis represents each pixel point on the image, and the Y-axis represents the gray value corresponding to each pixel point. M, N Spatial transcription sections showing the spatial expression of LMOD1 in normal colonic tissue (M) and colon cancer tissue (N). The dot color represents the expression level of the markers. Green boxes for the parenchyma and pink boxes for the mesenchyme. O LMOD1 exhibited similar behaviors as TJs during the malignant transformation of epithelial cells and to GJs in malignant transformation of fibroblasts. P Spearman correlation between LMOD1 expression and the tumor purity (left) as well as infiltration level of fibroblasts in Colon adenocarcinoma (COAD) (middle) and Rectum adenocarcinoma (READ) (right) was analyzed on TIMER 2.0 (TCGA-CRC). Q Spearman association of LMOD1 expression with stromal score (left), immune score (middle), and estimate score (right) was analyzed by “ESTIMATE” package (TCGA-CRC). R, S Spearman association of LMOD1 with fibroblast activation markers ACTA2 (R) and FAP (S) expression (TCGA-CRC). T, U Double staining technique by ACTA2 (green), and FAP (red) staining in the primary CAFs. Representative images of staining are shown. All assays were conducted thrice, independently (scale bars = 20 µm). ANOVA was applied. ****P < 0.0001
Fig. 6
Fig. 6
LMOD1/FGF1 in CAFs promotes CRC cell invasion and metastasis by regulating the EMT process. A Correlation analysis between LMOD1 and fibroblast growth factors (FGFs) based on TCGA-CRC. B Pearsons’s correlation coefficient between LMOD1 and FGF1 expression based on TCGA data. C Non-contact co-culture unit of CAFs and CRC cells for cell migration (Wound healing assay). A 1:1 ratio of the cells was employed. D, E Cell migration (Wound healing assay) in RKO and SW480 cells with the intervention of CAFs over-/under-expressing LMOD1 in the presence or absence of si-FGF1. (Scale bars = 100 μm, magnification, × 200). F The cell invasion (Transwell assay) assay for non-contact co-culture unit of CAFs and CRC cells. A 1:1 ratio of the cells was employed. G, H Cell invasion (Transwell assay) for RKO and SW480 cells with the intervention of CAFs over-/under-expressing LMOD1 in the presence or absence of si-FGF1. (Scale bars = 100 μm, magnification, × 200). I Association of LMOD1 with EMT-related genes based on TCGA-CRC. J, K The expression of EMT-associated proteins in RKO and SW480 cells as determined by western blotting (n = 3 replicates). Data are shown as mean ± SEM, ****P < 0.0001, ***P < 0.001, **P < 0.01, *P < 0.05. All assays were replicated thrice, independently
Fig. 7
Fig. 7
AKAP12/LMOD1 overexpression inhibits the malignant phenotype of CRC cells. A A volcano plot displaying the differentially expressed mRNAs in AKAP12 knockdown cells [search in genetic perturbation similarity analysis database (GPSAdb), accession: GSE147739]. LMOD1 was marked in a red box. B Association of AKAP12 expression with LMOD1 in TCGA pan-cancer. Grey = not statistically significant, Blue = negatively correlated, and Red = positively correlated. A spearman test was carried out. C Specific spearman correlation coefficients between AKAP12 and LMOD1 in TCGA-COAD (left) and TCGA-READ (right) are shown. D DEGs enrichment analysis after AKAP12 knockdown in GSE147739. The larger the circle, the higher the number of genes, and the smaller the P-values, the darker the color and the more significant the enrichment. E Gene set enrichment analysis (GSEA) plots of TGF_BETA_BETA signals were analyzed in GPSAdb (accession: GSE147739). F Association of AKAP12 expression with TGF_BETA_BETA signals level in TCGA pan-cancer. Blue = negatively correlated, Red = positively correlated, and Grey = not statistically significant. A spearman test was carried out. G, H The wound-healing assays for ROK and SW480 cells over-/under-expressing AKAP12 in the presence or absence of si-LMOD1 (Magnification, × 200, scale bars = 100 μm). I, J Transwell migration assays for ROK and SW480 cells over-/under-expressing AKAP12 in the presence or absence of si-LMOD1 (Magnification, × 200, scale bars = 100 μm). K, L The expression of proteins related to EMT in RKO and SW480 cells was determined by western blotting (n = 3 replicates). Data are presented as the mean ± SEM. ****P < 0.0001, ***P < 0.001, **P < 0.01, *P < 0.05. All assays were performed thrice, independently
Fig. 8
Fig. 8
In vivo experiment to validate the mechanism of LMOD1. A Diagram of the animal experiments. B Mouse xenograft tumors (n = 6 mice/group). C Xenograft tumor volumes. D Xenograft tumor’s weights at the end of the investigation. E mIF staining of FGF1 (green) and N-cadherin (green) proteins in mouse xenograft tumor stromal and parenchymal tissues. ACTA2 (pink), DAPI (Blue) and CK (red) for tissue-localization (Magnification, × 400, scale bars = 20 μm). F The diagram showing the procedures used in animal experiments in vivo. G Mouse xenograft tumors (n = 6 mice/group). H Xenograft tumor volumes. I Xenograft tumor’s weights at the end of the investigation. J mIF staining of N-cadherin (green) proteins in mouse xenograft tumor parenchymal tissues. DAPI (Blue) and CK (red) for tissue-localization. (Magnification, × 400, scale bars = 20 μm). K The association of LMOD1 mRNA expression with TIDE score as determined on the TCGA-CRC database (Spearman method, n = 620). LN CRC tissue’s LMOD1 proteins IHC staining (Magnification, × 400, scale bars = 20 μm). O Bar plot showing the specific response rates for the high- and low-LMOD1 average H-score groups in 40 CRC patients. P Box plot illustrating the specific LMOD1 expression (H-Score) between non-responder and responder post anti-PD-1 therapy in 40 CRC patients (Wilcoxon test, *P < 0.05). Q Representative pictures of CT scan. Primary or metastatic tumor foci measured before initiation of immunotherapy (Baseline, BL). The red arrows indicate the primary or metastatic tumor foci. PD for progressive disease (PD), PR for partial response (PR). The expression level of LMOD1 can predict immunotherapy. RT The co-stained LMOD1, CK, and CD8 images in the 3 immunophenotypes. Based on the spatial CD8 + T cells distribution, CRC tissues are categorized into 3 immunophenotypes, immune excluded, immune inflamed, and immune desert. Different sample measurements were taken. (Magnification, × 400, scale bars = 20 μm). Data are presented as the mean ± SEM ****P < 0.0001, ***P < 0.001, **P < 0.01, *P < 0.05. All experiments were repeated at least three times, independently

Similar articles

Cited by

References

    1. Dekker E, Tanis PJ, Vleugels JLA, Kasi PM, Wallace MB. Colorectal cancer. Lancet. 2019;394:1467–1480. doi: 10.1016/S0140-6736(19)32319-0. - DOI - PubMed
    1. Biller LH, Schrag D. Diagnosis and treatment of metastatic colorectal cancer: a review. JAMA. 2021;325:669–685. doi: 10.1001/jama.2021.0106. - DOI - PubMed
    1. Ganesh K, Stadler ZK, Cercek A, Mendelsohn RB, Shia J, Segal NH, et al. Immunotherapy in colorectal cancer: rationale, challenges and potential. Nat Rev Gastroenterol Hepatol. 2019;16:361–375. doi: 10.1038/s41575-019-0126-x. - DOI - PMC - PubMed
    1. Fan A, Wang B, Wang X, Nie Y, Fan D, Zhao X, et al. Immunotherapy in colorectal cancer: current achievements and future perspective. Int J Biol Sci. 2021;17:3837–3849. doi: 10.7150/ijbs.64077. - DOI - PMC - PubMed
    1. Boukouris AE, Theochari M, Stefanou D, Papalambros A, Felekouras E, Gogas H, et al. Latest evidence on immune checkpoint inhibitors in metastatic colorectal cancer: a 2022 update. Crit Rev Oncol Hematol. 2022;173:103663. doi: 10.1016/j.critrevonc.2022.103663. - DOI - PubMed

MeSH terms