

Cytoskeletal gene alterations linked to sorafenib resistance in hepatocellular carcinoma
- PMID: 38849867
- PMCID: PMC11157844
- DOI: 10.1186/s12957-024-03417-2
Cytoskeletal gene alterations linked to sorafenib resistance in hepatocellular carcinoma
Abstract
Background: Although sorafenib has been consistently used as a first-line treatment for advanced hepatocellular carcinoma (HCC), most patients will develop resistance, and the mechanism of resistance to sorafenib needs further study.
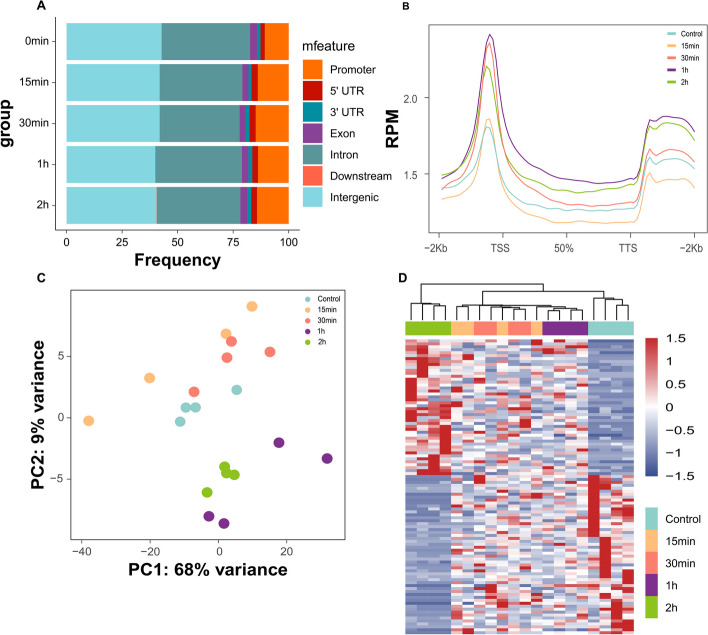
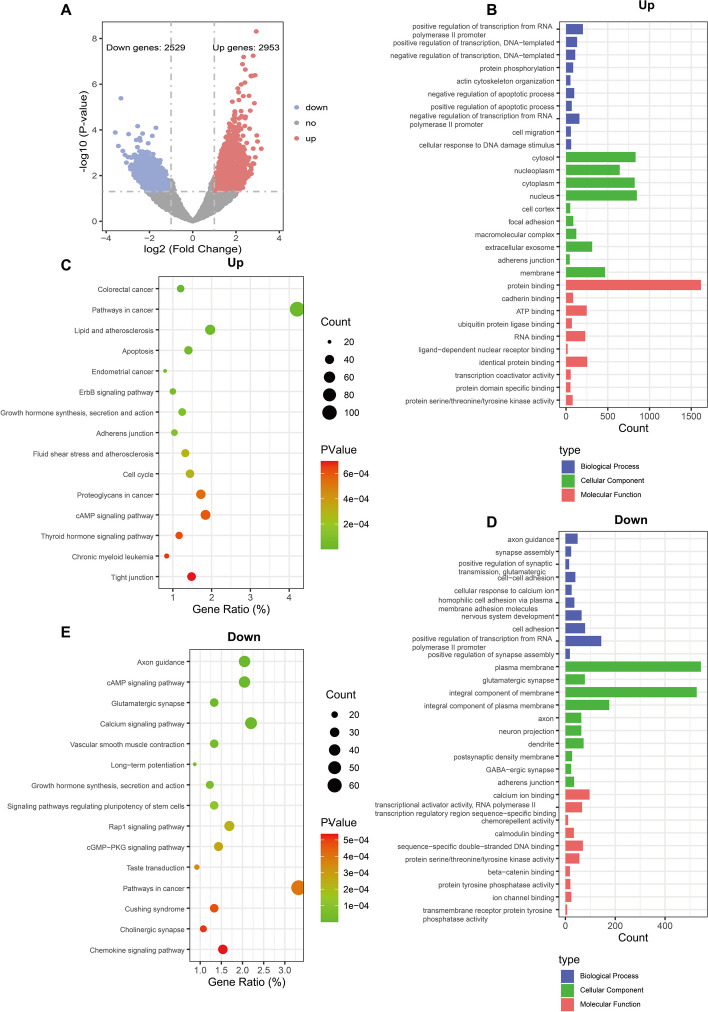
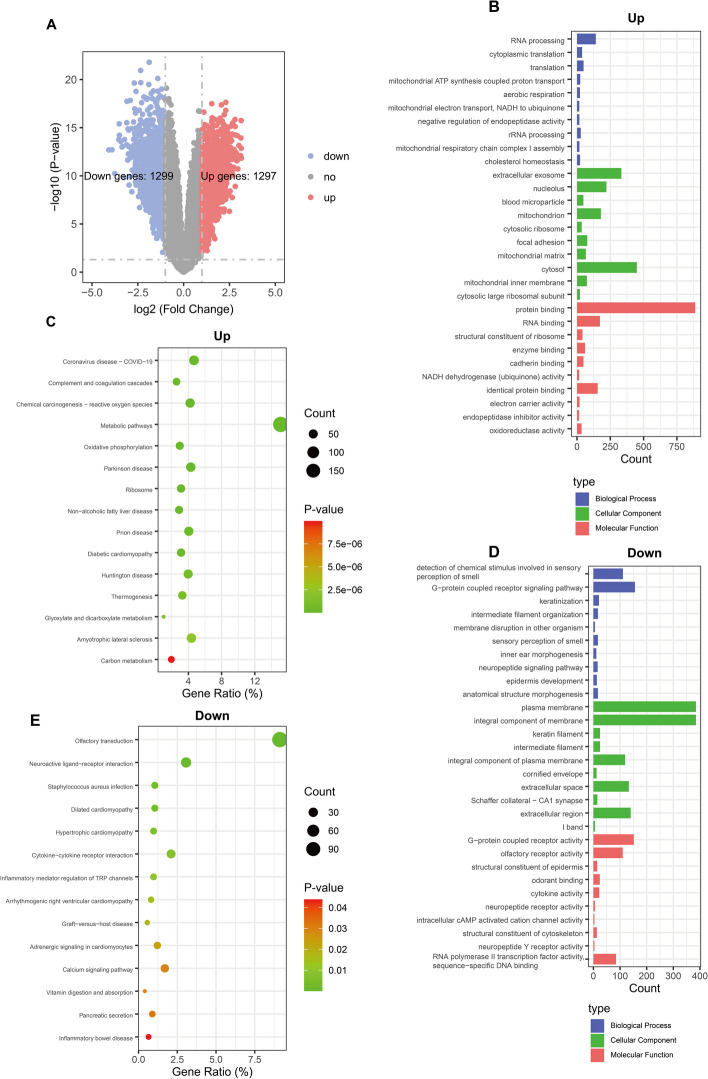
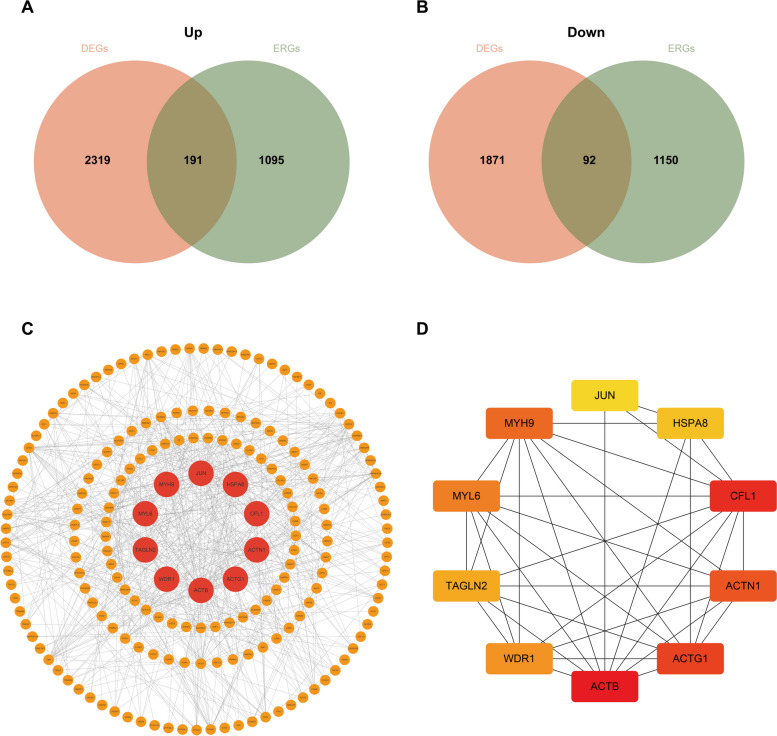
Methods: Using KAS-seq technology, we obtained the ssDNA profiles within the whole genome range of SMMC-7721 cells treated with sorafenib for differential analysis. We then intersected the differential genes obtained from the analysis of hepatocellular carcinoma patients in GSE109211 who were ineffective and effective with sorafenib treatment, constructed a PPI network, and obtained hub genes. We then analyzed the relationship between the expression of these genes and the prognosis of hepatocellular carcinoma patients.
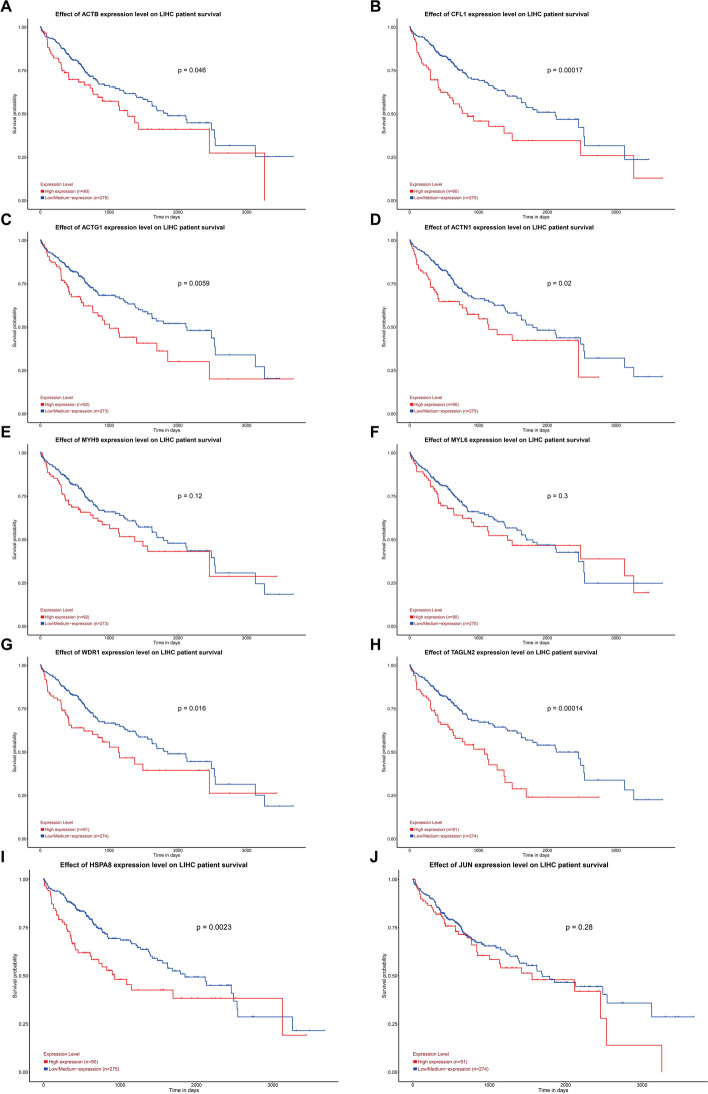
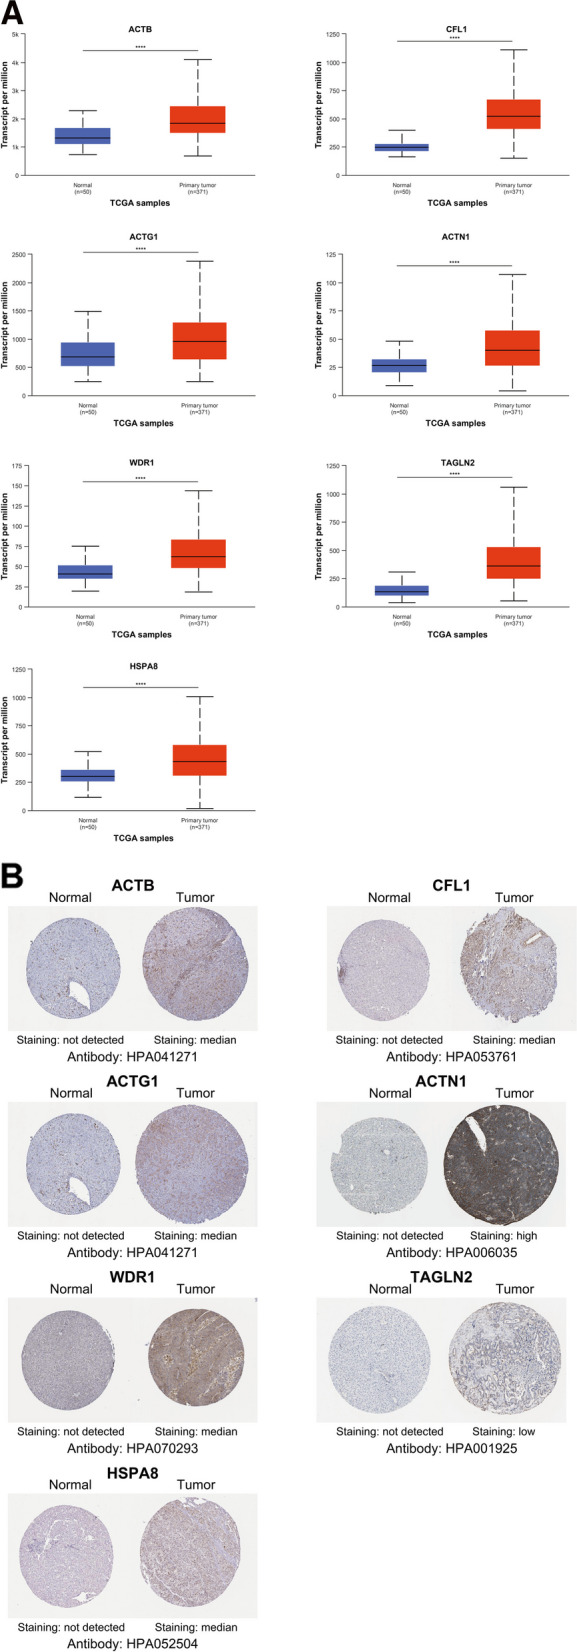
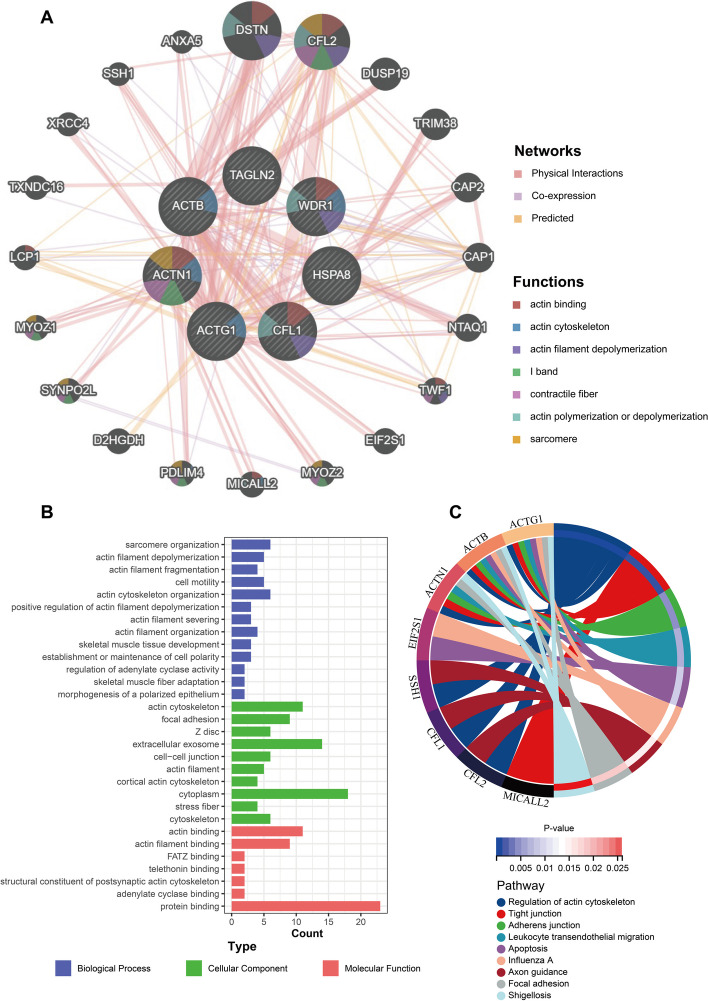
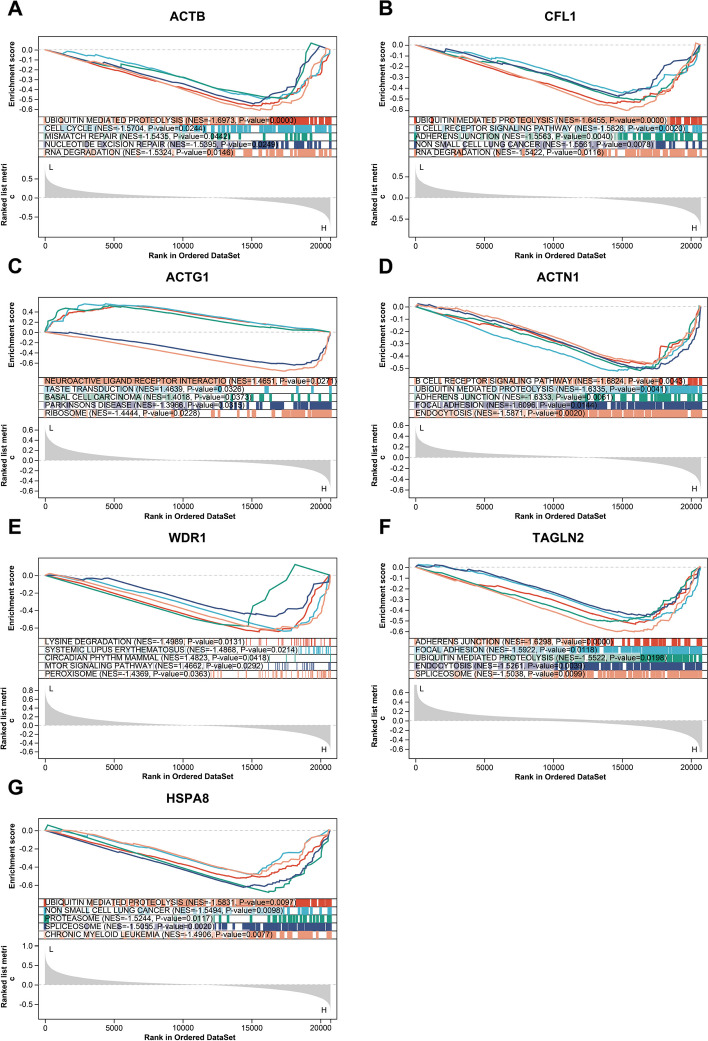
Results: In this study, we identified 7 hub ERGs (ACTB, CFL1, ACTG1, ACTN1, WDR1, TAGLN2, HSPA8) related to drug resistance, and these genes are associated with the cytoskeleton.
Conclusions: The cytoskeleton is associated with sorafenib resistance in hepatocellular carcinoma. Using KAS-seq to analyze the early changes in tumor cells treated with drugs is feasible for studying the drug resistance of tumors, which provides reference significance for future research.
Keywords: Cytoskeleton; Drug resistance; Hepatocellular carcinoma; KAS-seq; Sorafenib.
© 2024. The Author(s).
Conflict of interest statement
The authors declare no competing interests.
Figures

Similar articles
-
Integrated Transcriptomic Analysis Revealed Hub Genes and Pathways Involved in Sorafenib Resistance in Hepatocellular Carcinoma.Pathol Oncol Res. 2021 Oct 19;27:1609985. doi: 10.3389/pore.2021.1609985. eCollection 2021. Pathol Oncol Res. 2021. PMID: 34737677 Free PMC article.
-
Increased expression of SLC46A3 to oppose the progression of hepatocellular carcinoma and its effect on sorafenib therapy.Biomed Pharmacother. 2019 Jun;114:108864. doi: 10.1016/j.biopha.2019.108864. Epub 2019 Apr 10. Biomed Pharmacother. 2019. PMID: 30981107
-
SETD1A augments sorafenib primary resistance via activating YAP in hepatocellular carcinoma.Life Sci. 2020 Nov 1;260:118406. doi: 10.1016/j.lfs.2020.118406. Epub 2020 Sep 10. Life Sci. 2020. PMID: 32918976
-
Upregulation of lncRNA NIFK-AS1 in hepatocellular carcinoma by m6A methylation promotes disease progression and sorafenib resistance.Hum Cell. 2021 Nov;34(6):1800-1811. doi: 10.1007/s13577-021-00587-z. Epub 2021 Aug 10. Hum Cell. 2021. PMID: 34374933 Review.
-
Ten years of sorafenib in hepatocellular carcinoma: Are there any predictive and/or prognostic markers?World J Gastroenterol. 2018 Sep 28;24(36):4152-4163. doi: 10.3748/wjg.v24.i36.4152. World J Gastroenterol. 2018. PMID: 30271080 Free PMC article. Review.
References
-
- Wilhelm SM, Carter C, Tang L, Wilkie D, McNabola A, Rong H, Chen C, Zhang X, Vincent P, McHugh M, et al. BAY 43–9006 exhibits broad spectrum oral antitumor activity and targets the RAF/MEK/ERK pathway and receptor tyrosine kinases involved in tumor progression and angiogenesis. Cancer Res. 2004;64:7099–7109. doi: 10.1158/0008-5472.CAN-04-1443. - DOI - PubMed
-
- Liu L, Cao Y, Chen C, Zhang X, McNabola A, Wilkie D, Wilhelm S, Lynch M, Carter C. Sorafenib blocks the RAF/MEK/ERK pathway, inhibits tumor angiogenesis, and induces tumor cell apoptosis in hepatocellular carcinoma model PLC/PRF/5. Cancer Res. 2006;66:11851–11858. doi: 10.1158/0008-5472.CAN-06-1377. - DOI - PubMed
MeSH terms
Substances
Grants and funding
LinkOut - more resources
Full Text Sources
Medical
Miscellaneous
