

Identification of novel driver risk genes in CNV loci associated with neurodevelopmental disorders
- PMID: 38850022
- PMCID: PMC11264174
- DOI: 10.1016/j.xhgg.2024.100316
Identification of novel driver risk genes in CNV loci associated with neurodevelopmental disorders
Abstract
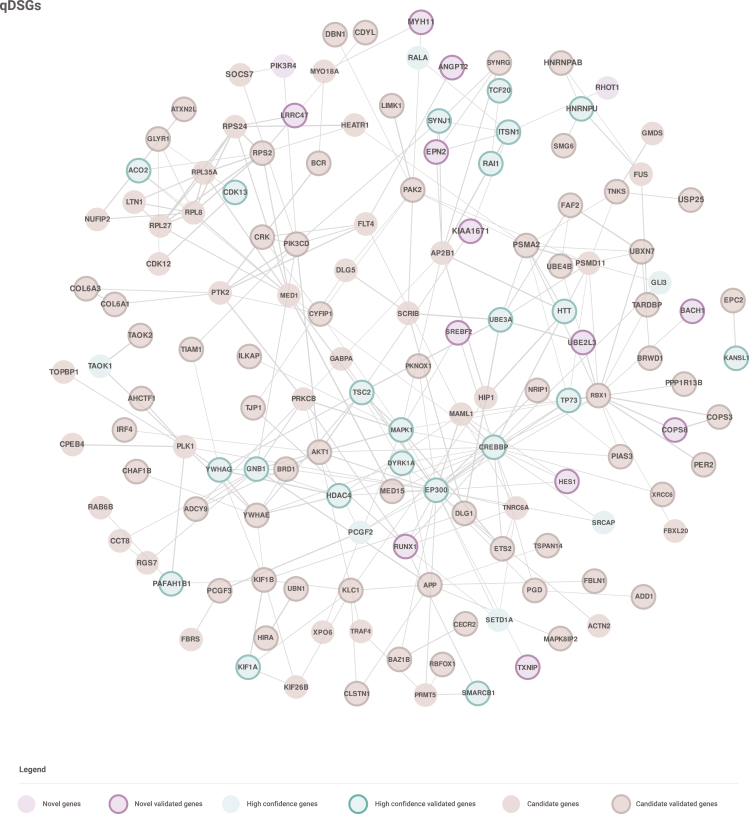
Copy-number variants (CNVs) are genome-wide structural variations involving the duplication or deletion of large nucleotide sequences. While these types of variations can be commonly found in humans, large and rare CNVs are known to contribute to the development of various neurodevelopmental disorders (NDDs), including autism spectrum disorder (ASD). Nevertheless, given that these NDD-risk CNVs cover broad regions of the genome, it is particularly challenging to pinpoint the critical gene(s) responsible for the manifestation of the phenotype. In this study, we performed a meta-analysis of CNV data from 11,614 affected individuals with NDDs and 4,031 control individuals from SFARI database to identify 41 NDD-risk CNV loci, including 24 novel regions. We also found evidence for dosage-sensitive genes within these regions being significantly enriched for known NDD-risk genes and pathways. In addition, a significant proportion of these genes was found to (1) converge in protein-protein interaction networks, (2) be among most expressed genes in the brain across all developmental stages, and (3) be hit by deletions that are significantly over-transmitted to individuals with ASD within multiplex ASD families from the iHART cohort. Finally, we conducted a burden analysis using 4,281 NDD cases from Decipher and iHART cohorts, and 2,504 neurotypical control individuals from 1000 Genomes and iHART, which resulted in the validation of the association of 162 dosage-sensitive genes driving risk for NDDs, including 22 novel NDD-risk genes. Importantly, most NDD-risk CNV loci entail multiple NDD-risk genes in agreement with a polygenic model associated with the majority of NDD cases.
Keywords: Copy number variants; Decipher database; SFARI database; autism spectrum disorder; burden testing; dosage-sensitive genes; iHART cohort; neurodevelopmental disorders; risk genes and pathways; structural variants.
Copyright © 2024 The Authors. Published by Elsevier Inc. All rights reserved.
Conflict of interest statement
Declaration of interests S.A.C., X.G., L.P.-C., E.G., and L.D. are STALICLA employees, a company advancing treatment candidates for subgroups of affected individuals with NDDs.
Figures


Similar articles
-
Phenotypic and genetic analysis of children with unexplained neurodevelopmental delay and neurodevelopmental comorbidities in a Chinese cohort using trio-based whole-exome sequencing.Orphanet J Rare Dis. 2024 May 19;19(1):205. doi: 10.1186/s13023-024-03214-w. Orphanet J Rare Dis. 2024. PMID: 38764027 Free PMC article.
-
Rare recurrent copy number variations in metabotropic glutamate receptor interacting genes in children with neurodevelopmental disorders.J Neurodev Disord. 2023 Apr 29;15(1):14. doi: 10.1186/s11689-023-09483-z. J Neurodev Disord. 2023. PMID: 37120522 Free PMC article.
-
Clinical Characterization of Copy Number Variants Associated With Neurodevelopmental Disorders in a Large-scale Multiancestry Biobank.JAMA Psychiatry. 2022 Mar 1;79(3):250-259. doi: 10.1001/jamapsychiatry.2021.4080. JAMA Psychiatry. 2022. PMID: 35080590 Free PMC article.
-
A critical review of the impact of candidate copy number variants on autism spectrum disorder.Mutat Res Rev Mutat Res. 2024 Jul-Dec;794:108509. doi: 10.1016/j.mrrev.2024.108509. Epub 2024 Jul 6. Mutat Res Rev Mutat Res. 2024. PMID: 38977176 Review.
-
How does genetic variation modify ND-CNV phenotypes?Trends Genet. 2022 Feb;38(2):140-151. doi: 10.1016/j.tig.2021.07.006. Epub 2021 Aug 4. Trends Genet. 2022. PMID: 34364706 Review.
Cited by
-
Heterozygous deletion of 10q24.31-q24.33- a new syndrome associated with multiple congenital anomalies: case report and literature review.Neurol Res Pract. 2025 Apr 7;7(1):22. doi: 10.1186/s42466-025-00378-z. Neurol Res Pract. 2025. PMID: 40189573 Free PMC article.
-
Elucidating neuroepigenetic mechanisms to inform targeted therapeutics for brain disorders.iScience. 2025 Feb 22;28(3):112092. doi: 10.1016/j.isci.2025.112092. eCollection 2025 Mar 21. iScience. 2025. PMID: 40160416 Free PMC article. Review.
-
Assessment of Brain Morphological Abnormalities and Neurodevelopmental Risk Copy Number Variants in Individuals from the UK Biobank.Int J Mol Sci. 2025 Jul 22;26(15):7062. doi: 10.3390/ijms26157062. Int J Mol Sci. 2025. PMID: 40806190 Free PMC article.
References
-
- Shishido E., Aleksic B., Ozaki N. Copy-number variation in the pathogenesis of autism spectrum disorder. Psychiatry Clin. Neurosci. 2014;68:85–95. - PubMed
-
- Barone J., Smith M., Kendall K., Owen M., O’Donovan M., Kirov G. 2019. The rate of de novo CNVs in healthy controls.
Publication types
MeSH terms
LinkOut - more resources
Full Text Sources
Medical
