. 2024 Nov 25;120(14):1737-1751.
doi: 10.1093/cvr/cvae128.

Daily oral administration of probiotics engineered to constantly secrete short-chain fatty acids effectively prevents myocardial injury from subsequent ischaemic heart disease

Affiliations

Daily oral administration of probiotics engineered to constantly secrete short-chain fatty acids effectively prevents myocardial injury from subsequent ischaemic heart disease

Quynh Hoa Pham et al. Cardiovasc Res. .

Abstract

Aims: Given the extremely limited regeneration potential of the heart, one of the most effective strategies to reduce the prevalence and mortality of coronary artery disease is prevention. Short-chain fatty acids (SCFAs), which are by-products of beneficial probiotics, have been reported to possess cardioprotective effects. Despite their beneficial roles, delivering SCFAs and maintaining their effective concentration in plasma present major challenges. Therefore, in the present study, we aimed to devise a strategy to prevent coronary heart disease effectively by using engineered probiotics to continuously release SCFAs in vivo.

Methods and results: We engineered a novel probiotic cocktail, namely EcN_TL, from the commercially available Escherichia coli Nissle 1917 (EcN) strain to continuously secrete SCFAs by introducing the propionate and butyrate biosynthetic pathways. Oral administration of EcN_TL enhanced and maintained an effective concentration of SCFAs in the plasma. As a preventative strategy, we observed that daily intake of EcN_TL for 14 days prior to ischaemia-reperfusion injury significantly reduced myocardial injury and improved cardiac performance compared with EcN administration. We uncovered that EcN_TL's protective mechanisms included reducing neutrophil infiltration into the infarct site and promoting the polarization of wound healing macrophages. We further revealed that SCFAs at plasma concentration protected cardiomyocytes from inflammation by suppressing the NF-κB activation pathway.

Conclusion: These data provide strong evidence to support the use of SCFA-secreting probiotics to prevent coronary heart disease. Since SCFAs also play a key role in other metabolic diseases, EcN_TL can potentially be used to treat a variety of other diseases.

Keywords: Coronary heart disease; Myocardial infarction; Prevention; Probiotics; Short-chain fatty acid.


Conflict of interest statement

Conflict of interest: none declared.

Figures

Graphical Abstract
Graphical Abstract
Schematic diagram showing the therapeutic effect of engineer probiotic EcN_TL for myocardial infarction.
Figure 1
Figure 1
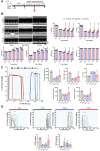
Generation of engineered EcN producing propionate and butyrate. (A) The major metabolic pathways and metabolic engineering strategies employed to develop two engineered EcN TLP and TLB strains. In the diagrams, ldhA, cspA, cspB, cspC, and atoB are endogenous genes. Hbd, crt, etfAB, bcd, ptb, and buk are exogenous genes. Black crosses indicate deleted genes. The genes were arranged as operons on plasmids carrying the stability system hok/sok. (B) Measurement of SCFAs in the culture medium of EcN-WT, TLP, and TLB was performed by using GC-MS analysis. Six single, fresh colonies on agar plates were inoculated into LB medium and cultured overnight at 37°C. The starter was then inoculated at a ratio of 1:100 into fresh BHI medium and cultured anaerobically. The medium was collected after 28 h for GC-MS analysis. The data are represented as mean ± SEM. n = 6 biologically independent samples per group. The data are represented as mean ± SEM. ****P < 0.0001 compared with EcN-WT. One-way ANOVA was used for statistical analyses. (C) Growth of EcN-WT, TLP, and TLB in BHI medium in aerobic conditions (37°C, shaking) and anaerobic conditions (37°C, anaerobic jar). Bacteria from a single colony of each strain were cultured under the indicated conditions, and growth was measured by OD at 600 nm. No statistically significant differences were detected. (D) Virulence assessment of the engineered E. coli in adhesion and invasion into intestinal Caco-2 cells. An invasive enterohaemorrhagic E. coli served as a positive control. The data are represented as mean ± SEM. ***P < 0.001 compared with EcN-WT. n = 6 biologically independent samples per group. One-way ANOVA was used for statistical analyses. ldhA, lactate dehydrogenase A; cspA, methylmalonyl-CoA mutase; cspB, methylmalonyl-CoA decarboxylase; cspC, propionyl-CoA::succinate transferase; argK, arginine kinase; atoB, acetyl-CoA acetyltransferase; BHBD, β-hydroxybutyryl-CoA dehydrogenase; crt, crotonase; etfAB, quinone oxidoreductases; bcd, butyryl-CoA dehydrogenase; ptb, phosphotransbutyrylase; buk, butyrate kinase; ns, not statistically significant.
Figure 2
Figure 2
EcN_TL formula improved SCFA level in vivo. (A) Residence of bacteria in mouse gut visualized by luminescent intensity from the whole animal after antibiotic pre-treatment followed by daily administration of EcN_EV (EcN:ΔldhA is carrying empty vector) and EcN_TL (mixture of TLP and TLB in ratio 1:1). The mice were pre-treated with an antibiotic cocktail (vancomycin 0.125 g/L, neomycin 0.25 g/L, ampicillin 0.25 g/L, and metronidazole 0.25 g/L) in drinking water for 1 week (ABX). After 14 daily doses of probiotics (109 cfu/dose), the mice were sacrificed. The plasma and cecum were collected for SCFA measurements by GC-MS. (B) SCFA concentrations in plasma and cecum. Graphs represent changes in individual SCFAs (acetate, propionate, and butyrate). The data are represented as mean ± SEM. **P < 0.01 compared with PBS control group; n = 5 biologically independent samples per group. One-way ANOVA was used for statistical analyses.
Figure 3
Figure 3
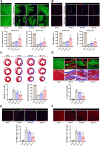
Effect of EcN_TL on improving cardiac function after MI. (A) Schematic of EcN_TL administration in animals. (B) Representative images M-mode of three groups at 1 and 4 weeks post-I/R and the measurement of LV EF, left FS, LV internal diameter at end-diastole (LVIDd), LV internal diameter at end-systole (LVIDs), septal wall thickness (SWT), and posterior wall thickness (PWT). The data are represented as mean ± SEM. *P < 0.05 vs. control. P < 0.05 vs. EcN_EV. n = 7. The experiment was performed with seven animals for each group. Statistical differences between three groups were examined by two-way ANOVA followed by Bonferroni’s post hoc analysis (*P < 0.05 vs. control. P < 0.05 vs. EcN_EV). (C) Representative images of the haemodynamic PV curve on steady state at 4 weeks post-I/R injury and the measurement of cardiac output, stroke volume, volume max (Vmax) at end-diastole, maximal rate of pressure changes during systole (dP/dtmax), and minimal rate of pressure changes during diastole (dP/dtmin). The data are represented as mean ± SEM. *P < 0.05 vs. control. P < 0.05 vs. EcN_EV. n = 5 biologically independent animals per group. One-way ANOVA was used for statistical analyses. (D) The slope of ESPVR indicating the intrinsic cardiac contractibility as measured by transient inferior vena cava (IVC) occlusion. Slope of EDPVR. In C and D, the experiment was performed with five animals for each group. Data are shown as the mean ± SEM. Statistical differences between three groups were examined by one-way ANOVA followed by Bonferroni’s post hoc analysis (*P < 0.05 vs. control. <0.05 vs. EcN_EV).
Figure 4
Figure 4
The effect of EcN_TL on improving the microenvironment of the damaged heart. (A) Representative images of cardiomyocytes stained with cTnT (green) on the infarct zone and border zone at 4 weeks and the quantification summary. n = 5. Scale bars: 100 µm. (B) Representative images of capillaries stained with CD31 (red) on the infarct zone and border zone at 4 weeks and the quantification summary. n = 5. Scale bars: 100 µm. (C) Representative images of Masson’s trichrome staining at 4 weeks and quantification summary of a percentage of fibrosis and viable myocardium. n = 5. Scale bars: 2000 µm. (D) Representative images of denatured collagen stained with CHP (red) and cardiomyocytes (green) on the infarct zone at 4 weeks and the quantification summary. n = 5. Scale bars: 100 µm. In AD, the experiment was performed with five heart tissue for each group. Data are shown as the mean ± SEM. Statistical differences between three groups were examined by one-way ANOVA followed by Bonferroni’s post hoc analysis (*P < 0.05 vs. control. P < 0.05 vs. EcN_EV). (E) Representative images of apoptotic CMs in infarct zone 3 days after MI induction and quantification summary. TUNEL (green), cTnT (red), and DAPI (blue). n = 6. Scale bars: 100 µm. (F) Representative images of apoptotic ECs in infarct zone 3 days after MI induction and quantification summary. TUNEL (green), CD31 (red), and DAPI (blue). n = 6. Scale bars: 100 µm. In E and F, the experiment was performed with six heart tissues for each group. Data are shown as the mean ± SEM. Statistical differences between three groups were examined by one-way ANOVA followed by Bonferroni’s post hoc analysis (*P < 0.05 vs. control. P < 0.05 vs. EcN_EV).
Figure 5
Figure 5
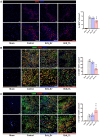
Inhibition of acute inflammatory reactions of EcN_TL. (A) Representative images of neutrophils stained with MPO in the infarct zone 3 days after MI induction and the quantification summary. MPO (red) and DAPI (blue). n = 6. Scale bars: 50 µm. (B) Representative images of M1 macrophages in the infarct zone 3 days after MI induction and the quantification summary. CD68 (green), iNOS (red), and DAPI (blue). n = 6. Scale bars: 50 µm. (C) Representative images of M2 macrophages in infarct zone 3 days after MI induction and quantification summary. CD68 (green), CD206 (red), and DAPI (blue). n = 6. Scale bars: 50 µm. In AC, the experiment was performed with six heart tissues for each group. Data are shown as the mean ± SEM. Statistical differences between three groups were examined by one-way ANOVA followed by Bonferroni’s post hoc analysis. *P < 0.05 vs. control. P < 0.05 vs. EcN_EV.
Figure 6
Figure 6
SCFAs protect cardiomyocytes during inflammation. (A and B) Combination of SCFAs improves cardiomyocyte survival under inflammatory injury. Cardiomyocytes were incubated with individual SCFAs in which acetate, propionate, and butyrate are indicated as A, P, and B in the graph, respectively (A) and mixture on SCFAs (500 μM acetate, 15 μM propionate, and 5 μM butyrate), which is indicated as SCFAs in the graph (B) for 18 h followed with a treatment of 10μg/mL LPS for 16 h. Cell survival was determined by the Cell Counting Kit-8 assay. Data are shown as the mean ± SEM. *P < 0.05. n = 3 biologically independent samples per group. One-way ANOVA was used for statistical analyses. (C) qPCR of pro-inflammatory cytokine and anti-inflammatory cytokine gene expression in cardiomyocytes during inflammation triggered by LPS. Cardiomyocytes were incubated with the mixture of SCFAs (500 µM acetate, 15 µM propionate, and 5 µM butyrate) for 18 h followed by a treatment of 10 µg/mL LPS for 15 min. Data are shown as the mean ± SEM. *P < 0.05. n = 3 biologically independent samples per group. One-way ANOVA was used for statistical analyses. (D) SCFA treatment inhibits phosphorylation of NF-κB and IκBα in cardiomyocytes. The level of total NF-κB P65, S536 phosphorylated P65, and IκBαS36 phosphorylated IκBα was detected by western blot. The total protein served as a loading control. (E) SCFA treatment inhibits phosphorylation of IKKα/β in cardiomyocytes. The level of S176/180 phosphorylated IKKα/β and total IKKα were detected by western blot. The GAPDH protein served as a loading control. The western blot was performed with four replications and a representative image was shown. The abundance of protein was determined from the band intensity using ImageJ software, normalized relative to the GAPDH protein control and plot to the bar graph. Data are shown as the mean ± SEM. *P < 0.05. n = 4. Statistical differences between the two groups were examined by unpaired Student’s t-test. (F) SCFA acted as NF-κB inhibitors. When IKK2 (an inhibitor of NF-κB) was added, SCFA lost the protective effects on cardiomyocytes under inflammation injury. Cell survival was determined by the Cell Counting Kit-8 assay. Statistical differences between the two groups were examined by unpaired Student’s t-test. *P < 0.05. n = 4. (G and H) SCFAs entered cardiomyocytes through MCT1. (G) Immunocytochemistry of cardiomyocytes stained with MCT1. MCT1 expression (red) can be detected on the cell membrane. Cytoplasm and nucleus were stained by troponin T TNNT (green) and DAPI (blue). (H) An MCT1 inhibitor, syrosingopine, abolishes SCFA protection effect. The SCFA and LPS treatment was similar to survival assay. Syrosingopine was added along with SCFAs. *P < 0.05. n = 4 for non-treated control and n = 3 for other groups. One-way ANOVA was used for statistical analyses.
Figure 7
Figure 7
Effect of SCFAs on innate immune cells. (A and B) SCFAs drive anti-inflammatory properties in macrophages under both M1 and M2 polarizations. Measurement of cytokine production at mRNA level by qPCR for THP-1-derived M0 macrophages polarized into M1 or M2 macrophage phenotype in the presence and absence of SCFAs. Non-polarized M0 macrophages were used as the baseline control. (A) Pro-inflammatory cytokines TNFα and IL-1β were down-regulated in the presence of SCFAs under M1 condition. (B) Anti-inflammatory cytokine IL1RA and wound healing extracellular matrix FN were up-regulated by SCFAs under M2 condition. Data are shown as the mean ± SEM. *P < 0.05. n = 3 biologically independent samples per group. One-way ANOVA was used for statistical analyses. (C and D) Cytokine array for supernatant in macrophage culture showing log2 fold changes on secreted cytokines in M1 (C) and M2 (D) macrophages in the presence of SCFAs to that of M1 and M2 only controls without SCFAs. (E) SCFAs inhibit neutrophil migration. Migration assay for neutrophils in the presence of SCFAs and/or chemoattractant IL-8 in the transwell system. The freshly isolated neutrophils from blood were maintained in 1640 medium with 10% FBS and 5 × 10⁵ neutrophils were added to the upper compartment in a 24-well plate. IL-8 (10 ng/mL) was used as the chemoattractant (positive control). Mixed SCFAs (500 μM acetate, 15 μM propionate, and 5 μM butyrate) were used in this assay. Migrated neutrophils were quantified through cell lysis and detection using Cy-QUANT dye (DNA dye) by quantifying endpoint fluorescent intensities for all replicates. Data are shown as the mean ± SEM. *P < 0.05. n = 7 biologically independent samples per group. One-way ANOVA was used for statistical analyses.

References

    1. Lopez AD, Mathers CD, Ezzati M, Jamison DT, Murray CJ. Global and regional burden of disease and risk factors, 2001: systematic analysis of population health data. Lancet 2006;367:1747–1757. - PubMed
    1. Tsao CW, Aday AW, Almarzooq ZI, Alonso A, Beaton AZ, Bittencourt MS, Boehme AK, Buxton AE, Carson AP, Commodore-Mensah Y, Elkind MSV, Evenson KR, Eze-Nliam C, Ferguson JF, Generoso G, Ho JE, Kalani R, Khan SS, Kissela BM, Knutson KL, Levine DA, Lewis TT, Liu J, Loop MS, Ma J, Mussolino ME, Navaneethan SD, Perak AM, Poudel R, Rezk-Hanna M, Roth GA, Schroeder EB, Shah SH, Thacker EL, VanWagner LB, Virani SS, Voecks JH, Wang NY, Yaffe K, Martin SS. Heart Disease and Stroke Statistics—2022 update: a report from the American Heart Association. Circulation 2022;145:e153–e639. - PubMed
    1. Gan XT, Ettinger G, Huang CX, Burton JP, Haist JV, Rajapurohitam V, Sidaway JE, Martin G, Gloor GB, Swann JR, Reid G, Karmazyn M. Probiotic administration attenuates myocardial hypertrophy and heart failure after myocardial infarction in the rat. Circ Heart Fail 2014;7:491–499. - PubMed
    1. O'Keefe SJ. Diet, microorganisms and their metabolites, and colon cancer. Nat Rev Gastroenterol Hepatol 2016;13:691 706. - PMC - PubMed
    1. Tang WHW, Li DY, Hazen SL. Dietary metabolism, the gut microbiome, and heart failure. Nat Rev Cardiol 2019;16:137–154. - PMC - PubMed

Publication types

MeSH terms