. 2024 Dec;602(23):6373-6402.
doi: 10.1113/JP285585. Epub 2024 Jun 8.

More than the clock: distinct regulation of muscle function and metabolism by PER2 and RORα

Affiliations

More than the clock: distinct regulation of muscle function and metabolism by PER2 and RORα

Shivani Mansingh et al. J Physiol. 2024 Dec.

Abstract

Circadian rhythms, governed by the dominant central clock, in addition to various peripheral clocks, regulate almost all biological processes, including sleep-wake cycles, hormone secretion and metabolism. In certain contexts, the regulation and function of the peripheral oscillations can be decoupled from the central clock. However, the specific mechanisms underlying muscle-intrinsic clock-dependent modulation of muscle function and metabolism remain unclear. We investigated the outcome of perturbations of the primary and secondary feedback loops of the molecular clock in skeletal muscle by specific gene ablation of Period circadian regulator 2 (Per2) and RAR-related orphan receptor alpha (Rorα), respectively. In both models, a dampening of core clock gene oscillation was observed, while the phase was preserved. Moreover, both loops seem to be involved in the homeostasis of amine groups. Highly divergent outcomes were seen for overall muscle gene expression, primarily affecting circadian rhythmicity in the PER2 knockouts and non-oscillating genes in the RORα knockouts, leading to distinct outcomes in terms of metabolome and phenotype. These results highlight the entanglement of the molecular clock and muscle plasticity and allude to specific functions of different clock components, i.e. the primary and secondary feedback loops, in this context. The reciprocal interaction between muscle contractility and circadian clocks might therefore be instrumental to determining a finely tuned adaptation of muscle tissue to perturbations in health and disease. KEY POINTS: Specific perturbations of the primary and secondary feedback loop of the molecular clock result in specific outcomes on muscle metabolism and function. Ablation of Per2 (primary loop) or Rorα (secondary loop) blunts the amplitude of core clock genes, in absence of a shift in phase. Perturbation of the primary feedback loop by deletion of PER2 primarily affects muscle gene oscillation. Knockout of RORα and the ensuing modulation of the secondary loop results in the aberrant expression of a large number of non-clock genes and proteins. The deletion of PER2 and RORα affects muscle metabolism and contractile function in a circadian manner, highlighting the central role of the molecular clock in modulating muscle plasticity.

Keywords: PER2; RORα; circadian rhythm; exercise; metabolism; molecular clock; skeletal muscle; transcriptional regulation.


Conflict of interest statement

None declared.

Figures
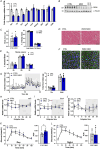
Figure 1
Figure 1. Validation of PER2 deletion in skeletal muscle and characterization of physiological parameters
A, quantitative PCR (qPCR) analysis showing the fold change of Per2 mRNA in PER2 muscle‐specific knockout (MKO) mice relative to control littermates (CTRL). B, western blot confirming the deletion of PER2 protein in the gastrocnemius muscle of PER2 MKO mice. C, comparison of absolute body mass, lean mass and fat mass percentages between PER2 MKO and CTRL. D, Haematoxylin and Eosin staining of skeletal muscle sections from PER2 MKO and control mice. Scale bars: 50 μm. E, quantification of fibre types in MKO and control mice from immunofluorescence image analysis of muscle sections. F, representative immunofluorescence images of muscle sections. Scale bar: 100 μm. G, comparison of total food intake per hour over a period of 24 h in ad libitum feeding conditions. The bar graph shows the total food intake from 0 to 12 h (day) and 12 to 24 h (night). H, mRNA levels of insulin receptor (InsR) measured by qPCR in the gastrocnemius muscle over 4 h intervals. I, mRNA levels of glucose transporter (Glut4) measured by qPCR in the gastrocnemius muscle over 4 h intervals. J, muscle glycogen concentration (in milligrams per gram) in the gastrocnemius muscle over 4 h intervals. K and L, blood glucose levels (in millimoles per litre) measured every 15 min after i.p. glucose injection, at ZT4 (day; K) and ZT16 (night; L). The bar graphs show the area under the curve over the 3 h (120 min) period. Light and dark periods are depicted by white and grey background, respectively. Abbreviations: BAT, adipose tissue; CB, cerebellum; Dia, diaphragm; Gas, gastrocnemius; Plan, plantaris; Sol, soleus; TA, tibialis anterior; WAT, white adipose tissue. n = 4 per genotype for A and B; n = 7 or 8 per genotype for C–G. Results are expressed as the mean ± SD; bar graphs show individual data points. *q < 0.05, **q < 0.01 and ***q < 0.001; Student's unpaired t test or two‐way ANOVA with Sidak's multiple comparisons test. [Colour figure can be viewed at wileyonlinelibrary.com]
Figure 2
Figure 2. Characterization of functional and metabolic parameters in PER2 muscle‐specific knockout mice
A, voluntary locomotor activity of control and PER2 muscle‐specific knockout (MKO) mice measured over 4 days and averaged over a 24 h period in arbitrary units (a.u.). The bar graph shows the average from 0 to 12 h (day) and 12–24 h (night). B, maximal treadmill running capacity of control and PER2 MKO mice assessed at zeitgeber time 4 (ZT4, daytime) and zeitgeber time 20 (ZT20, night‐time). C, core body temperature measured over 4 days and averaged over a 24 h period. The bar graph shows the average from 0 to 12 h (day) and 12 to 24 h (night). D, respiratory exchange ratio (RER) measured over 48 h. The bar graph shows the average over 12 h periods. E, rate of volume of oxygen consumption (V˙O2) measured over 48 h. The bar graph shows the averaged values over 12 h periods. F, energy expenditure (in kilocalories per minute) measured over 48 h. The bar graph shows the average over 12 h periods. Light and dark periods are depicted by white and grey background, respectively. n = 7 or 8 per genotype for A–E. Results are expressed as the mean ± SD; bar graphs show individual data points. *q < 0.05, **q < 0.01; Student's unpaired t test or two‐way ANOVA with Sidak's multiple comparisons test. [Colour figure can be viewed at wileyonlinelibrary.com]
Figure 3
Figure 3. Validation of RORα deletion in skeletal muscle and characterization of physiological parameters
A, quantitative PCR (qPCR) analysis showing the fold change of Rorα mRNA in RORα muscle‐specific knockout (MKO) mice relative to control littermates (CTRL). B, western blot confirming the deletion of RORα protein in the gastrocnemius muscle. C, comparison of absolute body mass, lean mass and fat mass percentages between RORα MKO and CTRL. D, Haematoxylin and Eosin staining of skeletal muscle sections from MKO and control mice. Scale bars: 50 μm. E, quantification of fibre types in RORα MKO and control mice from immunofluorescence image analysis of muscle sections. F, representative immunofluorescence images of muscle sections. Scale bars: 300 μm. G, comparison of total food intake per hour over a period of 24 h in ad libitum feeding conditions. The bar graph shows the total food intake from 0 to 12 h (day) and 12 to 24 h (night). H, mRNA levels of insulin receptor (InsR) measured by qPCR in the gastrocnemius muscle over 4 h intervals. I, mRNA levels of glucose transporter (Glut4) measured by qPCR in the gastrocnemius muscle over 4 h intervals. J, muscle glycogen concentration (in milligrams per gram) in the gastrocnemius muscle over 4 h intervals. K and L, blood glucose levels (in millimoles per litre) measured every 15 min after i.p. glucose injection, at zeitgeber time 4 (ZT4; daytime, K) and zeitgeber time 16 (ZT16; night‐time, L). The bar graphs show the area under the curve over a 3 h (120 min) period. Light and dark periods are depicted by white and grey background, respectively. Abbreviations: BAT, adipose tissue; CB, cerebellum; Dia, diaphragm; Gas, gastrocnemius; Plan, plantaris; Sol, soleus; TA, tibialis anterior; WAT, white adipose tissue. n = 4 per genotype for A and B; n = 7 or 8 per genotype for C–G. Results are expressed as the mean ± SD; bar graphs show individual data points. *q < 0.05, **q < 0.01 and ***q < 0.001; Student's unpaired t test or two‐way ANOVA with Sidak's multiple comparisons test. [Colour figure can be viewed at wileyonlinelibrary.com]
Figure 4
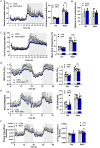
Figure 4. Characterization of functional and metabolic parameters in RORα muscle‐specific knockout mice
A, voluntary locomotor activity of control and RORα muscle‐specific knockout (MKO) mice measured over 4 days and averaged over 24 h. The bar graph shows the average from 0 to 12 h (day) and 12 to 24 h (night). B, maximal treadmill running capacity of control and RORα MKO mice assessed at zeitgeber time 4 (ZT4, daytime) and zeitgeber time 20 (ZT20, night‐time). C, core body temperature measured over 4 days and averaged over 24 h. The bar graph shows the average from 0 to 12 h (day) and 12 to 24 h (night). D, respiratory exchange ratio (RER) measured over 48 h. The bar graph shows the average over 12 h periods. E, oxygen consumption (V˙O2) measured over 48 h. The bar graph shows the average over 12 h periods. F, energy expenditure (in kilocalories per minute) measured over 48 h. The bar graph shows the average over 12 h periods. Light and dark periods are depicted by white and grey backgrounds, respectively. n = 7 or 8 per genotype for A–E. Results are expressed as the mean ± SD; bar graphs show individual data points. *q < 0.05, **q < 0.01; Student's unpaired t test or two‐way ANOVA with Sidak's multiple comparisons test. [Colour figure can be viewed at wileyonlinelibrary.com]
Figure 5
Figure 5. Effect of PER2 and RORα deletion on core cock gene expression and oscillation in skeletal muscle
A, core clock gene expression in PER2 muscle‐specific knockout (MKO) mice: qPCR of core clock‐regulating genes in skeletal muscle of PER2 MKO and control mice (CTRL). B, core clock gene expression in RORα MKO mice: qPCR of core clock‐regulating genes in skeletal muscle of RORα MKO and CTRL. Light and dark periods are depicted by white and grey backgrounds, respectively. Data are shown as the mean fold change ± SD; bar graphs show individual data points (n = 4) relative to the expression in CTRL, zeitgeber time 0 (ZT0) set to one. *q < 0.05, **q < 0.01, ***q < 0.001 and ****q < 0.0001; two‐way ANOVA with Sidak's multiple comparisons test or Student's unpaired t test. [Colour figure can be viewed at wileyonlinelibrary.com]
Figure 6
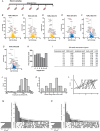
Figure 6. Time of day‐specific transcriptional response to PER2 deletion in skeletal muscle
A, schematic diagram of muscle sampling for RNA sequencing over 24 h. B–G, volcano plots displaying differentially expressed genes (DEGs) in PER2 muscle‐specific knockout (MKO) mice relative to control mice (CTRL) at zeitgeber time (ZT) 0, 4, 8, 12, 16 and 20. The top 15 genes are labelled in red. H, number of significant DEGs (cut‐off, P < 0.05) at each time point. I, table with summary of differentially regulated (DR) transcripts obtained with different statistical cut‐offs. J, histogram distribution of amplitude fold change estimations of the 321 DR circadian transcripts in KO vs. CTRL mice. K, histogram of phase changes of DR genes in KO vs. CTRL mice. L, transcript phase shift analysis showing the shift of gene transcript expression at different times. M and N, upset plots showing overlaps between upregulated (M) and downregulated (N) DEGs at different time points. Abbreviations: DODR, detection of differential rhythmicity; RAIN, rhythmicity analysis incorporating non‐parametric methods. [Colour figure can be viewed at wileyonlinelibrary.com]
Figure 7
Figure 7. Pathway and transcription factor enrichment analysis of transcriptional responses to PER2 deletion at different time points
A, top 15 reactome pathways for upregulated differentially expressed genes (DEGs) in PER2 muscle‐specific knockout (MKO) mice at zeitgeber time (ZT) 4 and ZT12. B and C, top 10 predicted transcription factors associated with the upregulated DEGs at ZT4 (B) and ZT12 (C). D, dot plot of upregulated reactome pathways at ZT0, ZT8, ZT16 and ZT20. E, top 10 reactome pathways for differentially downregulated genes in PER2 MKO at ZT4 and ZT12. F and G, top 10 predicted transcription factors driving downregulated DEGs at ZT4 (F) and ZT12 (G). H, dot plot of downregulated reactome pathways at ZT0, ZT8, ZT16 and ZT20. Dashed lines indicate cut‐off for significance at 1.3 (P < 0.05). [Colour figure can be viewed at wileyonlinelibrary.com]
Figure 8
Figure 8. Time of day‐specific transcriptional response to RORα deletion in skeletal muscle
A, schematic diagram of muscle sampling for RNA sequencing over 24 h. B–G, volcano plots displaying differentially expressed genes (DEGs) in RORα muscle‐specific knockout (MKO) mice relative to controls (CTRL) at zeitgeber time (ZT) ZT0, ZT4, ZT8, ZT12, ZT16 and ZT20. The top 15 genes are labelled in red. H, number of significant DEGs (cut‐off, P < 0.05) at each time point. I, table with summary of differentially regulated (DR) transcripts obtained with different statistical cut‐offs. J, histogram distribution of amplitude fold change estimations of the 321 DR circadian transcripts in KO vs. CTRL mice. K, histogram of phase changes of DR genes in KO vs. CTRL mice. L, transcript phase shift analysis showing the shift of gene transcript expression at different times. M and N, upset plots showing overlaps between upregulated (M) and downregulated (N) DEGs at different time points. Abbreviations: DODR, detection of differential rhythmicity; RAIN, rhythmicity analysis incorporating non‐parametric methods. [Colour figure can be viewed at wileyonlinelibrary.com]
Figure 9
Figure 9. Transcriptional pathways and predicted transcription factor regulation in RORα muscle‐specific knockout mice
A, top reactome pathways for commonly upregulated differentially expressed genes (DEGs) in RORα muscle‐specific knockout (MKO) at all zeitgeber times (ZTs). B, top 10 predicted transcription factors driving upregulated DEGs. C, top reactome pathways for commonly downregulated DEGs in RORα MKO at all ZTs. D, top 10 predicted transcription factors driving downregulated DEGs. E, top reactome pathways for differentially upregulated genes in RORα MKO at ZT4 and ZT20. F, top reactome pathways for differentially downregulated genes in RORα MKO at ZT4 and ZT20. Dashed lines indicate cut‐off for significance at 1.3 (P <0.05). [Colour figure can be viewed at wileyonlinelibrary.com]
Figure 10
Figure 10. Proteomic analysis of PER2 muscle‐specific knockout mice
A, Venn diagrams displaying the number of differentially expressed proteins in PER2 muscle‐specific knockout (MKO) compared with control (CTRL) at daytime [zeitgeber time 4 (ZT4)] or night‐time [zeitgeber time 16 (ZT16)] and resulting overlap. B and C, volcano plots displaying differentially regulated proteins (with top 10 indicated), as described above. D and E, reactome pathway enrichment analysis of upregulated (D) and downregulated (E) proteins in PER2 MKO mice at ZT4 and ZT16. F, overlap of all differentially regulated (DR) proteins at ZT4 with differentially expressed genes (DEGs) at all time points in PER2 MKO. G, overlap of DR proteins with DEGs at ZT4. H, top reactome pathways for the 46 factors that overlap in F. I, overlap of all DR proteins at ZT16 with DEGs at all time points in PER2 MKO. J, overlap of DR proteins at ZT16 with DEGs at ZT4. K, top reactome pathways for the 47 factors that overlap in I. Grey and dashed lines indicate cut‐off for significance at 1.3 (P < 0.05). [Colour figure can be viewed at wileyonlinelibrary.com]
Figure 11
Figure 11. Proteomic analysis of RORα muscle‐specific knockout mice
A, Venn diagrams displaying the number of differentially expressed proteins in RORα muscle‐specific knockout (MKO) compared with control (CTRL) at daytime [zeitgeber time 4 (ZT4)] or night‐time [zeitgeber time 16 (ZT16)] and resulting overlap. B and C, volcano plots displaying differentially regulated (DR) proteins (with the top 10 indicated), as described above. D and E, reactome pathway enrichment analysis of upregulated (D) and downregulated (E) proteins in RORα MKO mice at ZT4 and ZT16. F, overlap of all DR proteins at ZT4 with differentially expressed genes (DEGs) at all time points in RORα MKO. G, overlap of DR proteins with genes commonly DR at all ZTs. H, top reactome pathways for the 188 factors that overlap in F. I, overlap of all DR proteins at ZT16 with DEGs at all time points in RORα MKO. J, overlap of DR proteins at ZT16 with genes commonly DR at all ZTs. K, top reactome pathways for the 191 factors that overlap in I. L, overlap between genes and proteins that were commonly different in PER2 and RORα MKO at all time points. Top reactome pathways associated with the 27 overlapping factors are depicted within the black lines. Grey and dashed lines indicate cut‐off for significance at 1.3 (P < 0.05). [Colour figure can be viewed at wileyonlinelibrary.com]
Figure 12
Figure 12. Metabolomic analysis of PER2 and RORα muscle‐specific knockout mice
A, heatmap displaying metabolites that are significantly differentially regulated in the PER2 muscle‐specific knockout (MKO) at zeitgeber time 4 (ZT4) or zeitgeber time 16 (ZT16). B, heatmap displaying metabolites that are significantly differentially regulated in the RORα MKOs compared with control at daytime (ZT4) or night‐time (ZT16). Data shown are averaged z‐score values of five or six animals (n) per genotype per time point. *q < 0.05, **q < 0.01 and ***q < 0.001; Student's unpaired t test. C, schematic diagram depicting the primary and secondary molecular clock loops, with a summary of all the main results from this study. Please note that the study was conducted entirely in mice and the human figure is for illustrative purposes. This figure was created with BioRender.com. Abbreviations: Ala, alanine; Asn, asparagine; Cit, citrinin; Cys, cysteine; Gly, glycine; His, histidine; Ile, isoleucine; Met, methionine; Orn, ornithine; Pro, proline; Ser, serine; Thr, threonine; Val, valine. [Colour figure can be viewed at wileyonlinelibrary.com]

References

    1. Ahrné, E. , Glatter, T. , Viganò, C. , von Schubert, C. , Nigg, E. A. , & Schmidt, A. (2016). Evaluation and improvement of quantification accuracy in isobaric mass tag‐based protein quantification experiments. Journal of Proteome Research, 15(8), 2537–2547. - PubMed
    1. Andrews, J. L. , Zhang, X. , McCarthy, J. J. , McDearmon, E. L. , Hornberger, T. A. , Russell, B. , Campbell, K. S. , Arbogast, S. , Reid, M. B. , Walker, J. R. , Hogenesch, J. B. , Takahashi, J. S. , & Esser, K. A. (2010). CLOCK and BMAL1 regulate MyoD and are necessary for maintenance of skeletal muscle phenotype and function. Proceedings of the National Academy of Sciences of the United States of America, 107(44), 19090–19095 - PMC - PubMed
    1. Bae, K. , Jin, X. , Maywood, E. S. , Hastings, M. H. , Reppert, S. M. , & Weaver, D. R. (2001). Differential functions of mPer1, mPer2, and mPer3 in the SCN circadian clock. Neuron, 30(2), 525–536 - PubMed
    1. Bae, K. , Lee, K. , Seo, Y. , Lee, H. , Kim, D. , & Choi, I. (2006). Differential effects of two period genes on the physiology and proteomic profiles of mouse anterior tibialis muscles. Molecules and Cells, 22(3), 275–284. - PubMed
    1. Bass, J. , & Lazar, M. A. (2016). Circadian time signatures of fitness and disease. Science, 354(6315), 994–999. - PubMed

MeSH terms

Substances