. 2024 Jun 20;84(12):2272-2286.e7.
doi: 10.1016/j.molcel.2024.05.016. Epub 2024 Jun 7.

A CPF-like phosphatase module links transcription termination to chromatin silencing

Affiliations

A CPF-like phosphatase module links transcription termination to chromatin silencing

Eduardo Mateo-Bonmatí et al. Mol Cell. .

Abstract

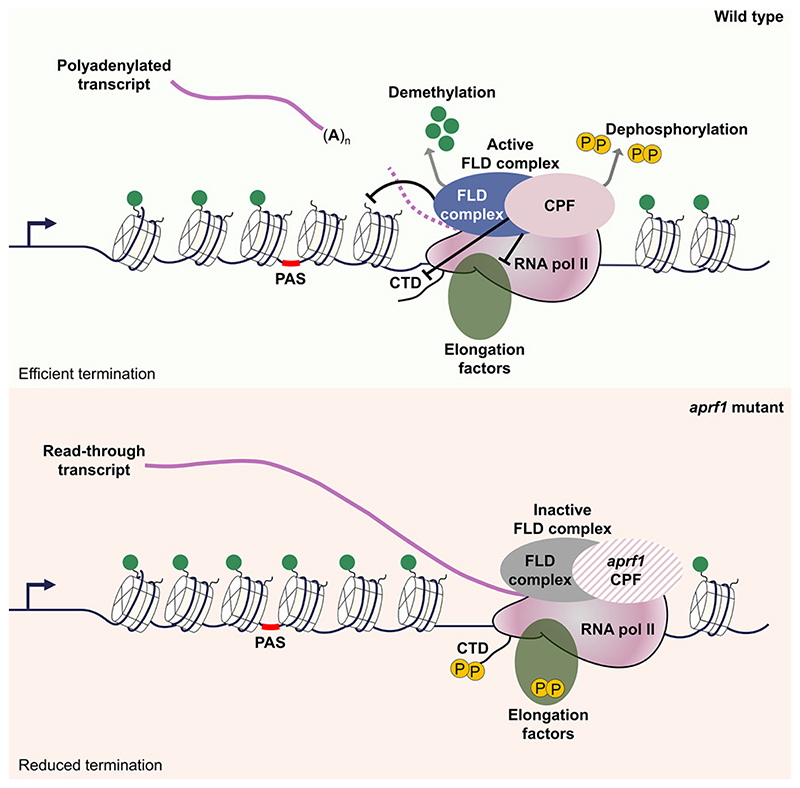
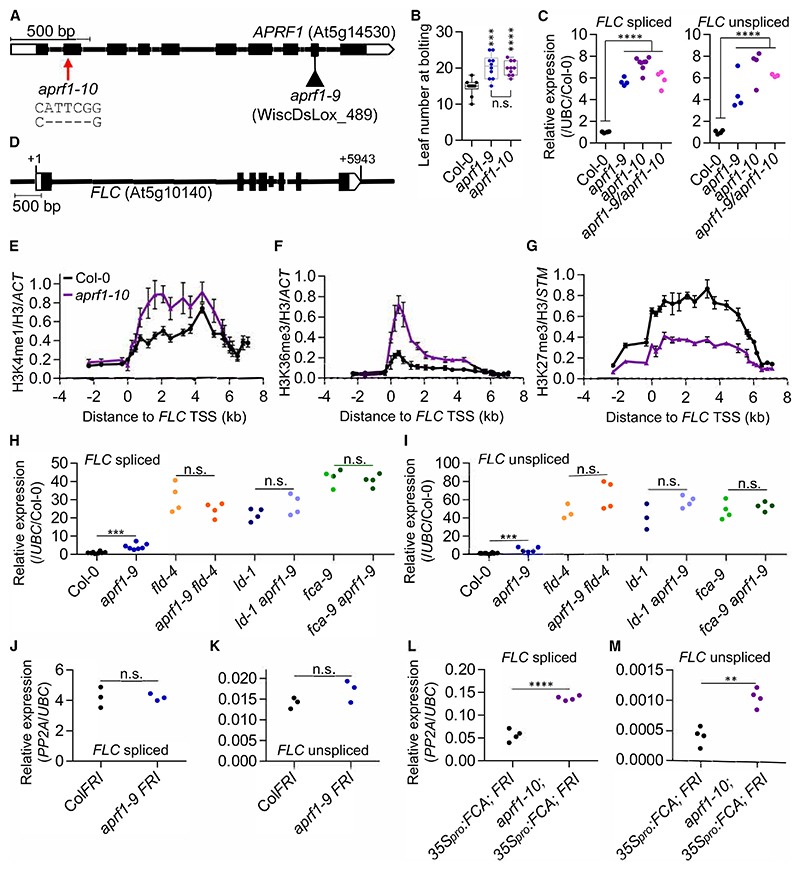
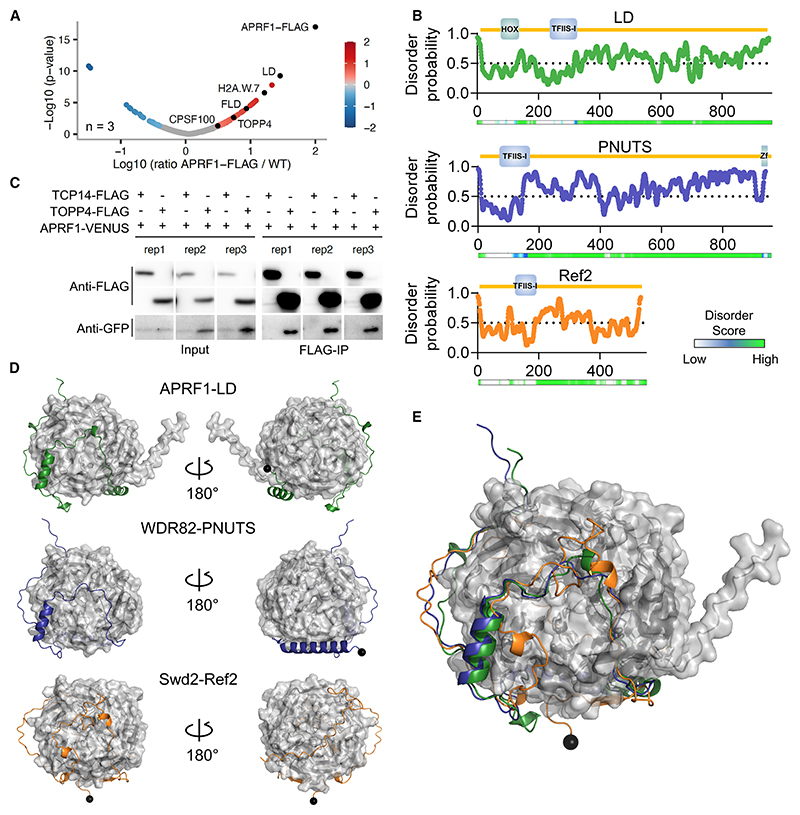
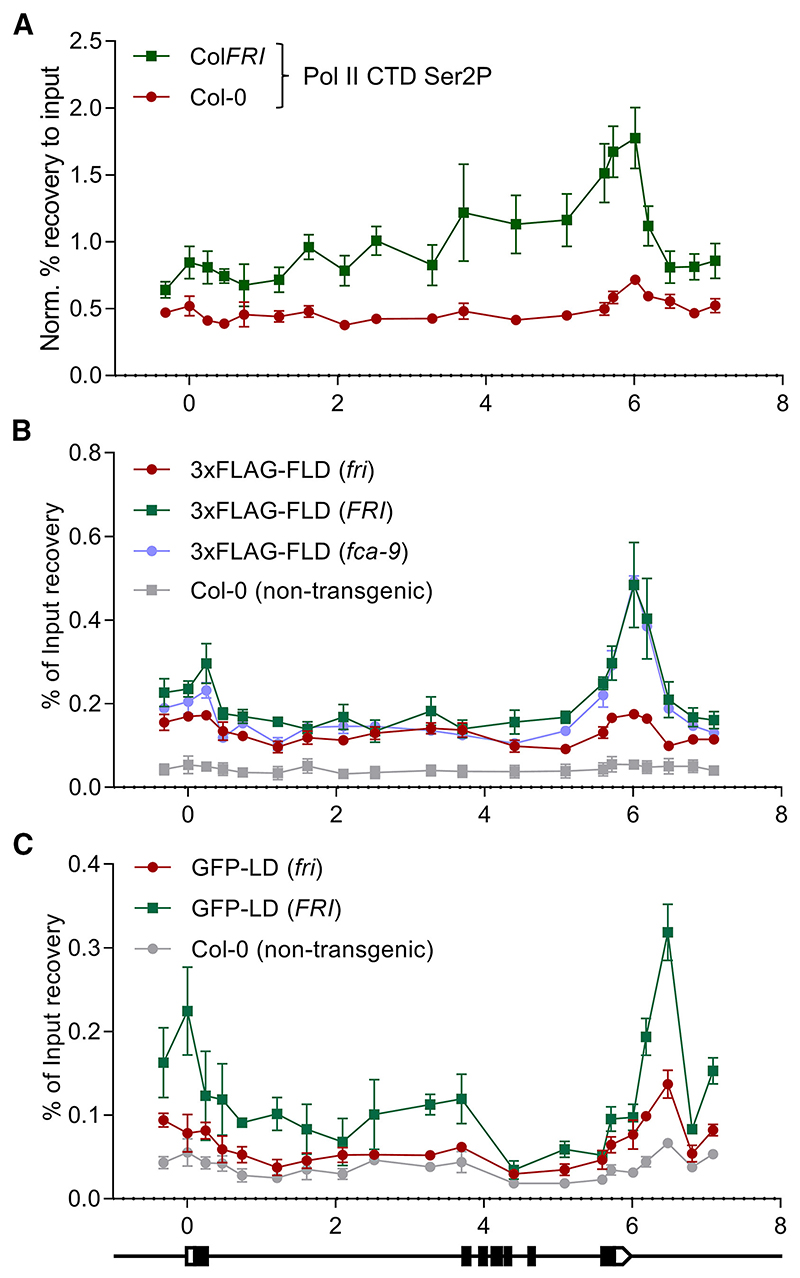
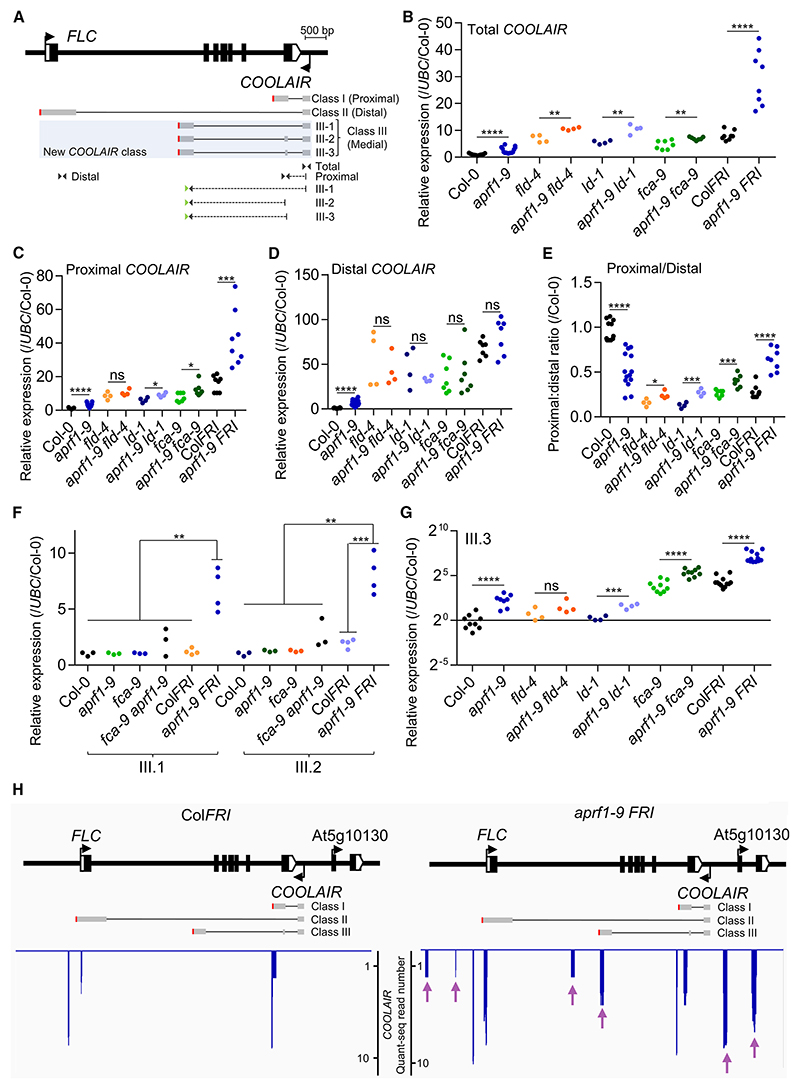
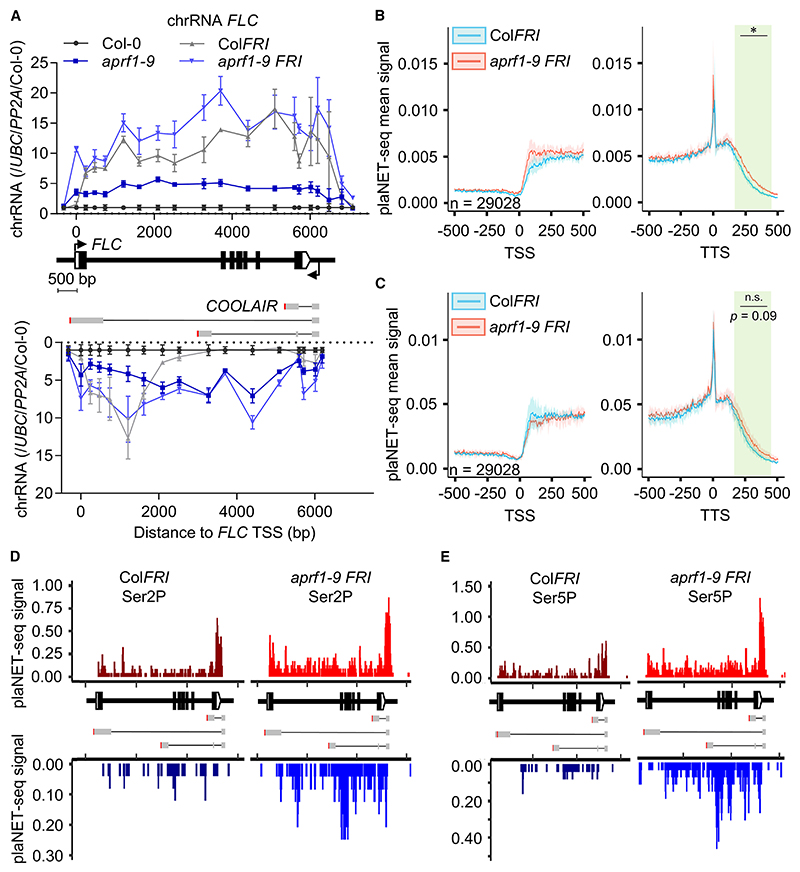
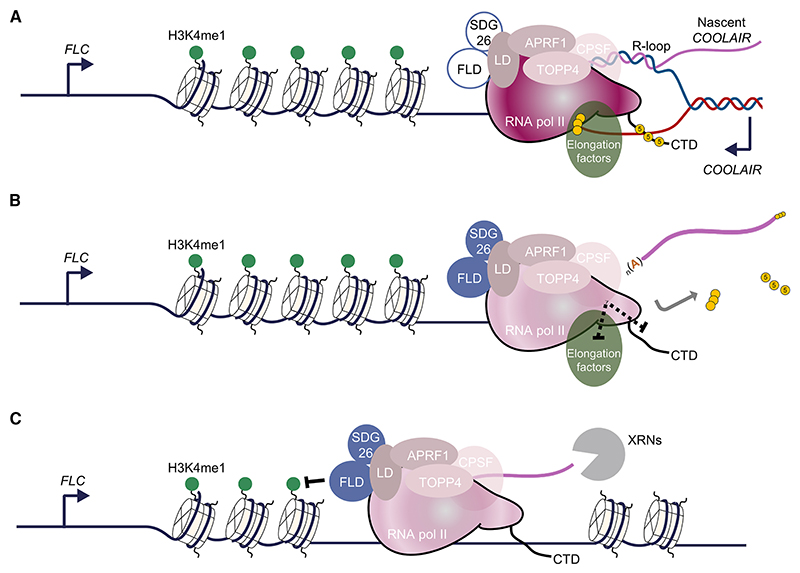
The interconnections between co-transcriptional regulation, chromatin environment, and transcriptional output remain poorly understood. Here, we investigate the mechanism underlying RNA 3' processing-mediated Polycomb silencing of Arabidopsis FLOWERING LOCUS C (FLC). We show a requirement for ANTHESIS PROMOTING FACTOR 1 (APRF1), a homolog of yeast Swd2 and human WDR82, known to regulate RNA polymerase II (RNA Pol II) during transcription termination. APRF1 interacts with TYPE ONE SERINE/THREONINE PROTEIN PHOSPHATASE 4 (TOPP4) (yeast Glc7/human PP1) and LUMINIDEPENDENS (LD), the latter showing structural features found in Ref2/PNUTS, all components of the yeast and human phosphatase module of the CPF 3' end-processing machinery. LD has been shown to co-associate in vivo with the histone H3 K4 demethylase FLOWERING LOCUS D (FLD). This work shows how the APRF1/LD-mediated polyadenylation/termination process influences subsequent rounds of transcription by changing the local chromatin environment at FLC.

Keywords: COOLAIR; ChIP; FLC; IP-MS; Quant-seq; RNA 3′ processing; chromatin silencing; co-transcriptional processing; plaNET-seq; transcription termination.


Conflict of interest statement

Declaration of interests L.A.P. is on the advisory board for Molecular Cell.

Figures

Graphical abstract
Graphical abstract
Figure 1
Figure 1. APRF1, a robust interactor of the FLD complex, functions genetically in the FCA pathway
A) Architecture of the APRF1 gene and illustration of the nature and location of the mutations studied in this work. Boxes indicate exons and lines introns. White boxes represent untranslated regions. The triangle represents a T-DNA insertion (aprf1-9); the red arrow points to the location of the CRISPR-Cas9-derived deletion (aprf1-10). B) Boxplot representing the leaf number at bolting of the wild-type Col-0 and both aprf1 mutants. Each dot represents the score of a single plant. Boxes are delimited by the first (Q1, lower hinge) and third (Q3, upper hinge) quartiles. Whiskers represent Q1 –1.5 IQ (lower) and Q3 +1.5 IQ (upper), where IQ = Q3 – Q1. Horizontal bars represent the median of the values. C) Relative values of FLC spliced (left) and unspliced (right) in the wild-type Col-0, both aprf1 mutants, and F1 aprf1-9/aprf1-10 hybrid plants. Values were normalized to the housekeeping UBC gene and to Col-0. D) Schematic diagram showing FLC gene structure following the guidelines described for (A). +1 indicates the transcriptional start site (TSS). (E–G) ChIP analysis of H3K4me1 (E), H3K36me3 (F), and H3K27me3 (G) levels at FLC in Col-0 and aprf1-10. Numbers in x axis represent the distance in kilobases to the FLC TSS and numbers in the y axis correspond to relative enrichment of the corresponding histone mark. Each dot represents an amplicon. Values were normalized to H3 and to ACT7 (for H3K4me1 and H3K36me3) or STM (for H3K27me3) and represent mean ± standard error of the mean (SEM). (H−M) Relative values of FLC spliced (H, J, and L), and unspliced (I, K, and M) in various genetic backgrounds. Values were normalized to the housekeeping gene UBC (H–M) and Col-0 (H and I) or PP2A (J–M). Asterisks indicate statistically significant differences to Col-0 (B, C, H, and I) and to C2 (35Spro:FCAg; FRI) (L and M) in a two-way Student’s t test (** p < 0.01, *** p < 0.001, and **** p < 0.0001). N.s. stands for not statistically different (p > 0.05). Scale bars: 500 bp in (A) and (D). Experiments were performed using 2-week-old seedlings grown in long days conditions with n ≥ 3 (C and E−M), where each replicate represents a pool of 10 to 15 seedlings (C and H–M) or 2.5 g of seedlings (E–G).
Figure 2
Figure 2. LD-APRF1-TOPP4 form a plant CPSF-like phosphatase module
(A) Volcano plot showing the relative protein abundance in log-10 scale ratio of immunoprecipitated samples from APRF1-3xFLAG to control Col-0 samples, analyzed in triplicate. Each replicate consists of 2 g of 10-day-old seedlings. Red dots highlight proteins enriched in the APRF1-3xFLAG samples. APRF1-FLAG, LD, H2A.W.7, FLD, TOPP4, and CPSF100 are shown as black dots. p values were obtained based on hypothesis testing by t test. More detail in STAR Methods. (B) Schematic representation of protein size, annotated domains, disorder probability, and disorder score for LD, PNUTS (Homo sapiens), and Ref2 (Saccharomyces cerevisiae). Individual amino acid score for disorder probability were obtained with the online Protein DisOrder prediction System (PrDOS) and plotted using GraphPad. Disorder scores were obtained by DP236 and shown in a color scale. (C) Co-immunoprecipitation results obtained in transiently transformed leaves of N. benthamiana with APRF1-mVENUS, TOPP4-3xFLAG, and the control line TCP14-FLAG. Three replicates of the same experiment are shown. Full blot details in Figure S8. (D) AlphaFold2 predictions of complexes between APRF1-LD, WDR82-PNUTS, and Swd2-Ref2. WD40 orthologs are shown in gray surface representation, whereas TFIIS orthologs are shown in cartoon; the N-terminal amino acid of the predicted TFIIS proteins are denoted by black spheres. (E) Overlay of the three predictions shown in (D).
Figure 3
Figure 3. ChIP-qPCR co-occupancy profiles indicate that FLD and LD work co-transcriptionally to control FLC transcription
(A) Elongating RNA Pol II (Ser2P) ChIP profiles over FLC in a high (ColFRI) and low (fri or Col-0) transcriptional background. (B) ChIP binding profile over FLC of the fld-4 FLDpro:3xFLAG-FLD transgenic plants in different genetic backgrounds. (C) ChIP binding profile over FLC of the ld-1 LDpro:GFP-LD transgenic plants in different genetic backgrounds. FLC gene structure following the indications for Figure 1D. All the experiments were done with 2-week-old seedlings. Dots and error bars represent mean ± SEM of three replicates. Each replicate consists of 2.5 g of seedlings. (A) Results expressed in % recovery to input values normalized to the promoter of the housekeeping gene ACT7 as in Mikulski et al.. Results in (B) and (C) are expressed in % recovery to input.
Figure 4
Figure 4. Mutations in APRF1 trigger COOLAIR upregulation and an increase in a new medially polyadenylated COOLAIR isoform
(A) FLC architecture following the representation of Figure 1D with indication of different COOLAIR isoforms in gray. For simplicity, classes I and II (proximal and distal) are each represented by one isoform. The new COOLAIR class III isoforms are highlighted in pale blue. Triangles represent primer pairs (not drawn to scale) used to measure the relative abundance by RT-qPCR. Dashed lines indicate primers spanning two COOLAIR exons. Green triangles indicate the primer used for COOLAIR class III retro-transcription. Red vertical lines represent polyadenylation sites. Scale bars, 500 bp. (B–D) Relative expression analyses of (B) total COOLAIR, (C) proximal COOLAIR, and (D) distal COOLAIR in different genotypes. (E) COOLAIR proximal-to-distal ratio in different genotypes. (F and G) Relative expression analyses of COOLAIR classes (F) III.1 and III.2, and (G) III.3. Each dot represents a biological replicate analyzed in triplicate. Each replicate consists of a pool of 10 to 15 seedlings. Expression values were normalized to the UBC gene and to Col-0. Asterisks indicate statistically significant differences to the indicated genotypes in a Student’s t test (* p < 0.05, ** p < 0.01, *** p < 0.001, and **** p < 0.0001). N.s. stands for not statistically different. All the experiments were performed in 2-week-old seedlings grown in long days conditions. (H) COOLAIR strand Quant-seq results of ColFRI and aprf1-9 FRI seedlings. FLC locus is represented as in (A). The blue spikes indicate reads supporting a polyadenylation site. Purple arrows point to clusters of reads present in aprf1-9 FRI but absent in ColFRI.
Figure 5
Figure 5. COOLAIR transcriptional readthrough correlates with changed phosphorylation of the RNA Pol II carboxy terminal domain
(A) Chromatin-bound RNA levels of FLC and COOLAIR in aprf1-9 mutants, with and without functional FRI. Data were normalized to UBC and PP2A and are shown as fold-change to wild-type Col-0. Dots correspond to amplicons of the FLC (upper chart) and COOLAIR (bottom chart) transcripts, represented as mean ± SEM of three biological replicates. Each replicate consists of 2.0– 2.5 g of seedlings. (B and C) plaNET-seq metaplots at TSS and TTS of ColFRI and aprf1-9 FRI using Ser2P (B) and Ser5P (C) antibodies, analyzed in triplicate. Each replicate consists of 3 g of 10-day-old seedlings. Asterisk indicates statistically significant differences between aprf1-9 FRI and ColFRI in a one-way ANOVA with multiple comparisons (* p < 0.05). (D and E) plaNET-seq profiles over the FLC locus of ColFRI and aprf11-9 FRI using Ser2P (D) and Ser5P (E) antibodies. Upper and bottom charts show plaNET-seq profiles with merged replicates, corresponding to FLC and COOLAIR strands, respectively.
Figure 6
Figure 6. Proposed model for transcription-mediated chromatin silencing
(A) Open FLC chromatin represented by white nucleosomes and marked with H3K4me1 (green circles) is actively transcribed by RNA Pol II machinery (solid maroon), which carries a non-active FLD complex (blue circle) as well as the 3′ end-processing machinery (CPSF), including the phosphatase module formed by APRF1-LD TOPP4, and elongation factors (green oval). Pol II CTD and elongation factors harbor some posttranslational modifications, including phosphorylation (yellow circles). Nascent COOLAIR forms an R-loop in the 3′ end of the locus., (B) Formation of the R-loop stimulates the 3′ end-processing machinery to terminate transcription at the proximal PAS. This termination is also signaled by the phosphatase module to Pol II via dephosphorylation of either elongating factors or the CTD or both (dashed line). PAS recognition triggers a conformational change on RNA Pol II, illustrated by a solid-to-pale maroon color change, which also activates FLD (now solid blue circle). (C) After COOLAIR is released, RNA Pol II continues transcribing an uncapped transcript that is the substrate of 5′−3′ exoribonucleases (XRNs). During this non-productive transcription, the FLD complex co-transcriptionally removes H3K4me1 marks from nucleosomes, creating a less processive chromatin environment for subsequent rounds of transcription.

Similar articles

Cited by

References

    1. Muniz L, Nicolas E, Trouche D. RNA polymerase II speed: a key player in controlling and adapting transcriptome composition. EMBO J. 2021;40:e105740. doi: 10.15252/embj.2020105740. - DOI - PMC - PubMed
    1. Žumer K, Maier KC, Farnung L, Jaeger MG, Rus P, Winter G, Cramer P. Two distinct mechanisms of RNA polymerase II elongation stimulation in vivo. Mol Cell. 2021;81:3096–3109.:e8. doi: 10.1016/j.molcel.2021.05.028. - DOI - PubMed
    1. Berry S, Hartley M, Olsson TSG, Dean C, Howard M. Local chromatin environment of a Polycomb target gene instructs its own epigenetic inheritance. eLife. 2015;4:e07205. doi: 10.7554/eLife.07205. - DOI - PMC - PubMed
    1. Michaels SD, Amasino RM. FLOWERING LOCUS C encodes a novel MADS domain protein that acts as a repressor of flowering. Plant Cell. 1999;11:949–956. doi: 10.1105/tpc.11.5.949. - DOI - PMC - PubMed
    1. Macknight R, Bancroft I, Page T, Lister C, Schmidt R, Love K, Westphal L, Murphy G, Sherson S, Cobbett C, Dean C. FCA, a gene controlling flowering time in Arabidopsis, encodes a protein containing RNA-binding domains. Cell. 1997;89:737–745. doi: 10.1016/s0092-8674(00)80256-1. - DOI - PubMed

MeSH terms

LinkOut - more resources