. 2024 Sep:199:106556.
doi: 10.1016/j.nbd.2024.106556. Epub 2024 Jun 6.

Atlastin-1 regulates endosomal tubulation and lysosomal proteolysis in human cortical neurons

Affiliations

Atlastin-1 regulates endosomal tubulation and lysosomal proteolysis in human cortical neurons

Eliska Zlamalova et al. Neurobiol Dis. 2024 Sep.

Abstract

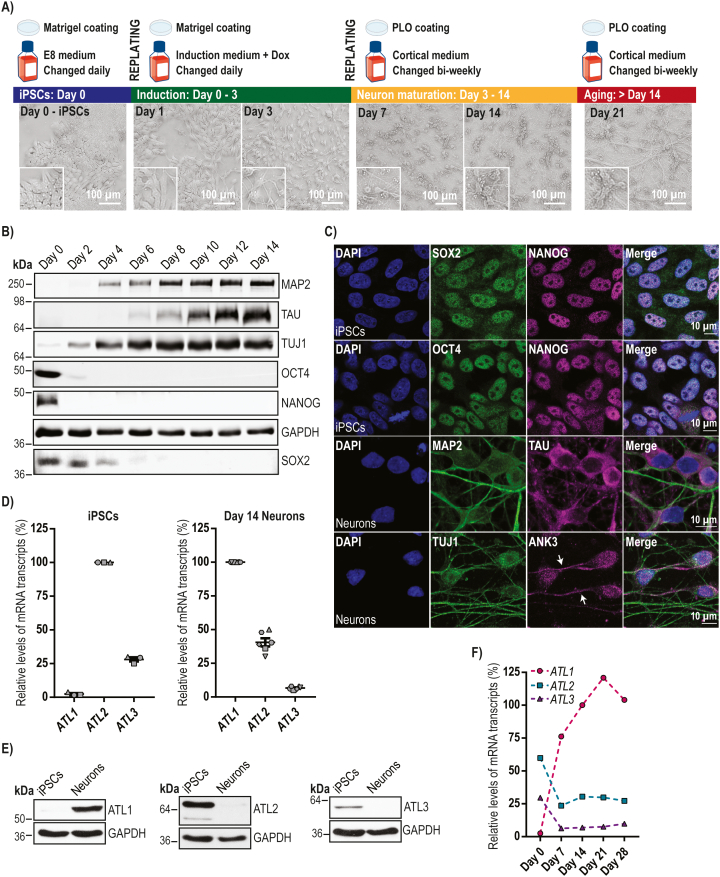
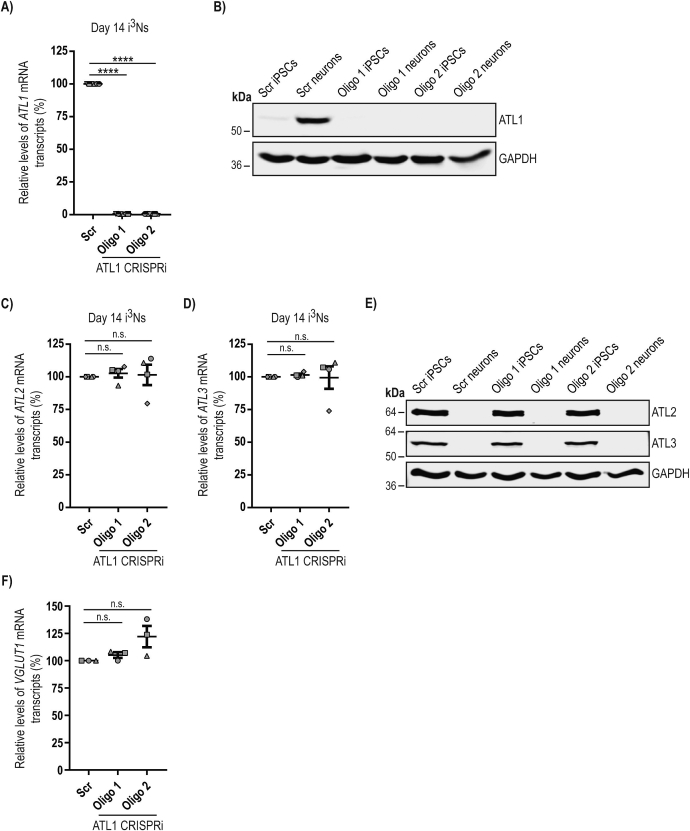
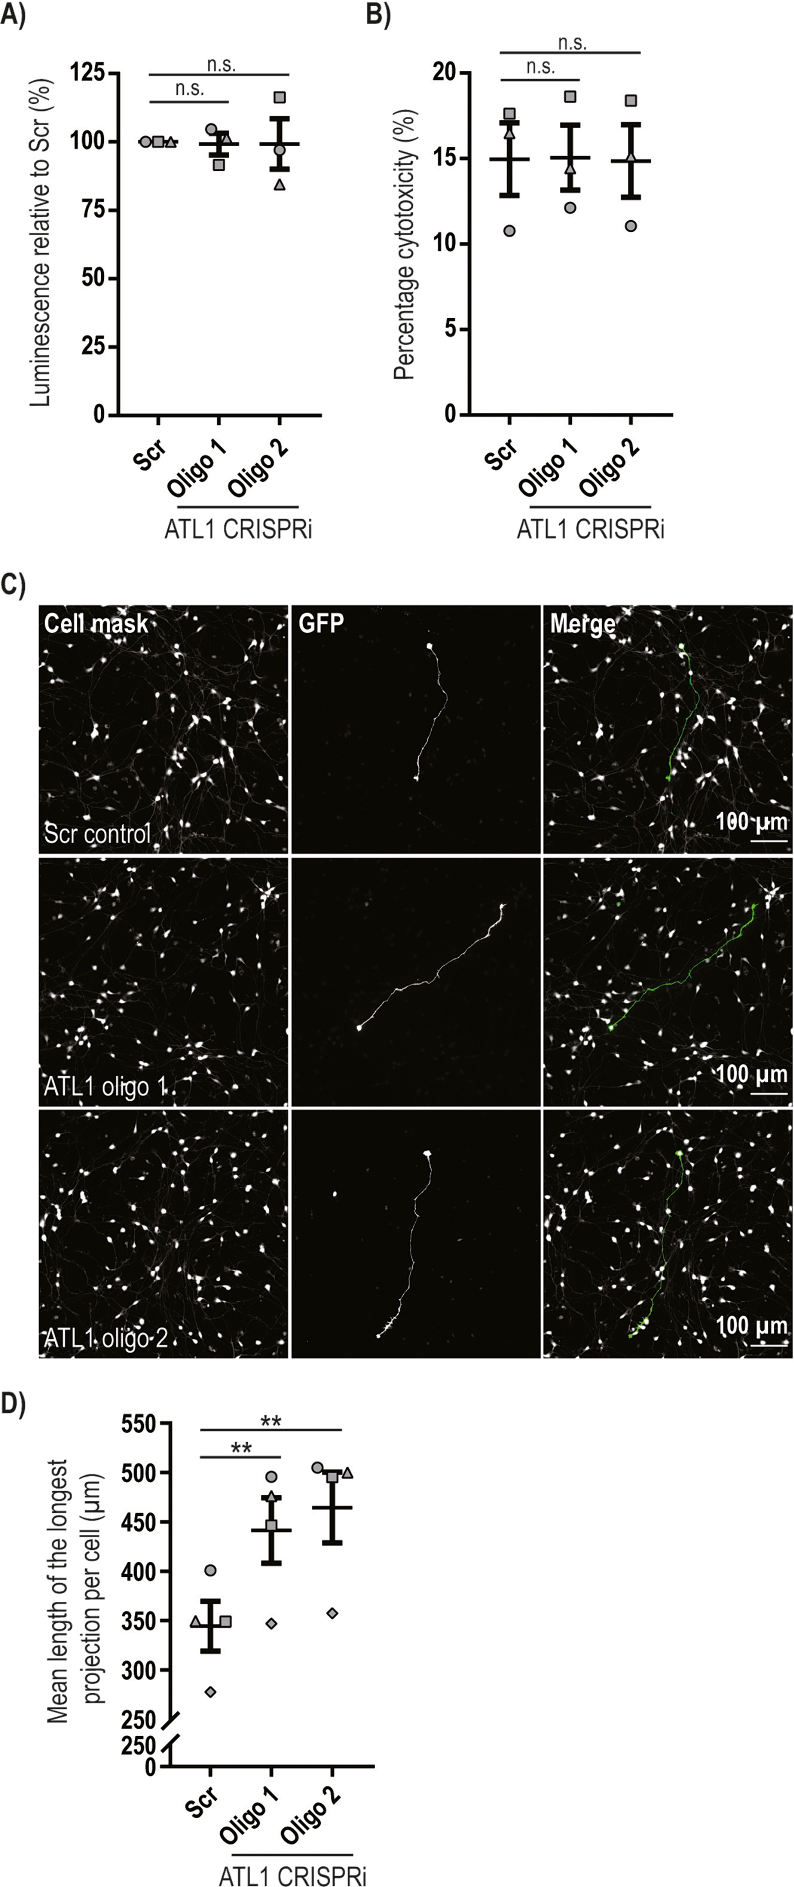
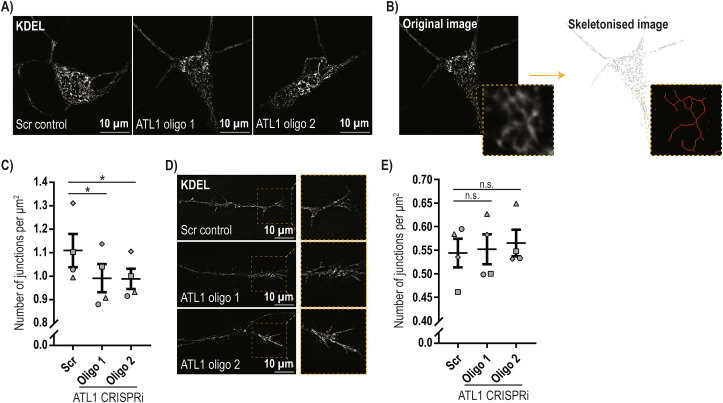
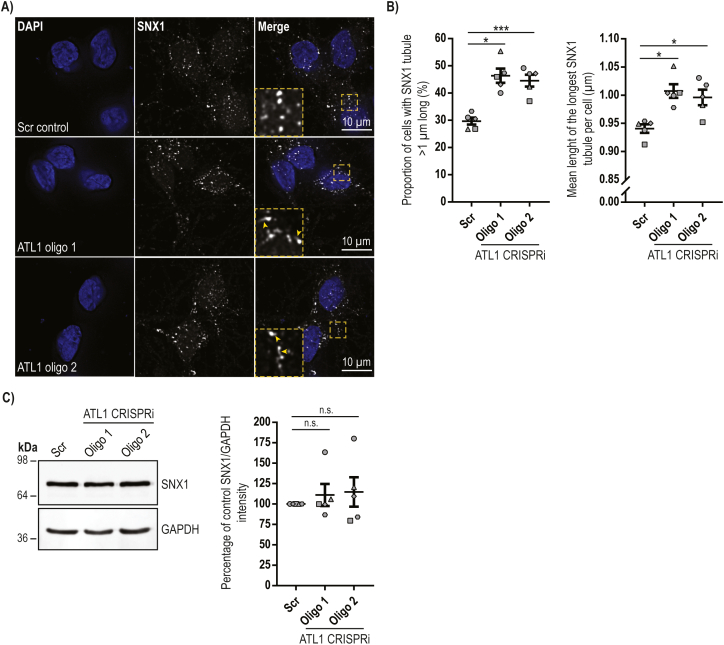
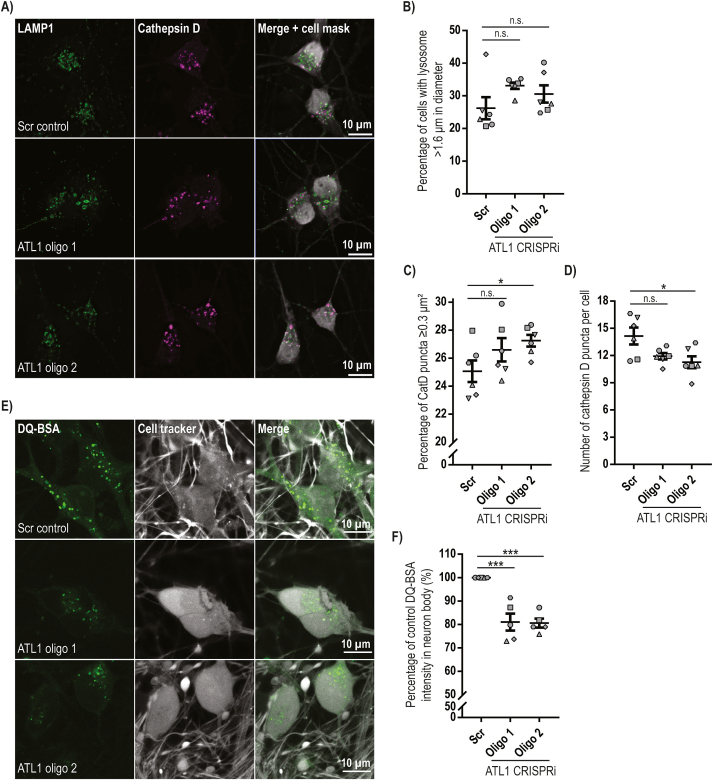
Mutation of the ATL1 gene is one of the most common causes of hereditary spastic paraplegia (HSP), a group of genetic neurodegenerative conditions characterised by distal axonal degeneration of the corticospinal tract axons. Atlastin-1, the protein encoded by ATL1, is one of three mammalian atlastins, which are homologous dynamin-like GTPases that control endoplasmic reticulum (ER) morphology by fusing tubules to form the three-way junctions that characterise ER networks. However, it is not clear whether atlastin-1 is required for correct ER morphology in human neurons and if so what the functional consequences of lack of atlastin-1 are. Using CRISPR-inhibition we generated human cortical neurons lacking atlastin-1. We demonstrate that ER morphology was altered in these neurons, with a reduced number of three-way junctions. Neurons lacking atlastin-1 had longer endosomal tubules, suggestive of defective tubule fission. This was accompanied by reduced lysosomal proteolytic capacity. As well as demonstrating that atlastin-1 is required for correct ER morphology in human neurons, our results indicate that lack of a classical ER-shaping protein such as atlastin-1 may cause altered endosomal tubulation and lysosomal proteolytic dysfunction. Furthermore, they strengthen the idea that defective lysosome function contributes to the pathogenesis of a broad group of HSPs, including those where the primary localisation of the protein involved is not at the endolysosomal system.

Keywords: Atlastin; Endoplasmic reticulum morphology; Endosomal traffic; Endosomal tubulation; Hereditary spastic paraplegia; Lysosomal proteolysis; Lysosome.


Conflict of interest statement

Declaration of competing interest The authors declare the following financial interests/personal relationships which may be considered as potential competing interests: Evan Reid reports a relationship with SwanBio Therapeutics, Inc. that includes: consulting or advisory. If there are other authors, they declare that they have no known competing financial interests or personal relationships that could have appeared to influence the work reported in this paper.

Figures

Fig. 1
Fig. 1
Atlastin expression in human iPSC-derived cortical neurons. A) Schematic diagram of the i3N differentiation protocol, showing the media and well/coverslip coatings that were used during the protocol. The corresponding brightfield microscope images illustrate cellular morphology during the differentiation period. B) i3Ns were incubated with doxycycline for 3 days and cultured for the times indicated. Cells were lysed and immunoblotted with the pluripotency (SOX2, NANOG and OCT4) or neuronal differentiation (MAP2, TAU, TUJ1) markers shown. GAPDH blotting serves as a loading control. C) iPSCs or day 14 i3Ns were fixed, processed for immunofluorescence microscopy and labelled with the pluripotency and neuronal differentiation markers shown. Ankyrin G (ANK3) marks the initial segment of axons (arrows). D) Relative mRNA abundance of atlastin gene transcripts in iPSCs or day 14 i3Ns, measured by qPCR. Atlastin transcript levels were normalised against the ACTB reference gene. Data are displayed relative to the most abundant paralogue in each case. Error bars show mean values +/− SEM of 3 or 6 biological repeats, each carried out in triplicate. E) Immunoblots showing the abundance of atlastin proteins in iPSCs or day 14 i3Ns. GAPDH blotting serves as a loading control. F) The relative mRNA abundance of atlastin transcripts throughout differentiation of i3Ns up to 28 days old, measured by qPCR. ACTB was used to normalise ATL1, −2 and − 3 transcript levels. The data points represent percentages relative to the ATL1 value on day 14. Assays were carried out on one differentiation in triplicate.
Fig. 2
Fig. 2
Generation and characterisation of human neurons lacking atlastin-1. A) Relative mRNA abundance of ATL1 transcript in day 14 CRISPRi-i3Ns (right) expressing a scrambled sgRNA, or ATL1-targeting sgRNAs oligo 1 or oligo 2, measured by qPCR. Data are displayed relative to the scrambled value. Error bars show mean values +/− SEM of 8 i3Ns biological repeats, each carried out in triplicate. B) Immunoblots showing the abundance of atlastin-1 protein in iPSCs or day 14 day i3Ns expressing the sgRNAs indicated. GAPDH blotting serves as a loading control. C and D) Relative mRNA abundance of ATL2 (C) or ATL3 (D) transcript in day 14 i3Ns expressing the sgRNAs shown, measured by qPCR. Data are displayed relative to the scrambled value. Error bars show mean values +/− SEM of 4 biological repeats, each carried out in triplicate. In all qPCR experiments ATL transcript levels were normalised against the ACTB reference gene. E) Representative immunoblots showing the abundance of atlastin proteins in iPSCs or day 14 i3Ns generated from the CRISPRi lines shown. GAPDH blotting serves as a loading control. F) Relative abundance of VGLUT1 in day 14 i3Ns expressing the sgRNAs shown, measured by qPCR. Data are displayed relative to the scrambled value. Error bars show mean values +/− SEM of 3 biological repeats. VGLUT1 transcript levels were normalised against the GAPDH reference gene. In A), C), D) and F) statistical comparisons were carried out with one-way ANOVA with Dunnett's test for multiple comparisons, n.s., p > 0.05; ****, p < 0.0001.
Fig. 3
Fig. 3
Depletion of atlastin-1 does not affect human neuronal viability but does affect neurite growth. The scrambled and atlastin-1 CRISPRi cell lines indicated were seeded at an equal confluence and differentiated to neurons for 14 days. Cell viability was then quantified using two different assays. A) ATP abundance was quantified using the CellTitre-Glo cell viability assay. B) LDH levels were quantified in cell medium and after lysis of cultures using the CytoTox 96® Non-Radioactive Cytotoxicity Assay. The ratio of LDH released by spontaneously dying neurons was divided by the total LDH released after complete neuronal culture lysis, to produce a percentage cytotoxicity ratio. In A) and B) results were normalised to the Scr level and mean values +/− SEM are plotted for n = 3 biological repeats, each performed with technical triplicates. Statistical comparisons were carried out with one-way ANOVA with Dunnett's test for multiple comparisons. n.s., p > 0.05. C) The scrambled and atlastin-1 CRISPRi cell lines indicated were seeded at an equal confluence and differentiated to neurons for 4 days. A low efficiency transfection with a vector expressing eGFP and emerald fluorescent proteins was then carried out. At day 5 the neurons were fixed, labelled with anti-GFP antibody, incubated with a whole cell stain and visualised by immunofluorescence microscopy. D) The longest neurite per neuron was measured and the mean length of the longest neurite per experiment was plotted. 4 independent experiments were analysed with a minimum of 35 neurons per genotype counted. Error bars represent SEM. Statistical comparisons were performed by repeated measures one-way ANOVA with Dunnett's correction for multiple testing; **, p < 0.01.
Fig. 4
Fig. 4
Depletion of atlastin-1 causes reduced ER three-way junction abundance in human neurons. A) i3Ns from the CRISPRi lines indicated were transduced with a doxycycline-inducible mEmerald-KDEL lentiviral construct and treated with doxycycline for three days from day 11 of differentiation. They were then imaged live with a Zeiss Elyra 7 microscope with Lattice SIM2 super-resolution on day 14. Representative images are shown. B) ER morphology was analysed using Image J software. Images were analysed blind. Each image was thresholded to select the KDEL signal and then skeletonised to show the network simplified into single pixel wide lines. The zoomed-in skeleton area on the bottom right shows representative skeleton labelling post-analysis. End-point voxels (blue) are pixels with only 1 neighbouring labelled pixel; junction voxels in purple are pixels with >2 neighbours; and slab voxels in orange have exactly 2 neighbours. A neighbouring group of junction voxels is counted as one junction. C) Junctions were counted in neuronal bodies and the number of junctions was normalised to the cell area. Four neuronal differentiation biological repeats were analysed with at least 25 neurons per genotype in each repeat, with the exception of one repeat for oligo 1 which was based on 4 neurons. Bars show mean +/− SEM. D) A similar analysis of ER morphology to that shown in B) was carried out in growth cone regions. The images show representative micrographs of growth cones labelled with mEmerald-KDEL in the i3N lines indicated. E) Four neuronal differentiation biological repeats were analysed with a minimum of 6 (mean of 27.7) growth cones per genotype analysed in each repeat. The mean number of junctions normalised to the growth cone area was plotted +/− SEM. In C) and E) statistical comparisons were performed with repeated measure one-way ANOVA, with Dunnett's correction for multiple testing. n.s., p > 0.05; *, p < 0.05.
Fig. 5
Fig. 5
Human neurons lacking atlastin-1 show increased endosomal tubulation. A) Fixed day 14 neurons from the CRISPRi-i3N lines indicated were immunolabelled for SNX1 and imaged with a Zeiss AxioImager Z2 Motorized Upright Microscope. The images were deconvolved using Huygens software. DAPI was used to visualise nuclei. Representative images of SNX1-labelled endosomes and endosomal tubules are shown. In the right-hand panels the inset magnified images correspond to the boxed regions in the main images. B) The images were blinded for analysis and the longest tubule per cell was measured. The percentage of cells containing a tubule over 1 μm in length is plotted in the left hand chart, while the mean length of the longest tubule per cell is plotted in the right hand chart. The experiment was repeated 5 times with a minimum of 52 neurons analysed per genotype in each differentiation biological repeat. Error bars show SEM. Statistical comparisons were performed with repeated measures one-way ANOVA with Dunnett's correction for multiple testing *, p < 0.05; ***, p < 0.001. C) Lysates from day 14 i3Ns from the CRISPRi cell lines indicated were immunoblotted for SNX1. GAPDH serves as a control to validate equal lane loading. Immunoblot band intensity was quantified in ImageJ in 5 such experiments and plotted in the corresponding chart. Statistical comparisons were performed with one-way ANOVA with Dunnett's correction for multiple testing, n.s., p > 0.05.
Fig. 6
Fig. 6
Lysosomal proteolytic abnormalities in cells lacking atlastin-1. A) Day 14 i3Ns from the lines indicated were fixed and immunolabelled for LAMP1 and cathepsin D, as well as cell mask whole-cell and DAPI nuclear labels. Cells were imaged with a Zeiss Axio Observer microscope with a tile imaging function and the images were deconvolved using Huygens software. B) The diameter of the largest LAMP1-positive vesicle per cell was measured in at least 100 cells per genotype and the percentage of neurons with at least one lysosome over 1.6 μm in diameter was calculated and plotted. LAMP1 vesicle size measurement was performed blind to genotype. N = 6 biological repeat experiments. C) and D) The number and area of cathepsin D-positive puncta were measured using an automated protocol developed in Image J software. Only signal within the cell area outlined by the cell mask was considered. Cell number was calculated based on the number of nuclei in the field. The percentage of cells with cathepsin D puncta >0.3 μm2 in area is plotted in C), while the total number of cathepsin D puncta per neuron is shown in D). On average 300 cells were analysed per genotype in each experiment, N = 6 biological repeats. Error bars show SEM. n.s., p > 0.05; *, p < 0.05. E) Day 21 neurons from the i3N lines indicated were incubated with DQ-BSA substrate for 5.5 h and with a live-imaging whole cell stain (Cell tracker) for 20 min. Living cells were then imaged with a Zeiss LSM 780 Confocal Microscope. F) Neuron somas were selected using the cell tracker channel. The mean DQ-BSA fluorescent intensity was measured and recorded for each cell. Mean results from each experiment are plotted as percentage relative to the Scr control. 5 independent experiments were performed and a minimum of 50 cells per genotype in each experiment was used for quantification. Error bars show mean +/− SEM. ***, p < 0.001. In B), C), D) and F) statistical comparisons were made using repeated measures one-way ANOVA with Dunnett's correction for multiple testing.

Similar articles

References

    1. Alecu J.E., et al. De novo variants cause complex symptoms in HSP-ATL1 (SPG3A) and uncover genotype-phenotype correlations. Hum. Mol. Genet. 2023;32:93–103. - PMC - PubMed
    1. Allison R., et al. An ESCRT-spastin interaction promotes fission of recycling tubules from the endosome. J. Cell Biol. 2013;202:527–543. - PMC - PubMed
    1. Allison R., et al. Defects in ER–endosome contacts impact lysosome function in hereditary spastic paraplegia. J. Cell Biol. 2017;216:1337–1355. - PMC - PubMed
    1. Blackstone C. Cellular pathways of hereditary spastic paraplegia. Annu. Rev. Neurosci. 2012;35:25–47. - PMC - PubMed
    1. Blackstone C. Hereditary spastic paraplegia. Handb. Clin. Neurol. 2018;148:633–652. - PubMed

Publication types

MeSH terms

LinkOut - more resources