. 2024 Jun 8;10(1):274.
doi: 10.1038/s41420-024-02016-0.

Sponging of five tumour suppressor miRNAs by lncRNA-KCNQ1OT1 activates BMPR1A/BMPR1B-ACVR2A/ACVR2B signalling and promotes chemoresistance in hepatocellular carcinoma

Affiliations

Sponging of five tumour suppressor miRNAs by lncRNA-KCNQ1OT1 activates BMPR1A/BMPR1B-ACVR2A/ACVR2B signalling and promotes chemoresistance in hepatocellular carcinoma

Swagata Majumdar et al. Cell Death Discov. .

Abstract

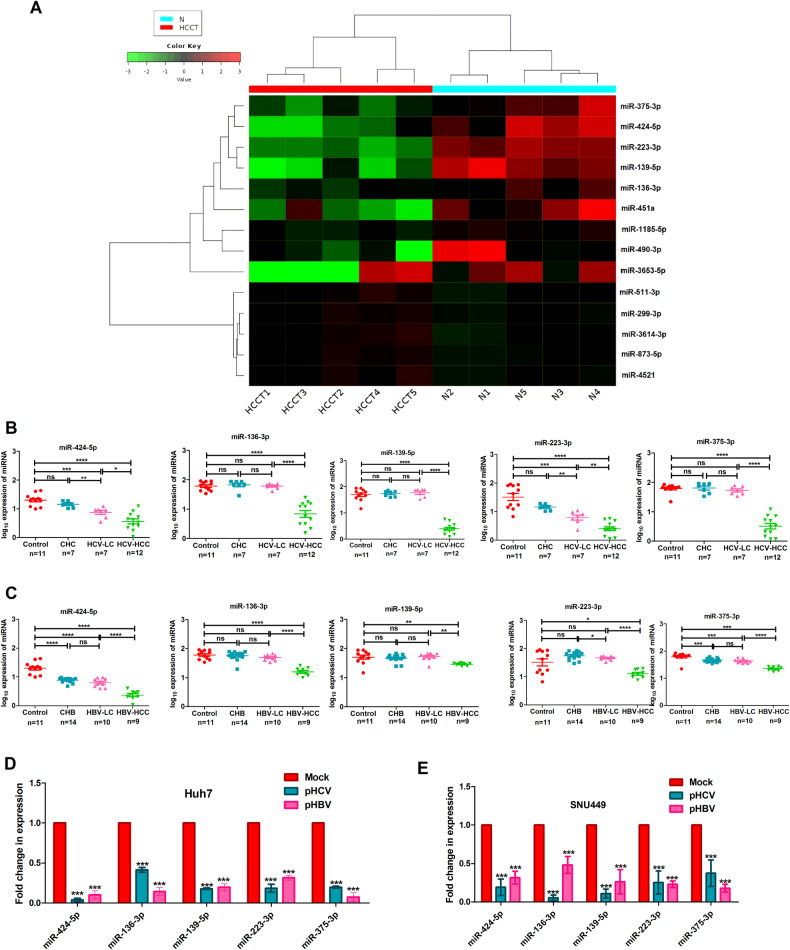
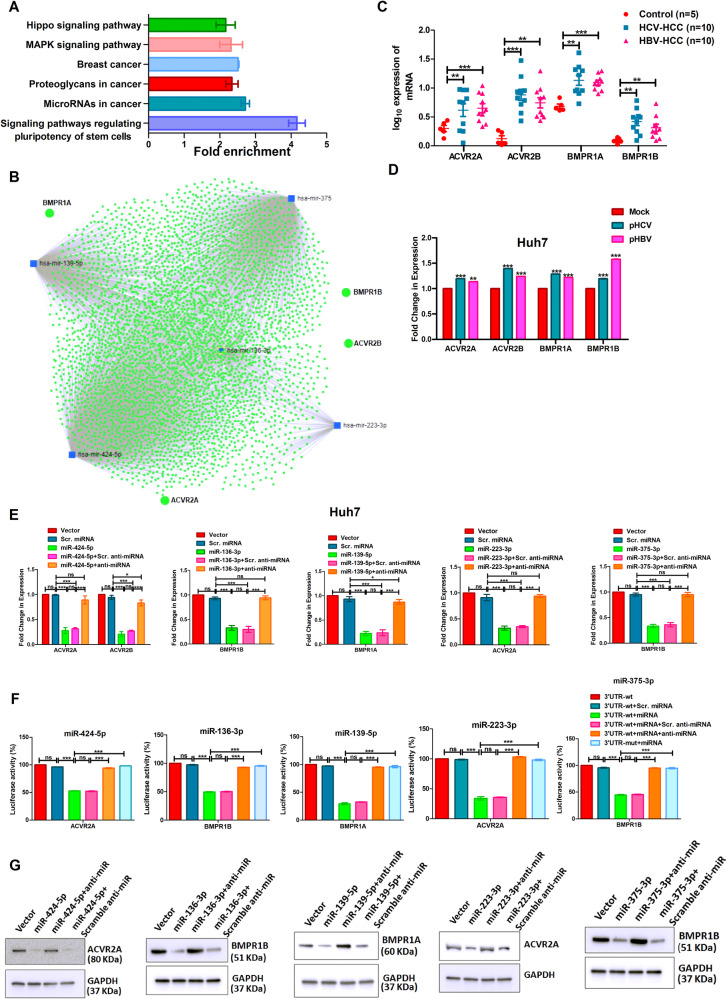
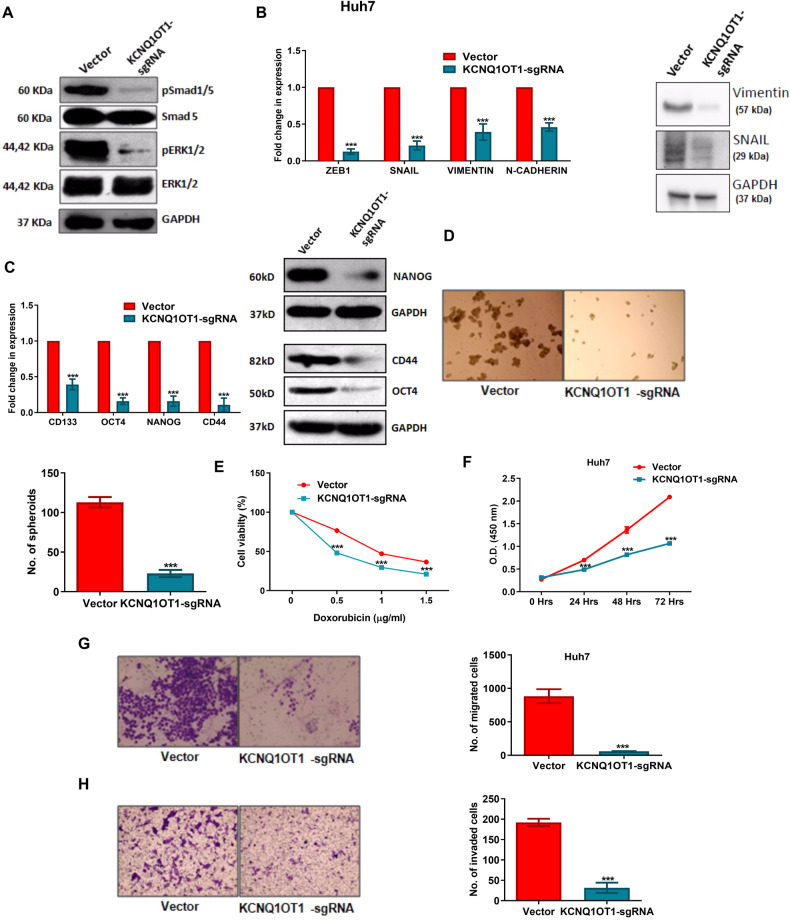
Diverse mechanisms have been established to understand the chemoresistance of hepatocellular carcinoma (HCC), but the contribution of non-coding RNAs is not surveyed well. Here, we aimed to explore the lncRNA-miRNA axis in Hepatitis C and B virus (HCV and HBV) infected HCC to investigate the molecular mechanism of chemoresistance and to identify a potential therapeutic target for HCC. The small RNA transcriptome analysis followed by qRT-PCR validation with the liver tissues of both HCV and HBV infected HCC patients revealed that miR-424-5p, miR-136-3p, miR-139-5p, miR-223-3p, and miR-375-3p were the most downregulated miRNAs in HCC compared to normal (log2 fold change ≤-1.5, Padj ≤ 0.05). In silico pathway analysis with the validated targets of each miRNA revealed that the signalling pathway regulating pluripotency of stem cells is commonly targeted by these five miRNAs. Subsequent validation by 3'UTR-luciferase assay and western blot analysis unveiled that these five miRNAs impeded either same or diverse genes, but all linked to BMP signalling pathway such as BMPR1A/BMPR1B by miR-139-5p, miR-136-3p, and miR-375-3p, and ACVR2A/ACVR2B by miR-424-5p and miR-223-3p. Furthermore, restoration of each miRNA in Huh7/SNU449 cells inhibited phosphorylation of downstream SMAD1/5 and ERK1/2, and attenuated Epithelial-mesenchymal transition, stemness, spheroid formation, chemoresistance, invasion and migration of cells. To investigate the mechanism of suppression of these miRNAs, "DIANA" tool was employed and lncRNA-KCNQ1OT1 was retrieved as interacting partner of all the five miRNAs. In vitro RNA pull-down assay revealed that lncRNA-KCNQ1OT1 physically interacted and sequestered these five miRNAs in the cytoplasm. Hence, KCNQ1OT1 was suppressed in Huh7/SNU449 cells using CRISPR technology and observed regression of oncogenic properties with enhanced chemosensitivity and reduced metastasis in cancer cells. Shrinkage of tumour size and volume in NOD-SCID mice injected with KCNQ1OT1-sgRNA cells further strengthened our observations. Thus, lncRNA-KCNQ1OT1 is the main regulator, which reduces the level of beneficiary miRNAs in the tumour milieu and modulates BMP signalling pathway to promote chemoresistance in HCC, suggesting lncRNA-KCNQ1OT1 might have robust potential to be a therapeutic target in HCC.


Conflict of interest statement

The authors declare no competing interests.

Figures

Fig. 1
Fig. 1. Selection and validation of downregulated miRNAs in HCC liver tissue.
(A) Heatmap represents the downregulated miRNAs in liver tissues of HCV-HCC (n = 5) vs. Control (n = 5). qRT-PCR analysis was performed with liver tissue samples from progressive disease stages of (B) HCV infection and (C) HBV infection including chronic hepatitis C (CHC) or chronic hepatitis B (CHB), liver cirrhosis (LC), and hepatocellular carcinoma (HCC) and normal (control). In vitro validation of the expression of the five downregulated miRNAs in (D) Huh7 and (E) SNU449 cells transfected with HCV and HBV producing plasmids, pS52/JFH1 (pHCV) and pSV2neoHBV2x (pHBV) vs. mock. p value was calculated using Mann–Whitney test for B, C and unpaired student’s t-test for D, E. *, **, ***, and **** indicate p value < 0.05, <0.01, <0.001, and <0.0001, respectively. ns indicates not significant.
Fig. 2
Fig. 2. Identification of pathway(s) commonly targeted by downregulated miRNAs and validation of targets.
(A) Graphical representation of KEGG pathway analysis with validated target genes of five miRNAs. (B) Integrated analysis of the target genes of the five miRNAs using miRNet. Expression analysis of target genes by qRT-PCR using (C) liver tissues of HCV and HBV infected HCC patients vs. control, and (D) Huh7 cells transfected with HCV (pS52/JFH1) and HBV (pSV2neoHBV2x) producing plasmids for 48 h. (E) The expression of target genes were determined in Huh7 cells transfected with pRNAU6.1 (vector), pScramble Pre-miRNA (Scr. miRNA), pPre-miRNA (miRNA), pPre-miRNA + scramble anti-miRNA oligo (Scr. anti-miRNA), or pPre-miRNA + anti-miRNA oligo (anti-miRNA) independently. (F) 3′UTR-Luciferase assay using Huh7 cells transfected with either wild-type-3′UTR-Luciferase construct (3’UTR-wt) alone or with pScramble pre-miRNA, pPre-miRNA, pPre-miRNA + scramble anti-miRNA oligo, pPre-miRNA + anti-miRNA oligo, separately and mutated-3′UTR-luciferase construct (3′UTR-mut) + pPre-miRNA. (G) Immunoblot analysis with anti-ACVR2A, anti-BMPR1B, anti-BMPR1A, and anti-GAPDH-HRP using lysates of Huh7 cells transfected with pRNAU6.1, pPre-miRNA, pPre-miRNA + anti-miRNA oligo, and pPre-miRNA + scramble anti-miRNA oligo. p value was calculated using Mann–Whitney test for C and unpaired student’s t-test for DF. *, **, *** indicate p-value < 0.05, <0.01, and <0.001 respectively. ns means not significant.
Fig. 3
Fig. 3. Impact of five miRNAs on BMP signalling cascade.
Immunoblot analysis with cell lysates of Huh7 cells transfected with (A) vector (pRNAU6.1) and five miRNAs independently, and (B) scrambled oligo, ACVR2A-AS, and BMPR1B-AS oligo to verify the expression of total SMAD5, p-SMAD5, ERK1/2, and p-ERK1/2. GAPDH was an internal loading control. (C) The expression analysis of SMAD4 in the purified nuclear and cytoplasmic fraction of Huh7 cells transfected with vector, pPre-miRNA, and pPre-miRNA + anti-miRNA oligo. Histone H3 and GAPDH were used as loading control for nuclear and cytoplasmic fraction respectively. Huh7 cells were transfected with vector, pPre-miRNA, and pPre-miRNA + anti-miRNA oligo, and assessed the expression of (D) EMT markers (SNAIL and Vimentin) and (E) Stemness markers (OCT4, CD44, and NANOG) by immunoblot analysis, (F) quantified spheroid number on ultralow attachment plate, and (G) detected doxorubicin sensitivity. Huh7 cells were transfected with vector, ACVR2A-AS, and BMPR1B-AS and quantified (H) the expression of EMT markers (ZEB1, SNAIL, VIMENTIN, E-CADHERIN) and Stemness markers (CD133, OCT4, NANOG, CD44) by qRT-PCR, (I) spheroid number, and (J) doxorubicin sensitivity. p value was calculated using unpaired student’s t-test for F, G, I, J, and two-way ANOVA for H. *, **, *** indicate p value < 0.05, <0.01, and <0.001, respectively.
Fig. 4
Fig. 4. Effect of miRNAs on proliferation, migration and invasion of Huh7 cells.
Huh7 cells were transfected with vector, pPre-miRNA, pPre-miRNA + anti-miRNA oligo and determined (A) cell proliferation at 0, 24, 48, and 72 h, (B) migration of cells in Boyden chamber at 24 h, and (C) invasion of cells through Matrigel coated Boyden chamber at 48 h. Huh7 cells were transfected with Scramble oligo, ACVR2A-AS and BMPR1B-AS oligo, and quantified (D) cell proliferation, (E) cell migration using wound-healing assay, and (F) cell invasion in Matrigel coated Boyden chamber. p value was calculated using unpaired student’s t-test for AF. *, **, ***, **** indicate p value < 0.05, <0.01, <0.001, and <0.0001, respectively. ns means not significant.
Fig. 5
Fig. 5. LncRNA-KCNQ1OT1 sponges five downregulated miRNAs.
(A) Cytoscape analysis was performed to verify interactions among five miRNAs and the predicted long non-coding RNA (lncRNAs). (B) A hierarchical clustering analysis with the deregulated lncRNAs in the liver tissue of HCV-HCC (n = 5) vs. Control (n = 5). Expression analysis of KCNQ1OT1 in (C) liver tissues of control, HCV and HBV-infected HCC, and (D) HCV and HBV-infected Huh7 cells. (E) Overall disease-free survival analysis using TCGA–LIHC data. KCNQ1OT1 was deleted in Huh7 cells using CRISPR tool and quantified the expression of (F) five miRNAs and (G) their target genes by qRT-PCR and immunoblot analysis. (H) RNA-immunoprecipitation (RIP) assay with the cell lysates of pAgo2-FLAG transfected Cas9-Huh7 and KCNQ1OT1-sgRNA-Huh7 cells that were immuno-precipitated with anti-FLAG antibody followed by quantified each miRNA in the pulled down RNA-Protein complex by qRT-PCR. (I) In vitro Biotin-Streptavidin pull down assay with Cas9-Huh7 and KCNQ1OT1-sgRNA-Huh7 cell lysates incubated with biotinylated lncRNA clones followed by qRT-PCR analysis of mature miRNAs. (J) KCNQ1OT1-sgRNA-Huh7 cells were transfected with pool of five anti-miRNAs and quantified each target gene. p value was calculated using unpaired student’s t-test for CJ. **, ***, **** indicate p value < 0.01, <0.001, and <0.0001 respectively. ns means not significant.
Fig. 6
Fig. 6. Characterization of KCNQ1OT1-sgRNA-Huh7 cells compared to Cas9-Huh7 cells.
(A) Immunoblot analysis of the downstream BMP signalling genes SMAD5, p-SMAD5, ERK1/2, p-ERK1/2 was performed with the lysates of Cas9-Huh7 and KCNQ1OT1-sgRNA-Huh7 cells. qRT-PCR and Immunoblot analysis of (B) EMT markers and (C) stemness markers was done with Cas9-Huh7 and KCNQ1OT1-sgRNA-Huh7 cells. The effect of KCNQ1OT1 deletion on cancer progression was measured by quantifying (D) spheroid number, (E) chemosensitivity to doxorubicin, (F) proliferation, (G) migration, and (H) invasion properties of Cas9-Huh7 and KCNQ1OT1-sgRNA-Huh7 cells. p value was calculated using unpaired student’s t-test for BH. *** indicates p value < 0.001.
Fig. 7
Fig. 7. Mice Xenograft model with KCNQ1OT1-sgRNA-Huh7 cells.
A NOD-SCID mice were injected with KCNQ1OT1-sgRNA Huh7 cells and Cas9-Huh7 cells into the right dorsal flank. At different time point, tumour volume and mass were determined. p value was calculated using Mann–Whitney test for A. * indicates p value < 0.05. B Graphical abstract of the study.

References

    1. Jm L. Hepatocellular carcinoma. Lancet. 2003;362:1907–17. doi: 10.1016/S0140-6736(03)14964-1. - DOI - PubMed
    1. Llovet JM, Kelley RK, Augusto V, Singal AG, Pikarsky E, Roayaie S, et al. Hepatocellular carcinoma (Primer) Nat Rev Dis Prim. 2021;7:6. doi: 10.1038/s41572-020-00240-3. - DOI - PubMed
    1. Perz JF, Armstrong GL, Farrington LA, Hutin YJ, Bell BP. The contributions of hepatitis B virus and hepatitis C virus infections to cirrhosis and primary liver cancer worldwide. J Hepatol. 2006;45:529–38. doi: 10.1016/j.jhep.2006.05.013. - DOI - PubMed
    1. Tabrizian P, Jibara G, Shrager B, Schwartz M, Roayaie S. Recurrence of hepatocellular cancer after resection: patterns, treatments, and prognosis. Ann Surg. 2015;261:947–55. doi: 10.1097/SLA.0000000000000710. - DOI - PubMed
    1. Yang JD, Hainaut P, Gores GJ, Amadou A, Plymoth A, Roberts LR. A global view of hepatocellular carcinoma: trends, risk, prevention and management. Nat Rev Gastroenterol Hepatol. 2019;16:589–604. doi: 10.1038/s41575-019-0186-y. - DOI - PMC - PubMed