. 2024 Jun 8;15(1):4909.
doi: 10.1038/s41467-024-49199-9.

Tobacco-induced hyperglycemia promotes lung cancer progression via cancer cell-macrophage interaction through paracrine IGF2/IR/NPM1-driven PD-L1 expression

Affiliations

Tobacco-induced hyperglycemia promotes lung cancer progression via cancer cell-macrophage interaction through paracrine IGF2/IR/NPM1-driven PD-L1 expression

Hyun-Ji Jang et al. Nat Commun. .

Abstract

Tobacco smoking (TS) is implicated in lung cancer (LC) progression through the development of metabolic syndrome. However, direct evidence linking metabolic syndrome to TS-mediated LC progression remains to be established. Our findings demonstrate that 4-(methylnitrosamino)-1-(3-pyridyl)-1-butanone and benzo[a]pyrene (NNK and BaP; NB), components of tobacco smoke, induce metabolic syndrome characteristics, particularly hyperglycemia, promoting lung cancer progression in male C57BL/6 J mice. NB enhances glucose uptake in tumor-associated macrophages by increasing the expression and surface localization of glucose transporter (GLUT) 1 and 3, thereby leading to transcriptional upregulation of insulin-like growth factor 2 (IGF2), which subsequently activates insulin receptor (IR) in LC cells in a paracrine manner, promoting its nuclear import. Nuclear IR binds to nucleophosmin (NPM1), resulting in IR/NPM1-mediated activation of the CD274 promoter and expression of programmed death ligand-1 (PD-L1). Restricting glycolysis, depleting macrophages, or blocking PD-L1 inhibits NB-mediated LC progression. Analysis of patient tissues and public databases reveals elevated levels of IGF2 and GLUT1 in tumor-associated macrophages, as well as tumoral PD-L1 and phosphorylated insulin-like growth factor 1 receptor/insulin receptor (pIGF-1R/IR) expression, suggesting potential poor prognostic biomarkers for LC patients. Our data indicate that paracrine IGF2/IR/NPM1/PD-L1 signaling, facilitated by NB-induced dysregulation of glucose levels and metabolic reprogramming of macrophages, contributes to TS-mediated LC progression.


Conflict of interest statement

The authors declare no competing interests.

Figures
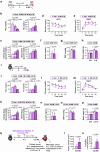
Fig. 1
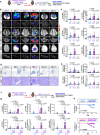
Fig. 1. Chronic exposure to NB causes metabolic syndrome in mice.
ap Two-month-old male FVB/N mice (FVB, ah) and C57BL/6 J mice (B6, ip) were given vehicle (Veh) or NB (NNK/BaP). The experimental schedule is summarized in (a) and (i). b, j Blood high-density lipoprotein (HDL) and triglyceride (TG) levels in mice (n = 6/group). c, k Fasting and basal blood glucose levels in mice (n = 5/group for FVB; n = 6/group for B6). d, l Changes in blood glucose concentration determined by intraperitoneal insulin tolerance (IPITT) test (n = 5/group). p-values of Veh vs NB (FVB): 0 min, p = 0.0002; 20 min, p = 0.0002; 40 min, p = 0.0015; 60 min, p = 0.0387; 120 min, p = 0.0621. p-values of Veh vs NB (B6): 0 min, p = 0.0027; 20 min, p = 0.0092; 40 min, p = 0.0075; 60 min, p = 0.0167; 120 min, p = 0.0349. e, m Changes in blood glucose concentration determined by intraperitoneal glucose tolerance (IPGTT) test (n = 5/group). p-values of Veh vs NB (FVB): 0 min, p < 0.0001; 20 min, p = 0.0001; 40 min, p = 0.0004; 60 min, p < 0.0001; 120 min, p < 0.0001. p-values of Veh vs NB (B6): 0 min, p < 0.0001; 20 min, p = 0.0123; 40 min, p = 0.0005; 60 min, p = 0.007; 120 min, p = 0.0014. f, n Serum insulin levels in mice (n = 5/group for the Veh group of FVB; n = 6/group for other groups of FVB and B6). g, o Systolic blood pressure (SBP) of mice (FVB: n = 7/group; B6: n = 6/group). h, p Body weight of mice (n = 10/group). q Schematic diagram of the experimental schedule. r The tumor volume of subcutaneous LLC tumors (LLC-Lucsc) (n = 9/group). s Changes in lung tumor formation determined by ex vivo bioluminescence imaging (BLI) (n = 9/group). The data are presented as the mean ± SD. *p < 0.05, **p < 0.01, and ***p < 0.001, determined by a two-tailed Student’s t-test (d, e, l, m). p-values were determined by using one-way ANOVA with Tukey’s post-hoc test (b, c, j, k), a two-tailed Student’s t-test (fh, np), or two-tailed Mann–Whitney test (r, s). Source data are provided as a Source Data file.
Fig. 2
Fig. 2. Chronic exposure to NB promotes lung cancer progression in high-carbohydrate diet (HCD)-fed mice.
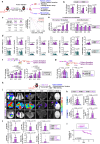
ae Two-month-old male C57BL/6 J (B6) mice were inoculated orthotopically with LLC-Luc cells. After lung tumor formation was confirmed, mice with LLC-Luc orthotopic tumors (LLC-Lucortho) were exposed to Veh or NB under standard diet (SD), high-carbohydrate diet (HCD), or high-fat diet (HFD) conditions for two months. The data is representative of two independent experiments with similar results. a Schematic diagram of the experimental schedule. b Representative ex vivo bioluminescence images of the lung, liver, posterior thoracic cage (PTC), anterior thoracic cage (ATC), brain, and spleen. c Quantitative analyzes of bioluminescence intensity (BLI) of analyzed organs (n = 6/group for Veh/SD, NB/SD, Veh/HCD, and NB/HCD groups; n = 10/group for Veh/HFD and NB/HFD groups). d Representative photographs of the H&E-stained sections of the lungs and liver. Scale bars: 2.5 μm (lung image); 50 μm (liver image). e Microscopic evaluation of H&E-stained lung and liver tissues for tumor multiplicity and burden (n = 12/group for Veh/SD, NB/SD, Veh/HCD, and NB/HCD groups; n = 17/group for Veh/HFD and NB/HFD groups). fh B6 mice with LLC-Lucortho were exposed to Veh or NB under SD or HCD conditions, either alone or together with 2-deoxy-D-glucose (2DG, 500 mg/kg) for 2 months. f Schematic diagram of the experimental schedule. g Quantitative analyzes of BLI of analyzed organs (n = 5/group for Veh/HCD and NB/HCD groups; n = 7/group for other groups). h Kaplan–Meier survival curve of the mice in each group (n = 11 for Veh/SD and NB/SD groups; n = 9 for Veh/SD/2DG and NB/SD/2DG groups; n = 17 for Veh/HCD and NB/HCD groups; n = 10 for Veh/HCD/2DG and NB/HCD/2DG groups). The data are presented as the mean ± SD. p-values were determined by using Kruskal–Wallis test with Dunn’s post-hoc test (c, e, g) or a log-rank test (h). Source data are provided as a Source Data file.
Fig. 3
Fig. 3. M2-like macrophages recruited and preconditioned by NB-induced metabolic reprogramming promote lung cancer progression.
ae C57BL/6 J (B6) mice with LLC-Lucortho were exposed to Veh or NB under HCD or HFD conditions for 2 months. a Schematic diagram of the experimental schedule. b Anchorage-independent (AID) colony formation (left, n = 5/group), sphere formation (middle, n = 4/group), and migration (right, n = 4/group) of LLC-Luc cells isolated from mice. c Tumorigenicity (n = 12/group) of LLC-Luc cells isolated from mice. The log-fraction plot was produced using online Extreme limiting dilution analysis (ELDA) software (right). d Immunofluorescence (IF) analysis of the indicated immune cells in lung tumors (n = 15/group). e Real-time PCR analysis of indicated marker expression in lung-derived primary macrophages (the CD45+F4/80+ population, n = 3/group). fg The AID colony formation and sphere formation capacities of A549 cells exposed to THP-1-derived conditioned medium (CM) that was produced under the indicated conditions (n = 5/group). hl B6 mice carrying LLC-Lucortho were exposed to Veh or NB under HCD conditions. Clodronate liposomes (Cld) were administered as summarized in (h). ij Ex vivo bioluminescence images (i) and quantitative analyzes of bioluminescence intensity (BLI) (j) of analyzed organs (n = 8 for the NB/HCD group; n = 10 for Veh/HCD and NB/HCD/Cld groups). k Quantitative analyzes of tumor multiplicity and burden using H&E-stained lung and liver tissues (n = 8 for Veh/HCD and NB/HCD groups; n = 10 for the NB/HCD/Cld group). l Kaplan–Meier survival curve of mice in each group (n = 14 for the Veh/HCD group; n = 15 for NB/HCD and NB/HCD/Cld groups). The data are presented as the mean ± SD. p-values were determined by using a two-tailed Student’s t-test (b, d, e), two-tailed Mann–Whitney test (d), one-way ANOVA with Tukey’s post-hoc test (f, g), Kruskal–Wallis test with Dunn’s post-hoc test (j, k), or a log-rank test (l). The data shown in (g) are representative of two independent experiments with similar results, and the data shown in b, e, and f are representative of three independent experiments with similar results. Source data are provided as a Source Data file.
Fig. 4
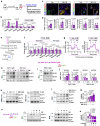
Fig. 4. NB increases glucose consumption in macrophages through elevated expression and membranous localization of GLUT1 and GLUT3.
af Lungs isolated from Veh- or NB-treated FVB mice for 5 months were subjected to various biological analyzes summarized in (a). b Real-time PCR analysis of the indicated GLUTs in the lungs (n = 3/group). c, d IF staining (c) and quantitative analysis (d) of GLUT1 and GLUT3 expression in the lungs of Veh- or NB-treated mice (n = 15/group). Scale bar: 50 μm. Scale bar (inset): 25 μm. e, f Schematic diagram of key glycolysis-TCA cycle metabolites (e) and these metabolites in the lungs (f) determined by LC/MS-based metabolomics (n = 6/group for the Veh group; n = 5/group for the NB group). g Seahorse analysis of oxygen consumption rate (OCR) (left) and extracellular acidification rate (ECAR) (right) in lung macrophages isolated from Veh- or NB-treated mice (n = 5/group). O: oligomycin; F: carbonyl cyanide p-trifluoromethoxy-phenylhydrazone (FCCP); R/A: rotenone/antimycin; 2DG: 2-deoxy-D-glucose. h, i Western blot (WB) analysis of THP-1 whole cell lysates (WCLs). j Real-time PCR analysis of SLC2A1 (encoding GLUT1) and SLC2A3 (encoding GLUT3) mRNA expression in THP-1 cells (n = 3/group). k, l WB analysis of the membrane fraction (MEM) of THP-1 cells. m Operetta high content imaging analysis of 2-NBDG fluorescent tracer uptake (n = 24/group) n, o THP-1 cells exposed to Veh or NB for 2 months were harvested. Vehicle (Veh) or the indicated inhibitors (P: 10 μM propranolol; M: 10 μM mecamylamine; and S: 1 μM SR1) were added to the cells 3 days before harvesting. n WB of GLUT1 and GLUT3 expression in WCL and MEM fraction. o Operetta high content imaging analysis of 2-NBDG fluorescent tracer uptake (n = 20/group). The data are presented as the mean ± SD. p-values were determined by using a two-tailed Student’s t-test (b, d, f), one-way ANOVA with Dunnett’s post-hoc test (j, o), or Kruskal–Wallis test with Dunn’s post-hoc test (m). The data are representative of two (data in b, gl, n) or three (data in m, o) independent experiments with similar results. Source data are provided as a Source Data file.
Fig. 5
Fig. 5. NB-primed macrophages under glucose-supplemented conditions upregulate IGF2 expression and activate IR in tumor cells in a paracrine manner.
a A phospho-receptor tyrosine kinase (RTK) array with lysates of the indicated CM-treated A549 cells for 30 min. b, f Western blot (WB) analysis of phosphorylated IGF-1R/IR (Y1135/36 for IGF-1R, Y1150/51 for IR) and IR levels in the indicated CM-treated A549 cells for 30 min. αIGF2Ab: IGF2 neutralizing antibody (5 μg/mL) c Immunoprecipitation (IP) analysis of IGF-1R and IR phosphorylation in the indicated CM-treated A549 cells for 30 min. d Real-time PCR analysis of IGF2, IGF1, or INS expression in THP-1 cells (n = 3 biologically independent replicates per group). 2DG: 5 mM 2-deoxy-D-glucose. e WB analysis of IGF2 expression in THP-1 cells. g Real-time PCR analysis of Igf2 mRNA (n = 3/group), immunohistochemistry (IHC) analysis of pIGF-1R/IR (Y1131 for IGF-1R, Y1146 for IR) expression (n = 25/group), and IF analysis of IGF2-expressing macrophages (IGF2+F4/80+) (n = 15/group) in LLC-Lucsc tumors. arb. units.: arbitrary units. h IGF2 ELISA using CM from CD45-F4/80- non-immune cells, CD45+F4/80- non-macrophage immune cells, and CD45+F4/80+ macrophages isolated from LLC-Lucsc tumors (n = 3/group). i, j Anchorage-independent colony formation and sphere formation of the indicated A549 cells treated with the CM from the indicated THP-1 cells (n = 5 biologically independent replicates per group). k The tumor volume of primary tumors of LLC cells co-injected with the indicated BMDMs (n = 14/group) and microscopic evaluation H&E-stained lung tissues (n = 7/group). l The tumor volume of primary tumors (n = 13 for LLC/sgRNACon groups and n = 10 for LLC/sgRNAIR groups) and microscopic evaluation H&E-stained lung tissues (n = 7 for LLC/sgRNACon groups and n = 6 for LLC/sgRNAIR groups). The data are presented as the mean ± SD. p-values were determined by using one-way ANOVA with Tukey’s post-hoc test (d, i, j), a two-tailed Student’s t-test (g, h), or Kruskal–Wallis test with Dunn’s post-hoc test (k, l). The data shown in bf, i, j are representative of two independent experiments with similar results. Source data are provided as a Source Data file.
Fig. 6
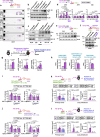
Fig. 6. IGF2 induces nuclear translocation of IR and its association with NPM1.
a Western blot (WB) analysis using the nuclear extract (NE) of CM-treated A549 cells. b Quantification of the immunofluorescence staining of nuclear phosphorylated IGF-1R/IR (pIGF-1R/IR, [Y1131 for IGF-1R, Y1146 for IR]) (n = 5 biologically independent replicates/group). arb. units.: arbitrary units. c Streptavidin pulldown analysis on membrane fractions (MEM), cytosol extracts (CE), and NE of IGF2 (50 ng/mL)-stimulated A549 cells. d WB analysis of non-chromatin (Chr-unbound) and chromatin (Chr-bound) fractions. e Immunoprecipitation (IP) analysis of the association of IR with KPNB1 and KPNA2 in IGF2-stimulated A549 cells. f WB analysis of nuclear pIGF-1R/IR (Y1135/36 for IGF-1R, Y1150/51 for IR) and IR levels in A549 cells. WCL: whole-cell lysates. g A representative image of Coomassie blue-stained gel on resolved anti-IR immunoprecipitants and common nuclear IR-associated proteins identified by LC-MS/MS analysis. NCL: nucleolin. h IP of the association of IR with NPM1, histones, and RNA polymerase II (Pol II) in A549 cells. i Schematic diagram depicting full-length (FL) and truncation mutants of NPM1. OD: oligomerization domain. HBD: histone binding domain. NBD: nucleic acid-binding domain. j Representative WB images of IP analysis and quantitative analysis (n = 3 biologically independent replicates/group) for the association of IR with NPM1 (FL or truncation mutants) in IGF2-stimulated H226Br cells for 3 h. k The association of IR with FL or HBD deletion mutant (ΔHBD) of NPM1 in IGF2-stimulated H226Br cells for 3 h. l Anchorage-independent colony formation (n = 3 biologically independent replicates/group) and sphere formation (n = 4 biologically independent replicates/group) capacities of the indicated A549 cells. m Schematic diagrams of experiments and quantitative analyzes of primary and metastatic lung tumor growth (LLC/sgRNACon + BMDM-Veh: n = 8; LLC/sgRNACon + BMDM-NB and LLC/sgRNANPM1 + BMDM-Veh: n = 6; LLC/sgRNANPM1 + BMDM-NB: n = 5). The data are presented as the mean ± SD. p-values were determined by using one-way ANOVA with Tukey’s post-hoc test (b, j, l) or Kruskal-Wallis test with Dunn’s post-hoc test (m). The data are representative of two (data shown in af, h, k, l) or three (data shown in j) independent experiments with similar results. Source data are provided as a Source Data file.
Fig. 7
Fig. 7. IGF2-induced association between IR and NPM1 in the nucleus increases PD-L1 expression, promoting LC progression.
ad Western blot (WB) analysis of the indicated protein expression in A549 and H226Br cells and their subclones. Cells were stimulated with IGF2 (50 ng/mL) for one day (a, b) or incubated with CMTHP-Veh or CMTHP-NB for one day (c, d). eg Indicated LC cells were exposed to IGF2 (50 ng/mL) for 3 h (for chromatin immunoprecipitation [ChIP] assay) (e, f) or 24 h (for luciferase reporter assay) (g). e, f ChIP assay of IR (e, f) or NPM1 (e) binding to the P3 region of the CD274 promoter (n = 3 biologically independent replicates/group). g Luciferase reporter assay of activation of the CD274 promoter (n = 3 biologically independent replicates/group). h WB analysis of the effect of IGF2 stimulation (50 ng/mL for 24 h) on the indicated protein expression in H226Br cells. im B6 mice carrying LLC-Lucortho were exposed to Veh or NB under HCD condition, either alone or together with intraperitoneal injection of anti-PD-L1 antibody (αPD-L1Ab, 100 μg in 100 μL/mouse, twice a week). The data is representative of two independent experiments. i Schematic diagram of the experimental schedule. j Representative ex vivo bioluminescence images of analyzed organs k Quantitative analyzes of bioluminescence intensity (BLI) of analyzed organs (n = 12/group for the Veh/HCD group; n = 11/group for the NB/HCD group; n = 13/group for the NB/HCD/αPD-L1Ab group). l Microscopic evaluation of H&E-stained lung and liver tissues for tumor multiplicity and burden (n = 10/group for the Veh/HCD group; n = 9/group for the NB/HCD group; n = 11/group for the NB/HCD/αPD-L1Ab group). m Kaplan–Meier survival curve of the mice in each group (n = 12/group). The data are presented as the mean ± SD. p-values were determined by using one-way ANOVA with Tukey’s post-hoc test (eg), Kruskal–Wallis test with Dunn’s post-hoc test (k, l), or a log-rank test (m). The data shown in ah are representative of two independent experiments with similar results. Source data are provided as a Source Data file.
Fig. 8
Fig. 8. IGF2 and GLUT1 expression levels in macrophages and pIGF-1R/IR and PD-L1 levels in tumors are associated with the metastatic status of lung cancer patients.
a Representative immunofluorescence (IF) images and quantitative analyzes of the indicated markers in patient-derived lung tissues from non-smokers (n = 3/group, 5 fields/slide [n = 15/group]) and smokers (n = 5/group, 6 fields/slide [n = 30/group]). Scale bar: 100 μm. b Representative IF staining images of the indicated markers using a tissue microarray (TMA) (n = 21 for the TNM N0 group; n = 14 for the TNM N1/2 group). Scale bars: 20 μm. c, left Correlation analysis for the Pearson correlation coefficient between IGF2 and GLUT1 levels in macrophages (n = 35/group). c, right Correlation analysis for the Spearman rank correlation coefficient between nuclear pIGF-1R/IR (Y1131 for IGF-1R, Y1146 for IR) and PD-L1 in tumor cells (n = 35/group). d Pie charts showing the levels of indicated markers in tumor tissues from patients with or without lymph node metastasis (N0 or N1/2, respectively; n = 21 for the TNM N0 group; n = 14 for the TNM N1/2 group). e Association of the expression level of the indicated markers with cancer stage (left, n = 16 for the stage I group; n = 14 for the stage II group; n = 5 for the stage III group) and tumor grade (right, n = 5 for the grade 1–2 group; n = 20 for the grade 2-3 group; n = 8 for the grade 3 group). f Analysis of a publicly available dataset (GSE30219) to determine the association of GLUT1 or GLUT3 levels with overall and disease-free survival (OS [n = 136/group] and DFS [n = 129/group], respectively) in patients with NSCLC. The data are presented as the mean ± SD. p-values were determined by using a two-tailed Student’s t-test (a, b), two-tailed Mann-Whitney test (a), one-way ANOVA with Tukey’s post-hoc test (e), Kruskal–Wallis test with Dunn’s post-hoc test (e), or a log-rank test (f). Source data are provided as a Source Data file.
Fig. 9
Fig. 9. A proposed model illustrating NB-induced lung cancer progression mediated by the tumor-prone microenvironment with metabolically reprogrammed macrophages.
In a glucose-rich microenvironment caused by systemic NB-induced hyperglycemia, NB increases glucose utilization in macrophages through GLUT1 and GLUT3 transcription and membranous localization upregulation, thereby inducing IGF2 transcription in macrophages. IGF2 stimulates IR in tumor cells in a paracrine manner, resulting in PD-L1 expression upregulation through IR nuclear translocation and a complex formation with NPM1 and Pol II. These events lead to the acquisition of cancer stem cell-like and immune-evasive properties in tumor cells, ultimately mediating metastatic tumor formation.

References

    1. Sung H, et al. Global cancer statistics 2020: GLOBOCAN estimates of incidence and mortality worldwide for 36 cancers in 185 countries. CA Cancer J. Clin. 2021;71:209–249. doi: 10.3322/caac.21660. - DOI - PubMed
    1. Sosa Iglesias V, Giuranno L, Dubois LJ, Theys J, Vooijs M. Drug resistance in non-small cell lung cancer: a potential for NOTCH targeting? Front Oncol. 2018;8:267. doi: 10.3389/fonc.2018.00267. - DOI - PMC - PubMed
    1. Zhang P, et al. Association of smoking and polygenic risk with the incidence of lung cancer: a prospective cohort study. Br. J. Cancer. 2022;126:1637–1646. doi: 10.1038/s41416-022-01736-3. - DOI - PMC - PubMed
    1. Hecht SS. Tobacco carcinogens, their biomarkers and tobacco-induced cancer. Nat. Rev. Cancer. 2003;3:733–744. doi: 10.1038/nrc1190. - DOI - PubMed
    1. Sobus SL, Warren GW. The biologic effects of cigarette smoke on cancer cells. Cancer. 2014;120:3617–3626. doi: 10.1002/cncr.28904. - DOI - PubMed

MeSH terms