

Modulation of serotonin transporter expression by escitalopram under inflammation
- PMID: 38851804
- PMCID: PMC11162477
- DOI: 10.1038/s42003-024-06240-3
Modulation of serotonin transporter expression by escitalopram under inflammation
Abstract
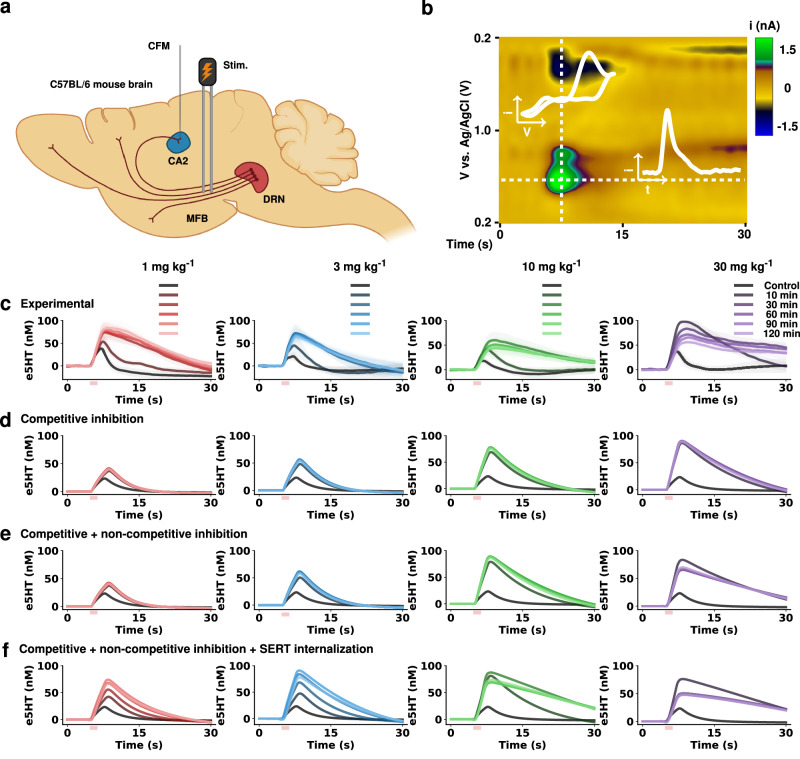
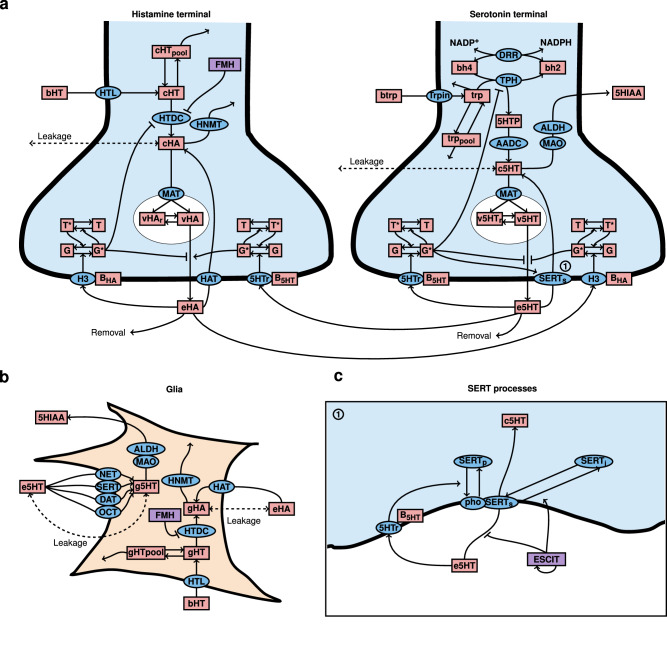
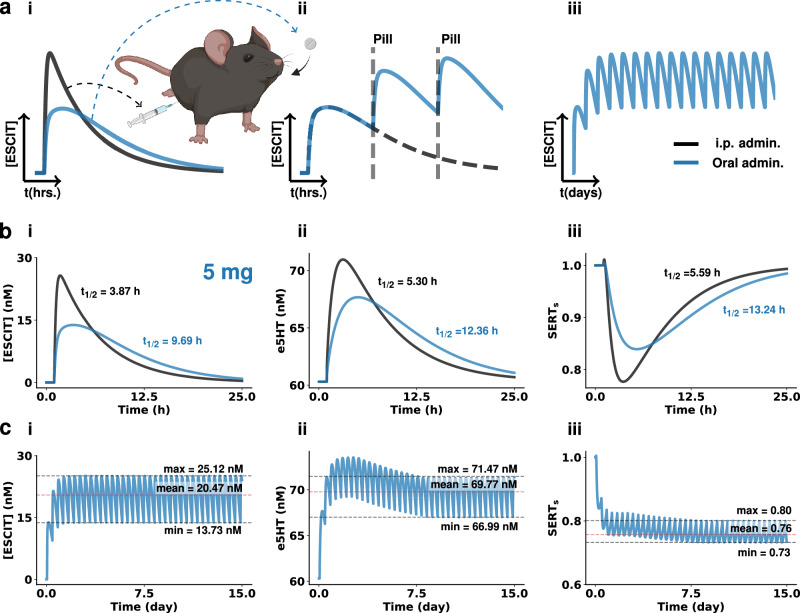
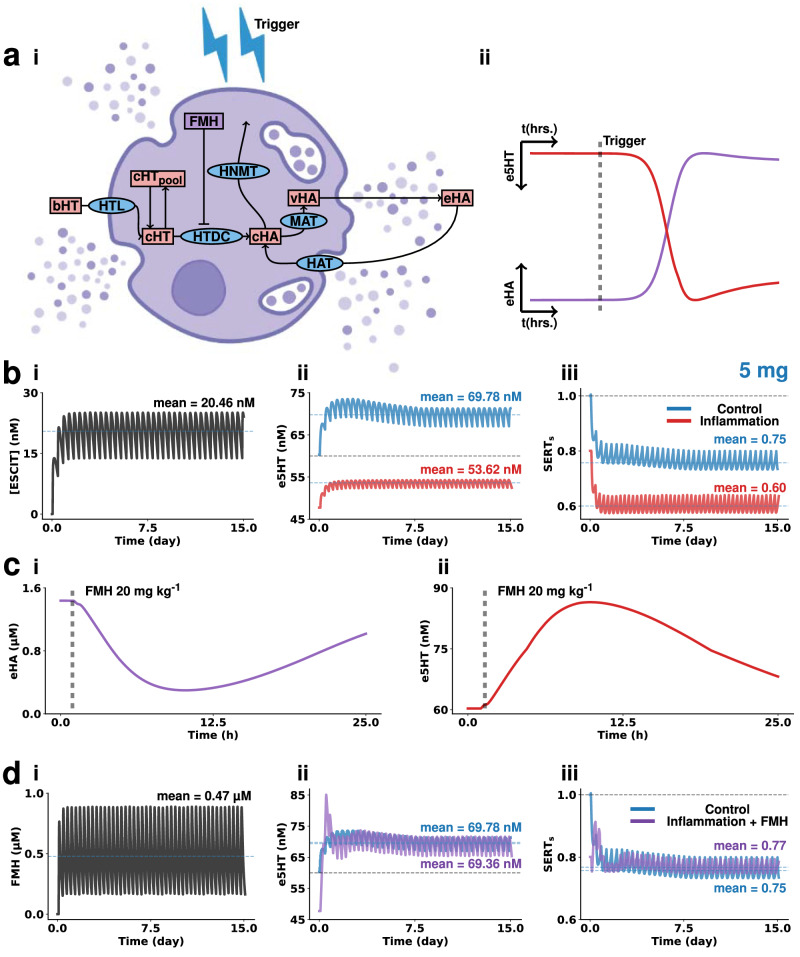
Selective serotonin reuptake inhibitors (SSRIs) are widely used for depression based on the monoamine deficiency hypothesis. However, the clinical use of these agents is controversial, in part because of their variable clinical efficacy and in part because of their delayed onset of action. Because of the complexities involved in replicating human disease and clinical dosing in animal models, the scientific community has not reached a consensus on the reasons for these phenomena. In this work, we create a theoretical hippocampal model incorporating escitalopram's pharmacokinetics, pharmacodynamics (competitive and non-competitive inhibition, and serotonin transporter (SERT) internalization), inflammation, and receptor dynamics. With this model, we simulate chronic oral escitalopram in mice showing that days to weeks are needed for serotonin levels to reach steady-state. We show escitalopram's chemical efficacy is diminished under inflammation. Our model thus offers mechanisms for how chronic escitalopram affects brain serotonin, emphasizing the importance of optimized dose and time for future antidepressant discoveries.
© 2024. The Author(s).
Conflict of interest statement
The authors declare no competing interests.
Figures
Similar articles
-
In vivo investigation of escitalopram's allosteric site on the serotonin transporter.Pharmacol Biochem Behav. 2016 Feb;141:50-7. doi: 10.1016/j.pbb.2015.11.010. Epub 2015 Nov 24. Pharmacol Biochem Behav. 2016. PMID: 26621784 Free PMC article.
-
Altered response to the selective serotonin reuptake inhibitor escitalopram in mice heterozygous for the serotonin transporter: an electrophysiological and neurochemical study.Int J Neuropsychopharmacol. 2012 Apr;15(3):349-61. doi: 10.1017/S1461145711000484. Epub 2011 Mar 25. Int J Neuropsychopharmacol. 2012. PMID: 21439106
-
[Escitalopram: a selective inhibitor and allosteric modulator of the serotonin transporter].Encephale. 2007 Dec;33(6):965-72. doi: 10.1016/j.encep.2007.11.001. Epub 2007 Dec 11. Encephale. 2007. PMID: 18789789 Review. French.
-
Selective Serotonin Reuptake Inhibitors within Cells: Temporal Resolution in Cytoplasm, Endoplasmic Reticulum, and Membrane.J Neurosci. 2023 Mar 29;43(13):2222-2241. doi: 10.1523/JNEUROSCI.1519-22.2022. Epub 2023 Mar 3. J Neurosci. 2023. PMID: 36868853 Free PMC article.
-
Escitalopram, an antidepressant with an allosteric effect at the serotonin transporter--a review of current understanding of its mechanism of action.Psychopharmacology (Berl). 2012 Jan;219(1):1-13. doi: 10.1007/s00213-011-2463-5. Epub 2011 Sep 8. Psychopharmacology (Berl). 2012. PMID: 21901317 Review.
Cited by
-
BDNF/BDNF-AS Gene Polymorphisms Modulate Treatment Response and Remission in Bipolar Disorder: A Randomized Clinical Trial.J Pers Med. 2025 Feb 7;15(2):62. doi: 10.3390/jpm15020062. J Pers Med. 2025. PMID: 39997339 Free PMC article.
-
Lipopolysaccharide Effects on Neurotransmission: Understanding Implications for Depression.ACS Chem Neurosci. 2024 Dec 18;15(24):4339-4347. doi: 10.1021/acschemneuro.4c00591. Epub 2024 Nov 27. ACS Chem Neurosci. 2024. PMID: 39601433 Free PMC article. Review.
-
Measurement of Real-Time Serotonin Dynamics from Human-Derived Gut Organoids.Anal Chem. 2025 Mar 11;97(9):5057-5065. doi: 10.1021/acs.analchem.4c06033. Epub 2025 Feb 26. Anal Chem. 2025. PMID: 40007472 Free PMC article.
-
Modulation of autism-associated serotonin transporters by palmitoylation: Insights into the molecular pathogenesis and targeted therapies for autism spectrum disorder.bioRxiv [Preprint]. 2025 Mar 13:2025.03.12.642908. doi: 10.1101/2025.03.12.642908. bioRxiv. 2025. PMID: 40161745 Free PMC article. Preprint.
-
Conditioned versus innate effort-based tasks reveal divergence in antidepressant effect on motivational state in male mice.Neuropsychopharmacology. 2025 Jun 3. doi: 10.1038/s41386-025-02140-0. Online ahead of print. Neuropsychopharmacology. 2025. PMID: 40456959
References
-
- Friedrich MJ. Depression is the leading cause of disability around the world. JAMA. 2017;317:1517. - PubMed
-
- Hirschfeld RMA. History and evolution of the monoamine hypothesis of depression. J. Clin. Psychiatry. 2000;61:4–6. - PubMed
-
- Erritzoe, D. et al. Brain Serotonin Release Is Reduced in Patients With Depression: A [11C]Cimbi-36 Positron Emission Tomography Study With a d-Amphetamine Challenge. Biol Psychiatry10.1016/j.biopsych.2022.10.012 (2022). - PubMed
Publication types
MeSH terms
Substances
Grants and funding
LinkOut - more resources
Full Text Sources
