HTR2B as a novel biomarker of chronic obstructive pulmonary disease with lung squamous cell carcinoma
- PMID: 38851806
- PMCID: PMC11162446
- DOI: 10.1038/s41598-024-63896-x
HTR2B as a novel biomarker of chronic obstructive pulmonary disease with lung squamous cell carcinoma
Abstract
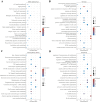
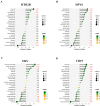
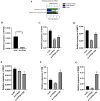
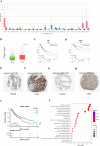
Chronic obstructive pulmonary disease (COPD) is often associated with lung squamous cell carcinoma (LUSC), which has the same etiology (smoking, inflammation, oxidative stress, microenvironmental changes, and genetics). Smoking, inflammation, and airway remodeling are the most important and classical mechanisms of COPD comorbidity in LUSC patients. Cancer can occur during repeated airway damage and repair (airway remodeling). Changes in the inflammatory and immune microenvironments, which can cause malignant transformation of some cells, are currently being revealed in both LUSC and COPD patients. We obtained the GSE76925 dataset from the Gene Expression Omnibus database. Screening for possible COPD biomarkers was performed using the LASSO regression model and a random forest classifier. The compositional patterns of the immune cell fraction in COPD patients were determined using CIBERSORT. HTR2B expression was analyzed using validation datasets (GSE47460, GSE106986, and GSE1650). HTR2B expression in COPD cell models was determined via real-time quantitative PCR. Epithelial-mesenchymal transition (EMT) marker expression levels were determined after knocking down or overexpressing HTR2B. HTR2B function and mechanism in LUSC were analyzed with the Kaplan‒Meier plotter database. HTR2B expression was inhibited to detect changes in LUSC cell proliferation. A total of 1082 differentially expressed genes (DEGs) were identified in the GSE76925 dataset (371 genes were significantly upregulated, and 711 genes were significantly downregulated). Kyoto Encyclopedia of Genes and Genomes pathway enrichment analysis indicated that the DEGs were mainly enriched in the p53 signaling and β-alanine metabolism pathways. Gene Ontology enrichment analysis indicated that the DEGs were largely related to transcription initiation from the RNA polymerase I promoter and to the regulation of mononuclear cell proliferation. The LASSO regression model and random forest classifier results revealed that HTR2B, DPYS, FRY, and CD19 were key COPD genes. Immune cell infiltration analysis indicated that these genes were closely associated with immune cells. Analysis of the validation sets suggested that HTR2B was upregulated in COPD patients. HTR2B was significantly upregulated in COPD cell models, and its upregulation was associated with increased EMT marker expression. Compared with that in bronchial epithelial cells, HTR2B expression was upregulated in LUSC cells, and inhibiting HTR2B expression led to the inhibition of LUSC cell proliferation. In conclusions, HTR2B might be a new biomarker and therapeutic target in COPD patients with LUSC.
Keywords: Biomarker; COPD; EMT; LUSC; Machine learning.
© 2024. The Author(s).
Conflict of interest statement
The authors declare no competing interests.
Figures




Similar articles
-
Significance of NKX2-1 as a biomarker for clinical prognosis, immune infiltration, and drug therapy in lung squamous cell carcinoma.PeerJ. 2024 May 1;12:e17338. doi: 10.7717/peerj.17338. eCollection 2024. PeerJ. 2024. PMID: 38708353 Free PMC article.
-
LINC01936 inhibits the proliferation and metastasis of lung squamous cell carcinoma probably by EMT signaling and immune infiltration.PeerJ. 2023 Dec 7;11:e16447. doi: 10.7717/peerj.16447. eCollection 2023. PeerJ. 2023. PMID: 38084139 Free PMC article.
-
Revealing roles of PANoptosis-related genes in prognosis and molecular subtypes in lung squamous cell carcinoma by integrated bioinformatic analyses and experiments.Clin Exp Med. 2025 May 12;25(1):154. doi: 10.1007/s10238-025-01696-x. Clin Exp Med. 2025. PMID: 40353888 Free PMC article.
-
THY1 is a prognostic-related biomarker via mediating immune infiltration in lung squamous cell carcinoma (LUSC).Aging (Albany NY). 2024 May 30;16(11):9498-9517. doi: 10.18632/aging.205880. Epub 2024 May 30. Aging (Albany NY). 2024. PMID: 38819947 Free PMC article.
-
miR-223-5p Suppresses OTX1 to Mediate Malignant Progression of Lung Squamous Cell Carcinoma Cells.Comput Math Methods Med. 2021 Jul 8;2021:6248793. doi: 10.1155/2021/6248793. eCollection 2021. Comput Math Methods Med. 2021. Retraction in: Comput Math Methods Med. 2023 Sep 27;2023:9792368. doi: 10.1155/2023/9792368. PMID: 34306176 Free PMC article. Retracted.
Cited by
-
Activation of HTR2B Suppresses Osteosarcoma Progression through the STAT1-NLRP3 Inflammasome Pathway and Promotes OASL1+ Macrophage Production to Enhance Antitumor Immunity.Adv Sci (Weinh). 2025 Aug;12(29):e15276. doi: 10.1002/advs.202415276. Epub 2025 May 19. Adv Sci (Weinh). 2025. PMID: 40387572 Free PMC article.
-
An integrated machine learning model of transcriptomic genes in multi-center chronic obstructive pulmonary disease reveals the causal role of TIMP4 in airway epithelial cell.Respir Res. 2025 Apr 23;26(1):158. doi: 10.1186/s12931-025-03238-1. Respir Res. 2025. PMID: 40269868 Free PMC article.
References
MeSH terms
Substances
LinkOut - more resources
Full Text Sources
Medical
Research Materials
Miscellaneous

